

Abstract
The development of metastasis is the leading cause of death and an enormous therapeutic challenge in cases of non‐small cell lung cancer. To better understand the molecular mechanisms underlying the metastasis process and to discover novel potential clinical markers for non‐small cell lung cancer, comparative proteomic analysis of two non‐small cell lung cancer cell lines with different metastatic potentials, the non‐metastatic CL1‐0 and highly metastatic CL1‐5 cell lines, was carried out using two‐dimensional electrophoresis followed by matrix‐assisted laser desorption ionization–time of flight mass spectrometry and tandem mass spectrometry. Thirty‐three differentially expressed proteins were identified unambiguously, among which 16 proteins were significantly upregulated and 17 proteins were downregulated in highly metastatic CL1‐5 cells compared with non‐metastatic CL1‐0 cells. Subsequently, 8 of 33 identified proteins were selected for further validation at the mRNA level using real‐time quantitative polymerase chain reaction, and three identified proteins, S100A11, PGP 9.5 and HSP27, were confirmed by western blotting. The protein S100A11 displaying significant differential expression at both the protein and mRNA levels was further analyzed by immunohistochemical staining in 65 primary non‐small cell lung cancer tissues and 10 matched local positive lymph node specimens to explore its relationship with metastasis. The results indicated that the upregulation of S100A11 expression in non‐small cell lung cancer tissues was significantly associated with higher tumor–node–metastasis stage (P = 0.001) and positive lymph node status (P = 0.011), implying that S100A11 might be an important regulatory molecule in promoting invasion and metastasis of non‐small cell lung cancer. (Cancer Sci 2007; 98: 1265–1274)
Abbreviations:
- 2‐DE
two‐dimensional electrophoresis
- ACN, acetonitrile; DHB, 2,5‐dihydroxybenzoic acid; DTT
dithiothreitiol
- CHAPS
3‐([3‐cholamidopropyl] dimethylamonio)‐1‐propane‐sulfonate
- IAA
iodoacetamide
- IEF
isoelectric focusing
- IPG
immobilized pH gradient
- MALDI‐TOF
matrix‐assisted laser desorption ionization–time of flight
- MS
mass spectrometry
- MS/MS
tandem mass spectrometry
- NSCLC
non‐small cell lung cancer
- PCR
polymerase chain reaction
- PMF
peptide mass fingerprinting
- PMSF
phenylmethylsulfonyl fluoride
- SDS
sodium dodecyl sulfate
- SDS‐PAGE
sodium dodecyl sulfate–polyacrylamide gel electrophoresis
- TFA, trifluoroacetic acid; TNM
tumor–node–metastasis.
Lung cancer is the leading cause of cancer‐related mortality worldwide. In some countries it has become the number one cancer killer, accounting for more deaths than prostate cancer, breast cancer and colorectal cancer combined.( 1 ) NSCLC, the most common histological subtype, represents 85% of all lung cancers and often develops metastases resulting in incurable disease at the time of diagnosis. Because of the lack of accurate early stage detection measures and efficient methods for preventing metastasis, the 5‐year survival rate for all stages combined is only 15%, and only 16% of lung cancers are diagnosed at an early stage.( 2 ) Therefore, investigations into the mechanisms of metastasis are required urgently for the early diagnosis and therapy of NSCLC.
Metastasis is a complex multistep process that includes invasion of tumor cells into the surrounding stroma, passage through the endothelial lining and into the vasculature, escape from blood vessels, and then colonization of distant organs. During the devastating process a series of changes occur in the tumor cells, providing them with the potential for invasion and subsequent localization at a secondary site. It is therefore quite difficult to attribute the mechanism of metastasis to a single factor. Considering many factors comprehensively will help us to illustrate the mechanism of metastasis more clearly and accurately.
High‐throughput and full‐scale proteomic technologies have given rise to the promise of global protein expression analyses rather than focusing only on certain genes. Moreover, comparative proteomics based on 2‐DE and MS facilitates the identification of novel useful protein markers associated with carcinogenesis and tumor progression in various cancers. During the past few years there have been a few reports of proteomic research on the metastasis of tumors such as hepatocellular carcinoma,( 3 ) breast carcinoma( 4 ) and head and neck carcinoma.( 5 ) However, to the best of our knowledge very few studies have involved a comprehensive proteomic analysis of lung cancer. Only Jiang et al. have identified some metastasis‐related proteins of lung giant‐cell carcinoma using proteomic techniques and demonstrated that interleukin‐18 might play a role in metastasis by inhibiting E‐cadherin expression.( 6 )
For comparative analysis of NSCLC metastasis, the metastatic model (containing the CL1‐0, CL1‐1, CL1‐2, CL1‐3, CL1‐4, CL1‐5 and CL1‐5F4 cell lines, listed in order of increasing metastatic potential) established by Chu et al. provides an excellent system with an isogeneic background.( 7 ) Metastasis‐associated molecules screened from the cell line series should be more authentic than those from a single pair of cells because occasional and irrelevant factors can be excluded. Many molecules, such as caveolin‐1, CRMP‐1 and CTGF, have been indicated to play important roles in promoting or inhibiting invasion and metastasis of lung cancer based on the cell line series.( 8 , 9 , 10 ) In the present study, considering the credibility of this model and the alleviation of the workload, two cell lines, non‐metastatic CL1‐0 and highly metastatic CL1‐5, were chosen to screen and identify differentially expressed proteins using a comparative proteomic approach. Thirty‐three differentially expressed proteins were identified unambiguously, among which 16 proteins were upregulated and 17 proteins were downregulated in the CL1‐5 cell line. Subsequently, some candidate proteins were validated by real‐time quantitative PCR of mRNA and western blotting of proteins.
Among the proteins identified as being differentially expressed, S100A11 exhibited a remarkable difference in expression level between the two cell lines at both the protein and mRNA levels. Although it has never been reported as being related to lung cancer metastasis, S100A11 has been reported to play many important roles in intracellular processes. For example, S100A11 has been associated with a variety of biological functions including growth inhibition of human epidermal keratinocytes,( 11 ) antiapoptotic functions in human uterine leiomyoma,( 12 ) and organization of membrane fusion events.( 13 ) Furthermore, the whole S100 Ca2+‐binding protein family displays significant functions in vivo and many members have been indicated to be involved in tumor growth, progression and invasion. Thus, a polyantibody of S100A11 was prepared by immunizing mice with purified recombinant S100A11 protein and applied to analyze the S100A11 expression level in 65 NSCLC tissues and 10 matched local positive lymph node specimens by immunohistochemical staining. The results showed that upregulation of S100A11 was significantly associated with higher TNM stage and positive lymph node status, indicating that S100A11 might be an important regulatory molecule in promoting invasion and metastasis of NSCLC.
Materials and Methods
Materials. IPG dry strips, IPG buffer, PhastGel™ blue R350, Pharmalyte and standard proteins were purchased from Amersham Biosciences (Uppsala, Sweden). DTT, IAA, CHAPS, urea, glycine, sorbitol and acetonitrile were obtained from Sigma (St Louis, MO, USA). Tris base and trypsin came from Promega (Madison, WI, USA). RPMI‐1640 was from Gibco BRL/Life Technologies (Gaithersburg, MD, USA) and fetal bovine serum was from PAA laboratories (Pasching, Austria). The pET‐30a(+) vector was from Novagen (Madison, WI, USA) and the Ni‐NTA affinity column was from QIAGEN (Hilden, Germany). All chemical buffers were prepared using Milli‐Q deionized water (Millipore, Bedford, MA).
Cell lines and tumor tissues. A series of lung adenocarcinoma cell lines (CL1‐0, CL1‐1, CL1‐2, CL1‐3, CL1‐5, CL1‐5F4) with gradually increasing metastatic potential were established by Chu et al. and gifted by Dr Yi‐Qing Wang and Dr Gang Fang (National Taiwan Normal Universities, Taipei, Taiwan), wherein CL1‐0 was the parental cell line and the others were sublines selected from CL1‐0 culture with a Matrigel‐coated polycarbonate membrane in a transwell invasion chamber, as described previously.( 7 ) All of them were grown in RPMI‐1640 medium supplemented with 10% fetal bovine serum at 37°C in 5% CO2. The paraffin‐embedded tissue specimens were obtained from the General Hospital of the Second Artillery, PLA, with informed consent signed by all of the donors. The tissues consisted of 30 adenocarcinoma, 35 squamous cell carcinoma and 10 matched local positive lymph nodes specimens, and information on the clinicopathologic characteristics of these NSCLC tissues was provided by the pathologists.
Sample preparation for 2‐DE. Cultured CL1‐0 and CL1‐5 cells were harvested when grown to approximately 80% confluence by treating with 0.25% trypsin and 0.02% ethylenediaminetetraacetic acid. The harvested cells were rinsed three times in a solution of 25 mM sorbitol and 10 mM Tris (pH 7.0) and then centrifuged in 1.5 mL tubes. The cell pellets were dissolved in lysis buffer containing 8 M urea, 4% CHAPS, 40 mM Tris‐HCl, 0.5% pharmalyte, 1 mg/mL aprotinin, 1 mg/mL leupeptin, 5 mM PMSF and 1% DTT. After 1 h of lysis on ice with gentle vortexing at 15‐min intervals, the mixture was centrifuged at approximately 12 000g for 1 h at 4°C. The supernatant was collected and stored at –80°C until further use. Protein concentration was determined using the Bradford assay.
2‐DE and image analysis. 2‐DE was carried out essentially as described in the 2‐DE handbook from Amersham Biosciences on Amersham's Ettan IPGphor and Ettan DALT Six systems. Briefly, one‐dimensional IEF was carried out on an 18‐cm, pH 3–10/pH 4–7 linear IPG strip at 20°C with 1 mg protein in 350 µL rehydration buffer (8 M urea, 2% CHAPS, 0.3% DTT and 1% IPG buffer). Rehydration was carried out at 30 V for 12 h and the sample focusing conditions were as follows: 100 V for 1 h, 500 V for 1 h, 1000 V for 1 h, 8000 V gradient for 0.5 h, and 8000 V for 60000 Vh. Following IEF separation, the gel strips were equilibrated with SDS equilibration buffer I (6 M urea, 50 mM Tris‐HCl, 30% glycerol, 2% SDS, 1% DTT) for 15 min, and then equilibration buffer II (6 M urea, 50 mM Tris‐HCl, 30% glycerol, 2% SDS, 2.5% IAA) for 15 min. Afterwards, the equilibrated strips were transferred onto a second‐dimensional 12.5% SDS‐PAGE gel and sealed with 0.5% agarose. The second‐dimensional SDS‐PAGE was carried out at 5 W per strip for 1 h and then 17 W per strip until the bromophenol blue reached the bottom of the gels. The separated proteins were visualized with PhastGel™. To obtain the well‐resolved and reproducible two‐dimensional gel, both the pH 3–10 and pH 4–7 2‐DE were repeated three times for every sample under the same conditions. The stained gels were scanned at an optical resolution of 300 dpi using the MagicScan densitometer in transmission mode and were analyzed with the software ImageMaster 2D Elite. The spots that showed similar qualitative changes in all three parallel repeats and whose expression level change was greater than two‐fold were taken as candidate proteins for MS identification.
In‐gel digestion and protein identification by MALDI‐TOF/MS and MS/MS. Protein spots were excised manually from the stained gels, rinsed three times with Milli‐Q water, and then destained in 25 mM NH4HCO3/50% acetonitrile until the gel pieces became transparent. Prior to the addition of trypsin, the clear gel pieces were dehydrated with 100% acetonitrile for 5 min and dried. The dried gel pieces were then incubated in 10 µL trypsin solution (trypsin concentration, 10 ng/µL; total, 100 ng) at 37°C overnight. Afterwards, 1 µL trypsin‐digested peptide mixture mixed with 0.6 µL matrix solution (50 mg/mL DHB in 50% ACN/0.1% TFA) were loaded onto a stainless steel 100‐well MS plate and air dried. The samples were then analyzed on Qstar Pulser I Quadruple time‐of‐flight mass spectrometer (Applied Biosystems/MDS Sciex, Toronto, Canada) to get the MS and MS/MS data for these proteins. Spectra were calibrated with a trypsin‐fragment peak serving as an internal standard. Subsequently, protein identification was determined by searching in the SWISS‐PROT database using the MASCOT search engine (http://www.matrixscience.com). The searching parameters were set up as follows: the mass tolerance was ±0.3 Da; the number of missed cleavage sites was allowed up to 1; modifications were carbamidomethylation (fixed) and oxidation of methionine (variable); the peptide ion was [M + H]+; and the monoisotopic masses were used.
Real‐time quantitative PCR. Total RNA was isolated from cells using Trizol reagent (Invitrogen, Carlsbad, CA, USA) according to the manufacturer's instructions, and 2 µg was reverse transcribed into single‐stranded cDNA in 20 µL reaction buffer using Molony murine leukemia virus reverse transcriptase and oligo (dT)15 (Promega) as a primer. Primers of S100A11, PGP9.5, HSP27, pirin, galectin‐1, vimentin, GDIR, LASP1 and β‐actin used for real‐time quantitative PCR were designed using Primer 5 software (Table 1). The reactions were carried out on the ABI 7300 Real‐Time PCR System with SYBR® Green (Applied Biosystems). β‐Actin was chosen as an internal control. Each experiment was carried out in a 20‐µL reaction volume containing 10 µL SYBR® Green PCR Master Mix (Applied Biosystems), 2 µL cDNA or H2O as a negative control, 0.8 µL of forward and reverse primers (Table 1; 10 mM each), and 6.4 µL distilled H2O. Thermal cycle conditions for all of the genes were as follows: 95°C for 10 min, followed by 40 cycles of 95°C for 30 s, 60°C for 30 s and 72°C for 30 s. A uniform amplification of the products was rechecked by analyzing the melting curves of the amplified products. All reactions were carried out in triplicate to assess reproducibility. The relative quantitation of mRNA expression was calculated using the comparative Ct (the threshold cycle) method using the follow formula:
Table 1.
Primer sequences and their Tm (°C), and the product sizes of S100A11, galectin‐1, LASP1, pirin, PGP9.5, HSP27, GDIR, vimentin and β‐actin genes for real‐time quantitative polymerase chain reaction
| Gene | Direction | Primer sequences (5′‐3′) | Tm (°C) | Product size (bp) |
|---|---|---|---|---|
| S100A11 | Sense | GAGTCCCTGATTGCTGTCTTCC | 60 | 130 |
| Antisense | CAGGGTCCTTCTGGTTCTTTGT | |||
| Galectin‐1 | Sense | TCCTCCTGGACTCAATCATGG | 60 | 118 |
| Antisense | TTCAGCACGAAGCTCTTAGCG | |||
| LASP1 | Sense | CAAAATACCACCCTACAAACC | 60 | 157 |
| Antisense | CCAAAATGAGACAACAACCC | |||
| Pirin | Sense | AACCCAGTAAGGATGGTGTGAC | 60 | 141 |
| Antisense | TAGGGATAGGTTGGGAATGTTT | |||
| PGP9.5 | Sense | ATGAACTTGATGGACGAATGCC | 60 | 120 |
| Antisense | GGACTTCTCCTTGCTCACGCTC | |||
| HSP27 | Sense | CCCAAGTTTCCTCCTCCCTGTC | 60 | 160 |
| Antisense | GCGGCAGTCTCATCGGATTTT | |||
| GDIR | Sense | GCATCAAGTCCCGCTTCACA | 60 | 134 |
| Antisense | TCCGTCGTCCGTCCGTCAGT | |||
| Vimentin | Sense | CACCTGTGAAGTGGATGCCC | 60 | 167 |
| Antisense | CACGAAGGTGACGAGCCATT | |||
| β‐Actin | Sense | GTGACAGCAGTCGGTTGGAG | 60 | 149 |
| Antisense | AGTGGGGTGGCTTTTAGGAT |
Tm, melting temperature.
where ΔCt = Ct of target genes – Ct of endogenous control gene (β‐actin).( 14 )
Expression of S100A11 recombinant protein and preparation of polyclonal antibody. The prokaryote expression vector pET‐30a(+)‐S100A11 was constructed by cloning the full‐length S100A11 gene into the pET‐30a(+) empty vector. The pET‐30a(+)‐S100A11 vector was then transformed into Escherichia coli BL21 cells to obtain the N‐His‐tagged recombinant S100A11 protein. The His‐S100A11 fusion protein was purified from the transformed cell extracts by affinity chromatography on a Ni‐NTA affinity column using a denaturing protocol according to the manufacturer's instructions. Protein purity and quantity were analyzed by SDS‐PAGE followed by staining with Coomassie blue and confirmation of the protein identity with MALDI‐TOF and MS/MS as described above. For preparation of the anti‐S100A11 antibody, mice were immunized four times for 2 months with purified recombinant human S100A11 protein (the first time at 300 µg per mouse and the next three times at 100 µg per mouse). After immunization, immune serum was collected and analyzed by western blotting to observe whether it could react specifically with human S100A11 protein.
Western blot analysis. Proteins were extracted from the cultured cells and quantitated as described above for 2‐DE. Aliquots of protein samples (40 µg) were separated on 12.5% SDS‐PAGE gels and then transferred onto nitrocellulose membranes (Amersham Biosciences) using a wet transfer unit (Bio‐Rad, Richmond, CA, USA). After blocking with 5% bovine serum albumin in 1× TBST solution (25 mM Tris [pH 7.5], 150 mM NaCl, 0.05%[v/v] Tween‐20) for 1 h at room temperature, the membranes were incubated with mouse anti‐S100A11 polyclonal antibody (1:500), goat anti‐PGP9.5 polyclonal antibody (1:1000; Chemicon International, Temecula, CA, USA), goat anti‐HSP27 antibody (1:1000; Santa Cruz Biotechnology, Santa Cruz, CA, USA) and rabbit anti‐α‐tubulin antibody (1:2000; Santa Cruz Biotechnology) for 1 h at 37°C or overnight at 4°C, followed by alkaline phosphatase‐conjugated horse antimouse, rabbit antigoat or goat antirabbit IgG (1:1000) for 1 h at 37°C. α‐Tubulin was chosen as an internal control for equal protein loading. Target proteins were detected using 5‐bromo‐4‐chloro‐3‐indoyl phosphate and nitro blue tetrazolium.
Immunohistochemical analysis of S100A11. Paraffin‐embedded sections (5 µm) were deparaffinized in xylene and rehydrated in a graded alcohol series followed by antigen retrieval, endogenous peroxidase blocking with 3% H2O2 and blocking with 3% normal goat serum. The sections were then incubated with the primary antibody (mouse anti‐S100A11 serum, 1:100) overnight at 4°C, and the PowerVision two‐step histostaining reagent and 3,3′‐diaminobenzidine tetrahydrochloride substrate kit (Zhongshan Golden Bridge Biotechnology, Beijing, China) were used to visualize the localization of the antigen according to the manufacturer's instructions. Finally, sections were counterstained with hematoxylin and mounted in neutral balsam. For the negative controls, the primary antibody was replaced with pre‐immune serum originating from the same mouse with the S100A11 antibody. Immunohistochemical (IHC) staining was evaluated semiquantitatively by a pathologist and a biologist. The percentage of positive tumor cells in 10 visual fields selected randomly served as the evaluation rule, and all of the staining results were categorized as follows: –, less than 5% tumor cells were positive; +, 5–25% were positive; ++, 25–50% were positive; +++, more than 50% were positive. Statistical analysis was carried out using SPSS v.13.0 software. Relationships between S100A11 expression levels and the clinicopathologic characteristics of the samples were evaluated using Student's t‐test, Fisher's exact test or Pearson χ2‐test. A P‐value of less than 0.05 (two‐tailed) was considered to be statistically significant.
Results
Thirty‐three proteins were differentially expressed in CL1‐0 and CL1‐5 cells. To explore the NSCLC metastasis‐related proteins, we compared the protein expression profiling of CL1‐0 and CL1‐5 cell lines with different metastatic abilities by 2‐DE. Total protein separation was first carried out on pH 3–10 IPG strips three times under the same conditions. The number of protein spots in three gels analyzed by software was 917 ± 29 in CL1‐0 and 935 ± 36 in CL1‐5, and the average matching rate between these two groups of gels was 86.2%. On the pH 3–10 gels, most protein spots were gathered in the area of pH 4–7. We consequently processed three reproducible pH 4–7 gels of CL1‐0 and CL1‐5 to further analyze their differential protein expression. Approximately 1129 ± 41 spots for CL1‐0 and 1153 ± 39 spots for CL1‐5 were visualized, and the average matching rate was 81.5%. According to software analysis, those spots possessing over two‐fold changes in percentage volume (vol%) after normalization were regarded as showing a notable difference.
Those spots showing consistently different expression in all three parallel experiments were excised and subjected to subsequent MALDI‐TOF/MS analysis. As for each protein spot, MS/MS analysis was carried out after MALDI‐TOF/MS to verify the identification by PMF. All of the identities of the candidate proteins were determined by searching databases with both PMF data and MS/MS fragment ions. Among 58 excised spots, 46 spots corresponding to 33 different gene products were successfully identified in pH 3–10 and pH 4–7 gels, among which 16 proteins were upregulated and 17 proteins were downregulated in highly metastatic CL1‐5 compared with the CL1‐0 cell line. The identified differentially expressed protein spots were labeled in 2‐DE gels of both cell lines, as shown in Fig. 1. Those differential proteins identified simultaneously in both pH 3–10 and pH 4–7 gels were only labeled in pH 4–7 gels. The protein spot numbers, Swiss‐Prot ID, molecular mass weights, pI, MASCOT search scores and sequence coverage percentages are listed in Table 2.
Figure 1.
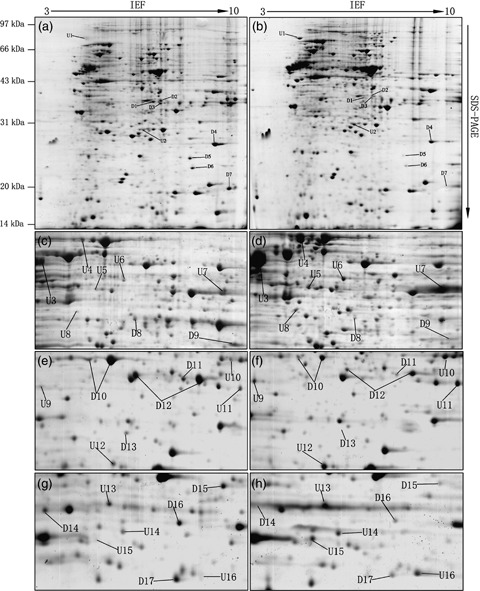
Representative PhastGel™‐stained 2‐D electrophoresis (2‐DE) patterns of the CL1‐0 (a,c,e,g) and CL1‐5 (b,d,f,h) cell lines. For each, 1 mg protein samples were separated on linear immobilized pH gradient strips, followed by 12.5% sodium dodecyl sulfate–polyacrylamide gel electrophoresis (SDS–PAGE). (a,b) Complete maps of the pH 3–10 gels. (c–h) Partial enlarged view of pH 4–7 gels. Thirty‐three differentially expressed protein spots identified by matrix‐assisted laser desorption ionization–time of flight /mass spectrometry (MS) and MS/MS were labeled in the above 2‐DE gels of both cell lines. U1–U16 refer to the proteins upregulated in CL1‐5, and D1–D17 refer to those downregulated in the CL1‐5 cell line. Those differential proteins identified simultaneously in both pH 3–10 and pH 4–7 gels were only labeled in pH 4–7 gels.
Table 2.
List of proteins identified as being differentially expressed
| Spot no. | Protein AC † | Protein name | M r (Da) ‡ | pI § | MASCOT score ¶ | Sequence coverage (%) ‡‡ |
|---|---|---|---|---|---|---|
| Summary of identified proteins upregulated in the metastatic CL1‐5 cell line | ||||||
| U1 | P11021 | 78 kDa glucose‐regulated protein (precursor) | 72333 | 5.07 | 178 | 25 |
| U2 | Q9Y224 | Protein C14orf166 | 28068 | 6.19 | 129 | 43 |
| U3 | P08670 | Vimentin | 53520 | 5.06 | 172 | 29 |
| U4 | P11142 | Heat shock 70 kDa protein 8 | 70898 | 5.37 | 190 | 33 |
| U5 | P05783 | Cytokeratin 18 | 47927 | 5.34 | 89 | 33 |
| U6 | P05787 | Cytokeratin 8 | 53543 | 5.37 | 114 | 38 |
| U7 | P06733 | Alpha enolase | 47038 | 6.99 | 145 | 33 |
| U8 | O76003 | Thioredoxin‐like protein 2 | 37432 | 5.31 | 168 | 42 |
| U9 | P52565 | Rho GDP‐dissociation inhibitor 1 (GDIR) | 23207 | 5.02 | 86 | 31 |
| U10 | P60174 | Triosephosphate isomerase | 26538 | 6.51 | 95 | 38 |
| U11 | P09429 | High mobility group protein 1 | 24763 | 5.62 | 94 | 61 |
| U12 | P16949 | Stathmin | 17171 | 5.87 | 129 | 51 |
| U13 | O14737 | Programmed cell death protein 5 | 14154 | 5.78 | 82 | 38 |
| U14 | Q9NRX4 | 14 kDa phosphohistidine phosphatase | 13833 | 5.99 | 97 | 36 |
| U15 | P09382 | Galectin‐1 | 14585 | 5.34 | 106 | 41 |
| U16 | P31949 | S100A11 | 11740 | 7.18 | 110 | 45 |
| Summary of identified proteins downregulated in the metastatic CL1‐5 cell line | ||||||
| D1 | P04083 | Annexin A1 | 38583 | 7.02 | 133 | 52 |
| D2 | Q99439 | Calponin‐2 | 33566 | 6.92 | 76 | 22 |
| D3 | O00625 | Pirin | 32113 | 6.42 | 93 | 25 |
| D4 | Q06830 | Peroxiredoxin‐1 | 22110 | 8.27 | 67 | 35 |
| D5 | P30043 | Flavin reductase | 21988 | 7.31 | 86 | 35 |
| D6 | P30086 | Phosphatidylethanolamine‐binding protein 1(RKIP) | 20925 | 7.42 | 153 | 54 |
| D7 | P22392 | Nucleoside diphosaphate kinase B (nm23‐H2) | 17298 | 8.52 | 73 | 33 |
| D8 | P49903 | Selenide, water dikinase 1 | 42911 | 5.64 | 126 | 33 |
| D9 | Q14847 | LIM and SH3 domain protein 1 (LASP1) | 29717 | 6.61 | 83 | 20 |
| D10 | P09936 | PGP9.5 (UCHL1) | 24824 | 5.33 | 94 | 51 |
| D11 | P62993 | Growth factor receptor‐bound protein 2 | 25206 | 6.31 | 71 | 29 |
| D12 | P04792 | HSP 27 | 22783 | 5.98 | 72 | 25 |
| D13 | P32119 | Peroxiredoxin‐2 | 21892 | 5.67 | 90 | 34 |
| D14 | O75347 | Tubulin‐specific chaperone A | 12724 | 5.07 | 99 | 37 |
| D15 | Q9UHV9 | Prefoldin subunit 2 | 16648 | 6.20 | 123 | 46 |
| D16 | Q99471 | Prefoldin subunit 5 | 17328 | 5.93 | 93 | 49 |
| D17 | P07108 | Acyl‐CoA‐binding protein | 9913 | 6.55 | 89 | 43 |
SWISS‐PROT accession number of each protein.
‡ Theoretical molecular weight of the matching protein in Da.
§ Theoretical isoelectric point of the matching protein.
¶ MASCOT score for SWISS‐PROT database search based on PMF.
‡‡ Percentage of identified sequence compared to the complete sequence of the known protein.
Real‐time quantitative PCR revealed the same trends in 2‐DE results for six out of eight candidate genes, and a gradual increase in S100A11 mRNA in the serial metastatic cell lines. To confirm the results described above, we used real‐time quantitative PCR to detect the correlation between the protein and mRNA levels of eight differentially expressed proteins: S100A11, PGP9.5, HSP27, pirin, galectin‐1, LASP1, vimentin and GDIR. The relative mRNA expression of the genes in CL1‐5 were evaluated by calculating the comparative ratio to that in the CL1‐0 cells using the formula described above. As shown in Fig. 2a, the mRNA expression levels of S100A11, galectin‐1 and vimentin were significantly upregulated (over two‐fold) in CL1‐5 compared with CL1‐0, whereas PGP9.5, HSP27 and pirin were downregulated, with the same trends as the results of 2‐DE. However, the other two genes, LASP1 and GDIR, showed no notable change. According to the above results, S100A11 expression showed a very large difference at the mRNA level, similar to the protein level on two‐dimensional gels, which attracted us to focus on it and measure its expression change in the series of cells with increased metastatic potentials. As shown in Fig. 2b, S100A11 mRNA in the serial metastatic cells displayed mainly successively increased expression along with their metastatic potentials, except that CL1‐3 had a slight descent. Such increasing trends in the serial metastatic cells further implied that S100A11 might play an important role in the metastatic course of NSCLC.
Figure 2.
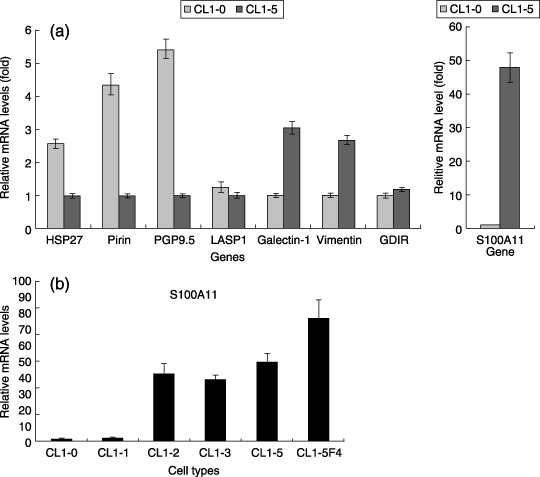
Real‐time quantitative polymerase chain reaction analysis of some candidate genes. (a) Relative mRNA expression ratios of HSP27, pirin, PGP9.5, LASP1, galectin‐1, vimentin, GDIR and S100A11 mRNA expression in non‐metastatic CL1‐0 and highly metastatic CL1‐5. β‐Actin was used as an internal control. The histogram of the S100A11 gene is illustrated separately because of the large difference in both cell lines. (b) Relative mRNA expression levels of S100A11 in serial metastatic cells CL1‐0, CL1‐1, CL1‐2, CL1‐3, CL1‐5 and CL1‐5F4. β‐Actin was used as an internal control. The data are shown as means of three independent experiments ± SD.
Differential expression of the S100A11, PGP9.5 and HSP27 proteins validated by western blot analysis. The S100A11 polyclonal antibody was prepared by immunizing mice with purified recombinant S100A11 protein. After the final immunization, the mouse immune serum collected was subjected to western blotting with total cell protein of CL1‐5 cells. The western blotting results (Fig. 3a) assured us that the immune polyclonal antibody could react specifically with the S100A11 protein of 11 kDa.
Figure 3.
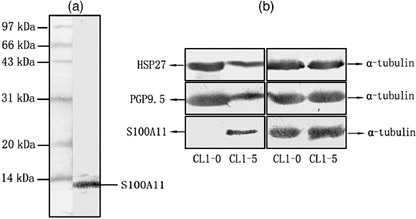
Results of western blot analysis. (a) The specificity of mouse antihuman S100A11 antibody was confirmed. (b) Validation of the differential expression of HSP27, PGP9.5 and S100A11 proteins between the CL1‐0 and CL1‐5 cell lines. α‐Tubulin was used as an internal control for equal protein loading.
Afterwards, to further confirm the comparative proteomic results, we carried out western blot analysis of S100A11 and two other randomly selected proteins (PGP9.5 and HSP27) to verify their differential expression in the CL1‐0 and CL1‐5 cells. Equal protein loading was proved by a parallel α‐tubulin blot experiment. As displayed in Fig. 3b, PGP9.5 and HSP27 were both notably downregulated in the CL1‐5 cell line and S100A11 was almost absent in the CL1‐0 cell line. The results were in agreement with those of the 2‐DE and proved the creditability of comparative proteomic analysis.
S100A11 expression level was significantly associated with TNM stage and lymph node status of NSCLC tissues. Although the isogenic cell model provides an advantageous system for metastatic research, the culture course in vitro makes it difficult to absolutely reflect the internal environment and biological events of the human body. It is therefore very important to validate the results of the cell model at the tissue level using immunohistochemistry so as to find some genuine potential clinical protein markers.
In our study, immunohistochemical staining of 65 primary tumor specimens and 10 matched local positive lymph nodes specimens was carried out to show the expression of S100A11 in human NSCLC. Negative controls with pre‐immune serum as the primary antibody demonstrated negative results. The positive staining patterns of cancer cells in adenocarcinoma and squamous cell carcinoma tissues were mainly uniform. S100A11 protein was found in both the cytoplasm and nuclei in some positive cells, whereas in others it was only in the cytoplasm. Similar subcellular localization was seen in the matched local positive lymph node specimens (Fig. 4). To investigate the involvement of S100A11 in the NSCLC metastasis process, we evaluated the staining results of 65 primary tumors semiquantitatively followed by statistical analysis of the relationship between S100A11 expression and some clinicopathologic characteristics. According to the statistical results, the increase in S100A11 expression levels in these tumors was found to be significantly associated with advanced TNM stage (stages III and IV) (P = 0.001) and positive status of the lymph nodes (N1–3) in tumors (P = 0.011). No significant correlations were found between S100A11 expression and other characteristics, including sex, age, histological subtype (adenocarcinoma and squamous cell carcinoma), tumor status and differentiation status. All of the statistical results are shown in Table 3. Additionally, we found that S100A11 expression levels in 5 out of 10 matched local positive lymph node specimens were higher than the corresponding primary tumors.
Figure 4.
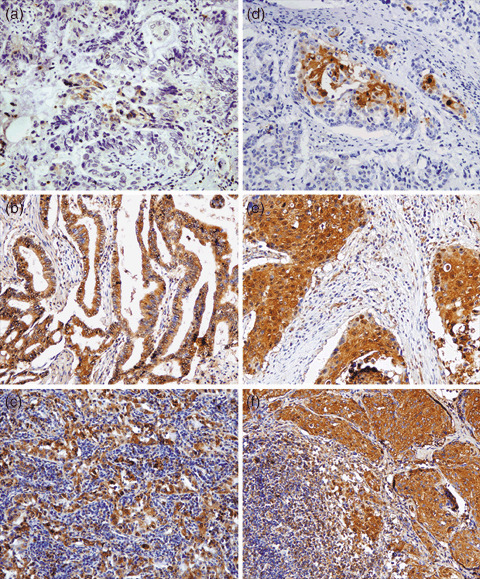
Representative photographs of the immunohistochemical study of S100A11 protein expression in non‐small cell lung cancer specimens (magnification, ×100). (a–c) Adenocarcinoma specimens; (d–f) squamous cell carcinoma specimens. (a) weak staining of lymph node‐negative adenocarcinoma tissues; (b) strong staining of lymph node‐positive adenocarcinoma tissues; (c) strong staining of the matched local positive lymph nodes; (d) weak staining of lymph node‐negative squamous cell carcinoma tissues; (e) strong staining of lymph node‐positive squamous cell carcinoma tissues; and (f) strong staining of the matched local positive lymph nodes.
Table 3.
Relationship between S100A11 expression in tissues and clinicopathologic characteristics of 65 non‐small cell lung cancer patients
| Variable | Different expression of S100A11 | P‐value | |
|---|---|---|---|
| Weak/moderate (–/+/++) (n = 35) | Strong (+++) (n = 30) | ||
| Age, years (mean ± SD) | 58 ± 12 | 55 ± 13 | 0.342 † |
| Sex (no. cases) | |||
| Male | 27 | 26 | 0.359 ‡ |
| Female | 8 | 4 | |
| Histological subtype (no. cases) | |||
| Adenocarcinoma | 16 | 14 | 1.000 ‡ |
| Squamous cell carcinoma | 19 | 16 | |
| Tumor–node–metastasis stage (no. cases) | |||
| I, II | 26 | 10 | 0.001*, ‡ |
| III, IV | 9 | 20 | |
| Tumor status (no. cases) | |||
| T1–2 | 27 | 18 | 0.180 ‡ |
| T3–4 | 8 | 12 | |
| Lymph node status (no. cases) | |||
| N0 | 20 | 7 | 0.011*, ‡ |
| N1–3 | 15 | 23 | |
| Differentiation status (no. cases) | |||
| Poorly differentiated | 15 | 7 | 0.246 § |
| Moderately differentiated | 12 | 13 | |
| Well differentiated | 8 | 10 | |
P‐value <0.05;
Student's t‐test;
‡ Fisher's exact test;
Pearson χ2‐test.
Discussion
Our limited knowledge of tumor metastasis and the lack of markers for early diagnosis and metastasis prevention have become the main obstacles to the amelioration of lung cancer treatment. The complexity of metastasis course makes it necessary to take many factors into consideration to clarify the mechanism of metastasis. Comparative proteomics is a promising way to discover more available biomarkers due to its feasibility of analyzing thousands of proteins and finding many altered proteins simultaneously. Therefore, we used comparative proteomic strategies to detect differentially expressed proteins in non‐metastatic CL1‐0 and highly metastatic CL1‐5 cell line so as to provide some information for elucidation of the mechanisms underlying NSCLC metastasis. A total of 33 proteins with altered expression were identified, among which 16 were upregulated and 17 were downregulated in CL1‐5. According to their biological functions, these candidate proteins mainly comprised: cytoskeleton proteins, metabolic enzymes, proteins related to signal transduction and proteins involved in protein synthesis and folding. Two identified proteins were observed in two different spots with pI shifts and slight M r alterations: PGP9.5 (D10 in Fig. 1) and HSP27 (D12 in Fig. 1). The multiple protein variants may be partly the consequence of different splicing, processing and post‐translational modifications such as phosphorylation. In addition, some of the excised spots failed to be identified during the course the experiments. The major reasons could be low abundance, post‐translational modifications or the absence of an entry for that protein in the database at the time of searching.
The validation results of real‐time PCR showed that six out of the eight candidate genes had the same mRNA alteration trends as in the two‐dimensional gel analysis. LASP1 and GDIR seemed to show no notable changes at the mRNA level. Thus we concluded that LASP1 and GDIR possessed discordant expression between protein and mRNA after we confirmed that the two identified protein spots (D9 and U9) could reflect the total amount of individual protein based on the following facts: (1) no other protein variants of LASP1 and GDIR were identified among the many other spots around the two spots (D9 and U9) in the two‐dimensional gels; and (2) previous reports suggested that proteins containing multiple variants on two‐dimensional gels are mainly high‐abundance enzymes and structural proteins,( 15 ) whereas LASP1 and GDIR belong to the low‐abundance regulatory proteins. This result suggested that the correlation between gene and protein expression may not be consistent sometimes due to the regulation of post‐transcriptional mechanisms. Discordant expression between protein and mRNA has been reported previously in lung adenocarcinomas( 16 ) and mammalian cells.( 17 ) The poor correlation between mRNA and protein expression levels reminds us to pay more attention to the alteration of proteins that execute biological functions directly. Besides, in the S100A11 ascending expression results, CL1‐3 seemed to be an exception, which was in agreement with the invasion activity investigation result of these cell lines by Chu et al.( 7 ) In addition, CL1‐1 presented a similar S100A11 expression level to CL1‐0, much lower than other cells. It may be because CL1‐1 came from the first‐round selection and had many very similar characteristics, such as morphology, to the parental CL1‐0 cell line.
It is notable that several of these differentially expressed proteins are acknowledged metastasis‐related molecules, such as nm23‐H2 and RKIP. To date, nm23 has been documented to play a metastasis‐inhibitory role in a variety of tumor types such as melanoma,( 18 ) breast cancer( 19 ) and hepatocellular carcinoma,( 20 ) and has become a generally accepted metastasis‐suppressor gene. In the present study, nm23‐H2, a homolog of nm23, was found to be significantly decreased in the highly metastatic CL1‐5 cell line compared with the non‐metastatic CL1‐0 cell line. Another important protein, RKIP, has been regarded as a metastasis suppressor for its ability to suppress invasion and metastasis in prostate cancer.( 21 ) Our results also revealed RKIP to be remarkably downregulated in the highly metastatic cell line, which was in line with previous reports. These accordant facts indicate that the metastatic model used here is very reliable, and proteomic technologies can provide accurate information regarding the complex process of tumor metastasis.
After confirmation of altered expression at the mRNA and protein levels we focused on the S100A11 protein, which was remarkably upregulated at both levels and gradually increased in the series of cells with increasing metastatic potential. S100A11 (also named S100C or calgizzarin) belongs to the S100 protein family. S100 members are involved in the Ca2+ signaling network and regulate numerous intracellular activities including enzyme activities, the dynamics of cytoskeletal constituents, Ca2+ homeostasis, cell growth and motility, cell cycle progression and cell differentiation.( 22 ) The expression of many S100 family members, including S100A2, S100A4, S100A8, S100A7 and S100A9, have been reported to be related to cancer carcinogenesis, invasion, metastasis and recurrence in various cancers.( 23 , 24 , 25 , 26 ) Noticeably, S100A11 was implicated in the process of prostate cancer development and progression,( 27 ) and the low expression of S100A11 was implied to be associated with poor survival in patients with bladder cancer.( 28 ) However, no study touched on the function of S100A11 protein in lung cancer, especially in relation to S100A11 expression and lung cancer metastasis. Thus, we consulted immunohistochemistry to explore S100A11 expression in the tumor tissues, and the staining results showed that S100A11 protein expression levels were significantly associated with clinical TNM stage and the status of lymph nodes. We also detected positive staining of the matched local positive lymph nodes, with half showing stronger staining than their corresponding primary tumor specimens. This may be due to the fact that the invasive tumor cells in the lymph nodes were more homogeneous and more metastatic than those in the primary tumors. Maybe the variation in degree of invasiveness in various lymph nodes and the randomness of sampling can explain why only half of the lymph nodes analyzed here presented stronger staining. Mori et al. found that S100A11 gene expression was associated with the development of lymph node metastases of gastric cancer by cDNA microarray analysis,( 29 ) which is in agreement with our results. Our observations are further supported by the work of Song et al. who found that S100A11 was overexpressed in metastatic hepatocellular carcinoma tissues compared with non‐metastatic ones using proteomic technologies.( 3 ) Interestingly, Sakaguchi et al. reported that S100A11 was downregulated during the course of normal cell immortalization, which is regarded as the first step in carcinogenesis, and acted as the key mediator of growth inhibition for human fibroblasts and epidermal keratinocytes.( 11 , 30 , 31 ) These observations may seem to conflict with our result that S100A11 can facilitate the metastasis process, and highlight the complicated mechanisms of S100A11 in metastasis. The courses of carcinogenesis and metastasis are very complex and are under the regulation of a variety of signaling pathways. The same protein is likely to exert different effects in different pathways controlling the different stages of cancer. For example, the well‐characterized transforming growth factor β displays a multifunctional mode of action that provides tumor‐suppressive effects mainly via growth inhibition at early stages of carcinogenesis, whereas it promotes tumor progression and metastasis at later stages.( 32 ) Thus, the functions of S100A11 could be stage specific by acting in different regulatory pathways and might participate in certain steps of the metastasis process potentially by making some cancer cells more invasive and facilitating their movement into the lymph circulation. Certainly, additional research using a larger number of tumor specimens is needed to confirm our findings more assuredly and we will make greater efforts to elucidate the precise molecular mechanisms of how S100A11 acts on the metastasis process in future work.
Noticeably, among the differentially expressed proteins of our data, seven proteins including CK‐8, CK‐18, vimentin, calponin‐2, tubulin‐specific chaperone A, LASP1 and stathmin were involved in the cytoskeleton and its associated proteins. The cytoskeletal system is a gigantic filamentous network extending from the plasma membrane to the nuclear envelope, and even to the interior of the nucleus. It is involved in virtually all cellular processes including maintenance of cell shape, cell movement, cell replication, cell differentiation, apoptosis and cell communication and signal transduction. Abnormalities and alterations in cytoskeletal proteins are often the underlying reasons for many diseases such as cancer. Based on previous reports, several of the above cytoskeletal proteins have been demonstrated to be closely related with carcinogenesis and metastasis. First, upregulation of CK‐8 and CK‐18 in the metastatic NSCLC cells in our study is consistent with the results of Chu et al. who established the metastatic model used here.( 7 ) CK‐18 was also reported to be a predictive marker of the appearance of lymph node metastases in esophageal squamous cell cancer,( 33 ) and overexpressed in metastatic hepatocellular tissues.( 3 ) In addition, the clear association between vimentin overexpression and tumor metastasis has been indicated in various tumors including melanoma,( 34 ) breast cancer( 35 ) and cervical carcinoma.( 36 ) Overexpression of stathmin, a microtubule‐destabilizing protein, has been reported to correlate with vascular invasion and intrahepatic metastasis in hepatocellular carcinoma,( 37 ) and with the metastatic phenotype of human sarcomas in vivo.( 38 ) All of the previous results mentioned above are in agreement with our observations in NSCLC, suggesting that these cytoskeleton proteins may serve as important metastatic factors by regulating some steps in tumor invasion and metastasis, such as promoting cell motility and changing cell shape. Moreover, to the best of our knowledge, calponin‐2, tubulin‐specific chaperone A and LASP‐1 are demonstrated to be associated with the metastasis process for the first time in the present study.
Interestingly, two identified proteins, PGP9.5 (UCHL1) and HSP27, have frequently been implicated in carcinogenesis and metastasis, with some conflicting results in previous reports. The expression of PGP9.5, belonging to the ubiquitin carboxyl‐terminal hydrolase family, has been demonstrated to be closely associated with advanced stages of lung cancer,( 39 ) and the progression and invasiveness of colorectal cancer.( 40 ) However, in esophageal squamous cell carcinoma, PGP9.5 promoter methylation, resulting in the absence or down‐regulation of PGP9.5, was found to be correlated strongly with lymph node metastases and poor prognosis.( 41 ) HSP27, a member of the small heat shock protein family, acts as a molecular chaperone and has a variety of biological functions. High levels of HSP27 were reported to be associated with metastatic disease in breast carcinoma,( 42 ) ovarian carcinoma( 43 ) and hepatocellular carcinoma.( 3 ) In contrast, in malignant fibrous histiocytoma( 44 ) and neuroblastoma,( 45 ) its high expression was found to be associated with metastasis‐free survival and a good prognosis. In the present study, PGP9.5 and HSP27 were detected to be downregulated in the metastatic cell line with significant differences at both the protein and mRNA levels. Our observations suggest that they may play a metastasis‐suppressor role in NSCLC. The contradictory opinions among all of the previous reports and our results may be mainly due to the following reasons: (1) the expression patterns of such proteins may be tumor‐type specific, and their conflicting biological behavior in different cancers may reflect organ‐related differences; (2) the metastatic models we used were cell lines and the expression of some proteins may differ from those in vivo after long‐term culture in vitro. Thus in future work, adequate tissue specimens will be analyzed to check the expression of these candidate proteins and further validate their association with metastasis.
Furthermore, due to the easier operation and non‐invasive detection of serum markers for tumor monitoring, screening and determination of secreted proteins were carried out widely to promote the seeking of serum tumor markers with high sensitivity and specificity. According to previous reports, many of the identified differential proteins in our present work proved to be secreted proteins and were detectable in human plasma or serum, for example, PGP9.5, galectin‐1 and α‐enolase.( 46 , 47 , 48 ) The PGP9.5 antigen and its autoantibodies were reported to be detectable in the serum of patients with lung cancer, which suggested that PGP9.5 may have clinical utility as a biomarker for tumor screening and diagnosis.( 46 ) Further investigations about whether identified proteins could secrete into serum and their serum levels will be done in our next report by exploring the secreted proteomes of the serial metastatic cell lines and testing the serum concentrations by enzyme‐linked immunosorbent assay. We expect to identify some useful serum markers associated with tumor stages and metastasis status for clinical early diagnosis and therapy of NSCLC.
In conclusion, we applied comparative proteomic technologies to screen the differential expression patterns of proteins between the non‐metastatic NSCLC cell line CL1‐0 and the highly metastatic NSCLC cell line CL1‐5. Thirty‐three significantly altered proteins were identified and the identity of some proteins was further confirmed by real‐time quantitative PCR and western blotting. Using immunohistochemical analysis, we found that the upregulation of S100A11 was significantly associated with higher TNM stage and positive lymph node status of NSCLC tissues. This is the first time that the association between S100A11 and NSCLC metastasis has been revealed. The results strongly imply that S100A11 might be an important regulatory molecule in promoting invasion and metastasis of NSCLC. Moreover, our proteomic profiling of metastasis‐associated proteins might provide some useful information for the elucidation of molecular mechanisms of tumor metastasis and the development of clinically available biomarkers for metastasis prevention.
Acknowledgments
This research was supported in part by grants from the Major State Basic Research Program of China (#2006CB910100), Natural Science Foundation of Beijing (#7051002) and Science Technology Committee of Beijing (#Y0204002040111). We are grateful to Professor Yi‐Ching Wang and Kang Fang (Department of Life Sciences, Taiwan Normal University) for kindly providing the serial cell lines (established by Yi‐Wen Chu et al.) We thank Dr Suozhu Sun (Department of Pathology, General Hospital of the Second Artillery, PLA) for providing the specimens and evaluating the slides.
References
- 1. Jemal A, Murray T, Ward E et al . Cancer statistics, 2005. CA Cancer J Clin 2005; 55: 10–30. [DOI] [PubMed] [Google Scholar]
- 2. American Cancer Society . Cancer Facts and Figures 2006. 2006. [Cited 16 November 2006.] Available from URL: http://www.cancer.org/docroot/STT/stt_0_2006.asp?sitearea=STT&level=1
- 3. Song HY, Liu YK, Feng JT et al . Proteomic analysis on metastasis‐associated proteins of human hepatocellular carcinoma tissues. Cancer Res Clin Oncol 2006; 132: 92–8. [DOI] [PMC free article] [PubMed] [Google Scholar]
- 4. Li DQ, Wang L, Fei F et al . Identification of breast cancer metastasis‐associated proteins in an isogenic tumor metastasis model using two‐dimensional gel electrophoresis and liquid chromatography‐ion trap‐mass spectrometry. Proteomics 2006; 6: 3352–68. [DOI] [PubMed] [Google Scholar]
- 5. Wu W, Tang X, Hu W, Lotan R, Hong WK, Mao L. Identification and validation of metastasis‐associated proteins in head and neck cancer cell lines by two‐dimensional electrophoresis and mass spectrometry. Clin Exp Metastasis 2002; 19: 319–26. [DOI] [PubMed] [Google Scholar]
- 6. Jiang DF, Ying WT, Lu YL et al . Identification of metastasis‐associated proteins by proteomic analysis and functional exploration of interleukin‐18 in metastasis. Proteomics 2003; 3: 724–37. [DOI] [PubMed] [Google Scholar]
- 7. Chu YW, Yang PC, Yang SC et al . Selection of invasive and metastatic subpopulations from a human lung adenocarcinoma cell line. Am J Respir Cell Mol Biol 1997; 17: 353–60. [DOI] [PubMed] [Google Scholar]
- 8. Ho CC, Huang PH, Huang HY, Chen YH, Yang PC, Hsu SM. Up‐regulated caveolin‐1 accentuates the metastasis capability of lung adenocarcinoma by inducing filopodia formation. Am J Pathol 2002; 161: 1647–56. [DOI] [PMC free article] [PubMed] [Google Scholar]
- 9. Shih JY, Yang SC, Hong TM et al . Collapsin response mediator protein‐1 and the invasion and metastasis of cancer cells. J Natl Cancer Inst 2001; 93: 1392–400. [DOI] [PubMed] [Google Scholar]
- 10. Chang CC, Shih JY, Jeng YM et al . Connective tissue growth factor and its role in lung adenocarcinoma invasion and metastasis. J Natl Cancer Inst 2004; 96: 364–75. [DOI] [PubMed] [Google Scholar]
- 11. Sakaguchi M, Miyazaki M, Takaishi M et al . S100C/A11 is a key mediator of Ca2+‐induced growth inhibition of human epidermal keratinocytes. J Cell Biol 2003; 163: 825–35. [DOI] [PMC free article] [PubMed] [Google Scholar]
- 12. Kanamori T, Takakura K, Mandai M et al . Increased expression of calcium‐binding protein S100 in human uterine smooth muscle tumours. Mol Hum Reprod 2004; 10: 735–42. [DOI] [PubMed] [Google Scholar]
- 13. Rety S, Osterloh D, Arie JP et al . Structural basis of the Ca2+‐dependent association between S100C (S100A11) and its target, the N‐terminal part of annexin I. Structure 2000; 8: 175–84. [DOI] [PubMed] [Google Scholar]
- 14. Pfaffl MW. A new mathematical model for relative quantification in real‐time RT‐PCR. Nucl Acids Res 2001; 29: 2002–7. [DOI] [PMC free article] [PubMed] [Google Scholar]
- 15. Fountoulakis M, Tsangaris G, Oh J et al . Protein profile of the HeLa cell line. J Chromatogr A 2004; 1038: 247–65. [DOI] [PubMed] [Google Scholar]
- 16. Chen G, Gharib TG, Huang CC et al . Discordant protein and mRNA expression in lung adenocarcinomas. Mol Cell Proteomics 2002; 1: 304–13. [DOI] [PubMed] [Google Scholar]
- 17. Tian Q, Stepaniants SB, Mao M et al . Integrated genomic and proteomic analyses of gene expression in mammalian cells. Mol Cell Proteomics 2004; 3: 960–9. [DOI] [PubMed] [Google Scholar]
- 18. Steeg PS, Bevilacqua G, Kopper L et al . Evidence for a novel gene associated with low tumor metastatic potential. J Natl Cancer Inst 1988; 80: 200–4. [DOI] [PubMed] [Google Scholar]
- 19. Leone A, Flatow U, VanHoutte K, Steeg PS. Transfection of human nm23‐H1 into the human MDA‐MB‐435 breast carcinoma cell line: effects on tumor metastatic potential, colonization and enzymatic activity. Oncogene 1993; 8: 2325–33. [PubMed] [Google Scholar]
- 20. Nakayama T, Ohtsuru A, Nakao K et al . Expression in human hepatocellular carcinoma of nucleoside diphosphate kinase, a homologue of the nm23 gene product. J Natl Cancer Inst 1992; 84: 1349–54. [DOI] [PubMed] [Google Scholar]
- 21. Fu Z, Smith PC, Zhang LZ et al . Effects of Raf kinase inhibitor protein expression on suppression of prostate cancer metastasis. J Natl Cancer Inst 2003; 95: 878–99. [DOI] [PubMed] [Google Scholar]
- 22. Heizmann CW, Fritz G, Schafer BW. S100 proteins: structure, functions and pathology. Front Biosci 2002; 7: 1356–68. [DOI] [PubMed] [Google Scholar]
- 23. Tsai ST, Jin YT, Tsai WC et al . S100A2, a potential marker for early recurrence in early‐stage oral cancer. Oral Oncol 2005; 41: 349–57. [DOI] [PubMed] [Google Scholar]
- 24. Saleem M, Adhami VM, Ahmad N, Gupta S, Mukhtar H. Prognostic significance of metastasis‐associated protein S100A4 (Mts1) in prostate cancer progression and chemoprevention regimens in an autochthonous mouse model. Clin Cancer Res 2005; 11: 147–53. [PubMed] [Google Scholar]
- 25. Emberley ED, Niu YL, Njue C, Kliewer EV, Murphy LC, Watson PH. Psoriasin (S100A7) expression is associated with poor outcome in estrogen receptor‐negative invasive breast cancer. Clin Cancer Res 2003; 9: 2627–31. [PubMed] [Google Scholar]
- 26. Hermani A, Hess J, Servi BD et al . Calcium‐binding proteins S100A8 and S100A9 as novel diagnostic markers in human prostate cancer. Clin Cancer Res 2005; 11: 5146–52. [DOI] [PubMed] [Google Scholar]
- 27. Rehman I, Azzouzi AR, Cross SS et al . Dysregulated expression of S100A11 (calgizzarin) in prostate cancer and precursor lesions. Hum Pathol 2004; 35: 1385–91. [DOI] [PubMed] [Google Scholar]
- 28. Memon AA, Sorensen BS, Meldgaard P, Fokdal L, Thykjaer T, Nexo E. Down‐regulation of S100C is associated with bladder cancer progression and poor survival. Clin Cancer Res 2005; 11: 606–11. [PubMed] [Google Scholar]
- 29. Mori M, Shimada H, Gunji Y et al . S100A11 gene identified by in‐house cDNA microarray as an accurate predictor of lymph node metastases of gastric cancer. Oncol Rep 2004; 11: 1287–93. [PubMed] [Google Scholar]
- 30. Sakaguchi M, Miyazaki M, Inoue Y et al . Relationship between contact inhibition and intranuclear S100C of normal human fibroblasts. J Cell Biol 2000; 149: 1193–206. [DOI] [PMC free article] [PubMed] [Google Scholar]
- 31. Sakaguchi M, Miyazaki M, Sonegawa H et al . PKCα mediates TGFβ‐induced growth inhibition of human keratinocytes via phosphorylation of S100C/A11. J Cell Biol 2004; 164: 979–84. [DOI] [PMC free article] [PubMed] [Google Scholar]
- 32. Roberts AB, Wakefield LM. The two faces of transforming growth factor β in carcinogenesis. Proc Natl Acad Sci USA 2003; 100: 8621–3. [DOI] [PMC free article] [PubMed] [Google Scholar]
- 33. Cintorino M, Tripod SA, Santopietro R et al . Cytokeratin expression patterns as an indicator of tumour progression in oesophageal squamous cell carcinoma. Anticancer Res 2001; 21: 4195–201. [PubMed] [Google Scholar]
- 34. Ben‐Ze’ev A, Raz A. Relationship between the organization and synthesis of vimentin and the metastatic capability of B16 melanoma cells. Cancer Res 1985; 45: 2632–41. [PubMed] [Google Scholar]
- 35. Domagala W, Striker G, Szadowska A, Dukowicz A, Harezga B, Osborn M. p53 protein and vimentin in invasive ductal NOS breast carcinoma –relationship with survival and sites of metastases. Eur J Cancer 1994; 30A: 1527–34. [DOI] [PubMed] [Google Scholar]
- 36. Gilles C, Polette M, Piette J et al . Vimentin expression in cervical carcinomas: association with invasive and migratory potential. J Pathol 1996; 180: 175–80. [DOI] [PubMed] [Google Scholar]
- 37. Yuan RH, Jeng YM, Chen HL et al . Stathmin overexpression cooperates with p53 mutation and osteopontin overexpression, and is associated with tumour progression, early recurrence, and poor prognosis in hepatocellular carcinoma. J Pathol 2006; 209: 549–58. [DOI] [PubMed] [Google Scholar]
- 38. Baldassarre G, Belletti B, Nicoloso MS et al . p27 (Kip1)–stathmin interaction influences sarcoma cell migration and invasion. Cancer Cell 2005; 7: 51–63. [DOI] [PubMed] [Google Scholar]
- 39. Hibi K, Westra WH, Borges M, Goodman S, Sidransky D, Jen J. PGP9.5 as a candidate tumor marker for non‐small‐cell lung cancer. Am J Pathol 1999; 155: 711–15. [DOI] [PMC free article] [PubMed] [Google Scholar]
- 40. Yamazaki T, Hibi K, Takase T et al . PGP9.5 as a marker for invasive colorectal cancer. Clin Cancer Res 2002; 8: 192–5. [PubMed] [Google Scholar]
- 41. Mandelker DL, Yamashita K, Tokumaru Y et al . PGP9.5 promoter methylation is an independent prognostic factor for esophageal squamous cell carcinoma. Cancer Res 2005; 65: 4963–8. [DOI] [PubMed] [Google Scholar]
- 42. Thor A, Benz C, Moore D et al . Stress response protein (srp‐27) determination in primary human breast carcinomas: clinical, histologic, and prognostic correlations. J Natl Cancer Inst 1991; 83: 170–8. [DOI] [PubMed] [Google Scholar]
- 43. Langdon SP, Rabiasz GJ, Hirst GL et al . Expression of the heat shock protein HSP27 in human ovarian cancer. Clin Cancer Res 1995; 1: 1603–9. [PubMed] [Google Scholar]
- 44. Tetu B, Lacasse B, Bouchard HL, Lagace R, Huot J, Landry J. Prognostic influence of HSP‐27 expression in malignant fibrous histiocytoma: a clinicopathological and immunohistochemical study. Cancer Res 1992; 52: 2325–8. [PubMed] [Google Scholar]
- 45. Ungar DR, Hailat N, Strahler JR et al . Hsp27 expression in neuroblastoma: correlation with disease stage. J Natl Cancer Inst 1994; 86: 780–4. [DOI] [PubMed] [Google Scholar]
- 46. Brichory F, Beer D, Naour FL, Giordano T, Hanash S. Proteomics‐based identification of protein gene product 9.5 as a tumor antigen that induces a humoral immune response in lung cancer. Cancer Res 2001; 61: 7908–12. [PubMed] [Google Scholar]
- 47. Hughes RC. Secretion of the galectin family of mammalian carbohydrate‐binding proteins. Biochim Biophys Acta 1999; 1473: 172–85. [DOI] [PubMed] [Google Scholar]
- 48. Gerbitz KD, Summer J, Schumacher I, Arnold H, Kraft A, Mross K. Enolase isoenzymes as tumour markers. J Clin Chem Clin Biochem 1986; 24: 1009–16. [DOI] [PubMed] [Google Scholar]