

Abstract
The hedgehog (Hh) signal pathway has recently been shown to be activated in human malignancies. However, little is known about its role in the development or patient prognosis of epithelial ovarian carcinoma. In the present study, we examined in vivo and in vitro the expression and functional role of Hh signal molecules in epithelial ovarian tumors and normal ovarian surface epithelial (OSE) cells. The expression of Shh, Dhh, Ptch, Smo and Gli1 proteins was not observed in normal OSE, but was increased stepwise in benign, borderline and malignant neoplasms. In addition, immunoreactivity for Shh, Dhh, Ptch, Smo and Gli1 was highly correlated with cell proliferation assessed by Ki‐67. Blocking the Hh signal using either the Hh pathway inhibitor cyclopamine or Gli1 siRNA led to remarkably decreased cell proliferation in ovarian carcinoma cells. Treatment with cyclopamine induced not only G1 arrest but also apoptosis along with the downregulation of cyclin A and cyclin D1, and the upregulation of p21 and p27. Among the Hh signal molecules, Dhh expression was correlated with poor prognosis of ovarian carcinoma patients. These findings suggest that the Hh signal pathway plays an important role in ovarian tumorigenesis as well as in the activation of cell proliferation in ovarian carcinomas. Thus, the Hh signal pathway is a possible molecular target of new treatment strategies for ovarian carcinoma. (Cancer Sci 2007; 98: 68–76)
Epithelial ovarian carcinoma, which comprises the majority of malignant ovarian tumors, is the leading cause of death from gynecologic malignancy in women.( 1 ) The survival of ovarian carcinoma patients has not improved significantly for years, indicating that further understanding of the biology of ovarian carcinoma cells is critical for the development of new treatments against this neoplasm.( 2 ) Several studies have reported that the poor prognosis of ovarian carcinoma is related not only to the unique metastasis but also to the high proliferative activity of carcinoma cells.( 3 , 4 , 5 ) However, the molecular mechanisms of the proliferation of ovarian carcinoma cells are not fully understood. Recent studies suggest that the hedgehog (Hh) signal pathway contributes to cell proliferation and differentiation in several human neoplasms, such as pancreas, prostate and skin carcinomas.( 6 , 7 , 8 )
The Hh gene was first identified in the embryonic development of Drosophila.( 9 ) The Hh signal transduction pathway controls a variety of developmental processes such as proliferation, differentiation and organogenesis.( 10 ) The mammalian Hh family of genes encodes several ligand proteins, including Sonic hedgehog (Shh), Indian hedgehog (Ihh) and Desert hedgehog (Dhh), and their functional properties are highly conserved between organisms and expressed in a tissue‐specific manner. Suppression of the transmembrane protein Smoothened (Smo) by the Hh‐ligand receptor Patched (Ptch), in the absence of ligands, inhibits the cleavage of Gli, which is the intracellular messenger for Hh signaling. When the ligand binds Ptch, Smo suppression is relieved, and then Gli is cleaved and transported to the nucleus, resulting in the transcription of Hh target genes including Ptch and Gli themselves.( 9 , 10 , 11 ) It is known that Gorlin's syndrome, which is associated with abnormal activation of the Hh signal pathway mainly due to Ptch mutation, shows an increased incidence of basal cell carcinoma, medulloblastma and rhabdomyosarcoma.( 8 , 12 )
There are no available data on the expression of Hh signal molecules in human epithelial ovarian neoplasms. Therefore, in the present study we first investigated immunohistochemically the expression of Hh molecules, such as Shh, Ihh, Dhh, Ptch, Smo and Gli1 proteins, in benign, borderline and malignant ovarian tumors and normal ovarian surface epithelium (OSE), and correlated the expression of each with cell proliferative activity assessed by Ki‐67 staining, clinicopathological parameters and patient outcomes. The presence or absence of Ptch mutation was examined in ovarian carcinoma cases. We then examined the expression of Hh signal molecules in ovarian carcinoma cells and normal OSE cells in vitro. Finally, to investigate the role of the Hh signal pathway in ovarian carcinoma cells, we examined the change in cell proliferation and apoptosis under the suppression of Hh signaling, and analyzed its cell cycle‐related mechanisms.
Materials and Methods
Patients and tissue samples. Eighty‐six cases of primary epithelial ovarian tumor and six normal ovaries retaining surface epithelium were examined for immunohistochemistry. Fifty‐seven consecutive patients with ovarian carcinoma who visited Shinshu University Hospital between 1996 and 2000, and underwent surgery followed by cisplatin‐based chemotherapy were included in the present study. The follow‐up period ranged from 5 to 111 months (median 64 months). Specimens were reviewed to confirm the histopathological diagnosis using the standard criteria.( 13 ) Histologically, 14 of the 86 were benign (six serous and eight mucinous cystadenomas), 15 were borderline‐malignant tumors (seven serous and eight mucinous tumors), and 57 were carcinomas (19 serous, 6 mucinous, 11 endometrioid and 21 clear cell adenocarcinomas). Of the 57 carcinomas, 31 were classified as stage I, 5 as stage II, 19 as stage III and 2 as stage IV according to the International Federation of Gynecology and Obstetrics (FIGO) classification. With regard to the histological grade,( 14 ) 25 were graded as G1, 21 were G2 and 11 were G3. These specimens were fixed in 10% phosphate‐buffered formalin and embedded in paraffin. Serial 3‐µm sections were cut for hematoxylin and eosin staining, and for immunohistochemistry. Each tissue was used with the approval of the Ethics Committee of Shinshu University.
Immunohistochemistry. Immunohistochemical staining was carried out on serial paraffin‐embedded sections with the streptavidin–biotin–peroxidase complex method using a Histofine SAB‐PO kit (Nichirei, Tokyo, Japan). The primary goat polyclonal antibodies used were anti‐Shh (N‐19), ‐Dhh (H‐85), ‐Ihh (H‐88), ‐Ptch (G‐19), ‐Smo (C‐17) and ‐Gli1 (N‐16) (Santa Cruz Biotechnology, Santa Cruz, CA, USA), which were used at a dilution of 1:100. For Ki‐67 staining, mouse monoclonal anti‐Ki‐67 (MIB‐1; DAKO, Glostrup, Denmark) was used at a dilution of 1:50. Sections 3‐µm thick were deparaffinized and boiled in 0.01 M citrate buffer (pH 6.0) for 20 min in a microwave oven. They were treated with 0.3% hydrogen peroxide and incubated with 10% normal rabbit serum to block non‐specific binding. The sections were then incubated with a primary antibody at 4°C overnight. After washing in phosphate‐buffered saline (PBS), they were incubated with biotinylated goat antigoat or antimouse IgG, followed by treatment with peroxidase‐conjugated streptavidin and staining with diaminobenzidine and 0.15% hydrogen peroxidase. Hematoxylin was used for counterstaining.
Immunoreactivity for Hh signal molecules was estimated quantitatively with reference to previous reports.( 6 , 15 ) We used the specimens of breast carcinoma as a positive control. Staining without primary antibody was used as a negative control. Staining scores were calculated by semiquantitative optical analysis, using the multiplying product of the percentage of positive cells from 0 to 100 and the staining intensity from 1 to 3 (1, weak; 2, moderate; and 3, strong), which was then divided by 3, making the score from 0 to 100. The results of immunostaining were classified as negative (–) when the staining score was 0–10, weakly positive (+) when the staining score was 11–50, and strongly positive (++) when the staining score was 51–100. Immunostaining was evaluated by two independent observers (XC and AH) who were unaware of the patients’ diagnosis. Immunoreactivity for Ki‐67 was described as the positivity index (PI), and was evaluated as the percentage of positive cells out of 300 cells in high‐power fields.
Cell lines and culture conditions. The ovarian carcinoma cell lines SKOV3 and OVCAR3 were purchased from the American Type Culture Collection (ATCC) (Rockville, MD, USA). Ovarian carcinoma cell lines A2780 and A2780/CDDP (a cisplatin‐resistant cell line derived from A2780) were kind gifts from Dr Takashi Tsuruo (Cancer Chemotherapy Center, Tokyo, Japan),( 16 ) with the permission of Dr Thomas C. Hamilton (Fox Chase Cancer Institute, Philadelphia, PA, USA). A2780, A2780/CDDP and OVCAR3 were maintained in RPMI‐1640 (Sigma‐Aldrich, St Louis, MO, USA) supplemented with 10% inactivated fetal bovine serum (FBS; Biomeda, Foster City, CA, USA). SKOV3 was cultured in Dulbecco's modified Eagle's medium (Sigma‐Aldrich) with 10% FBS. Incubation was carried out at 37°C under 5% CO2 in air.
Normal OSE cells were obtained from three women who were treated surgically for benign gynecologic disease, after obtaining written consent from each patient. Cell culture was carried out as described previously.( 17 )
Cell proliferation assay. Cell number and viability were assessed using the reagent WST‐1 (Roche, Indianapolis, IN, USA), according to the manufacturer's instructions. Cultured cells were plated at a density of 1 × 10³ cells into 96‐well flat‐bottomed tissue‐culture plates. For the experiment of Hh signal inhibition, the following day the medium was changed to RPMI with 0.5% FBS, according to a previous report.( 18 ) An inhibitor of the Hh signal pathway, cyclopamine( 19 , 20 ) (Toronto Research Chemicals, North York, Canada), or its non‐functional analog tomatidine (Sigma‐Aldrich) dissolved in ethanol was added at a concentration of 5, 10 or 20 µmol/L. Cells were also treated with ethanol alone as control. After 24, 48 and 72 h incubation, WST‐1 reagent was added and incubated for 4 h, and then measured at a wavelength of 450 nm with Multiscan JX (Thermo Labsystems, Vantee, Finland).
RNA interference. Three sets of double‐stranded small interference RNA (siRNA; 21 nucleotides long) for Gli1 and the silencer‐negative siRNA for control were purchased from Ambion (Austin, TX, USA), purified and desalted. The sequences for the Gli1 siRNA used are available on request. siRNA transfections (250 nM) were with Oligofectamine (Invitrogen, Carlsbad, CA, USA), as described by the manufacturer. Cells were collected or reseeded for further investigation 48 h after transfection.
Immunoblotting. Extracts equivalent to 50 µg of total protein were separated by sodium dodecyl sulfate–polyacrylamide gel electrophoresis (8 or 12% acrylamide) and transferred onto nitrocellulose membranes (Hybond‐ECL; Amersham Biosciences, Piscataway, NJ, USA) as described previously.( 21 ) The primary antibodies against Shh, Gli1, Ptch, Smo, cyclin A (H‐423), cyclin D1 (C‐20), cyclin E (H‐145), p21 (H‐164), p27 (C‐19) (Santa Cruz) or β‐actin (Sigma‐Aldrich) were used in Tris‐buffered saline Tween‐20 (TBST) containing 5% non‐fat dry milk. The membranes were then incubated with sheep antigoat or antimouse IgG (Amersham Biosciences) in TBST containing 2% non‐fat dry milk. Bound antibody was detected with an enhanced chemiluminescence detection system (ECL‐Plus; Amersham Biosciences).
Reverse transcription–polymerase chain reaction. RNA was extracted using Trizol (Invitrogen) according to the manufacturer's protocol. One microgram of total RNA was treated with 1 U/10 µL DNaseI (Life Technologies, Gaithersburg, MD, USA). Reverse transcription (RT) was carried out using an RNA polymerase chain reaction (PCR) Kit (Takara Shuzo, Otsu, Japan) as described previously.( 17 ) One microliter of the RT products, containing 50 ng reverse‐transcribed total RNA, was amplified by PuReTaq Ready‐To‐Go PCR Beads (Amersham Biosciences) with 0.2 µM of oligonucleotide primer sets. Primers were synthesized to encompass a specific segment of the cDNA sequence of the Shh (sense, 5′‐cgcacggggacagctcggaagt‐3′ and antisense, 5′‐ctgcgcggccctcgtagtgc‐3′), Smo (sense, 5′‐ttaccttcagctgccacttctacg‐3′ and antisense, 5′‐gccttggcaatcatcttgctcttc3′), Ptch (sense, 5′‐ggtggcacagtcaagaaca‐3′ and antisense, 5′‐accaagagcgagaaatgg‐3′), Gli1 (sense, 5′‐ttcctaccagagtcccaagt‐3′ and antisense, 5′‐ccctatgtgaagccctattt‐3′), cyclin A (sense, 5′‐attagtttacctggacccag‐3′ and antisense, 5′‐cacaaactctgctacttctg‐3′) cyclin E (sense, 5′‐agttctcggctcgctccaggaaga‐3′ and antisense, 5′‐tcttgtgtcgccatataccggtca‐3′), cyclin D1 (sense, 5′‐cggtgtcctacttcaaatgtgtgc‐3′ and antisense, 5′‐gagggcggattggaaatga‐3′), p27 (sense, 5′‐tagagctcgggccgtggct‐3′ and antisense, 5′‐gtccattccatgaagtcagcgatatg‐3′), p21 (sense, 5′‐gtgagcgatggaacttcga‐3′ and antisense, 5′‐aatctgtcatgctggtctgc‐3′) or glyceraldehyde‐3‐phosphate dehydrogenase (sense, 5′‐acgaccactttgtcaagctc‐3′ and antisense, 5′‐ggtctacatggcaactgtga‐3′). The corresponding cDNA fragments were denatured at 94°C for 1 min, annealed at 58–65°C for 1 min, and extended at 72°C for 1 min for 35 cycles.
Real‐time polymerase chain reaction. To confirm the results of RT‐PCR, mRNA expression was also analyzed using real‐time PCR (Roche LightCycler; Roche, Mannheim, Germany) as described previously.( 17 )
Flow cytometry. The cells were incubated in culture dishes in RPMI with 0.5% FBS to allow analysis of the cell cycle. After 48 h incubation, both floating cells and adherent cells were collected and washed with PBS(–) three times. The cells were fixed in 70% ethanol and stored at 4°C for 20 min, and then resuspended in a DNA‐stain solution containing propidium iodide (20 mg/mL; Calbiochem, San Diego, CA, USA) and RNAase (20 mg/mL; Novagen, Darmstadt, Germany). The cells were analyzed with a Fluorescence Activated Cell Sorter (FACScan) flow cytometer in combination with BD lysis II software (488 nm; Becton Dickinson Immunocytometry System, Mountain View, CA, USA). The experiments were repeated three times.
Apoptosis assay. For apoptosis analysis, the collected cells were stained with annexin V–biotin and then incubated with fluorescent streptavidin conjugate, according to the manufacturer's protocol (TACS Annexin V–Biotin Kit; Trevigen, Gaithersburg, MD, USA).
Mutational analysis. For mutational analysis, we selected 17 cases of ovarian carcinoma showing strong expression of Gli1, because the expression of Gli1 is known to be activated as a result of Ptch inactivation in carcinoma cells harboring Ptch mutation.( 22 ) DNA from 16 of the 17 cases of ovarian carcinoma were available from the paraffin‐embedded blocks. Sections of 6‐µm thickness were deparaffinized, rehydrated and dried, then the fields of interest were selected and microdissected under a dissection microscope using a 23‐gauge needle as described previously.( 23 ) DNA samples were amplified with primers for residues 663–694 of Ptch, a putative ‘mutational hot spot’ in nevoid basal cell carcinoma syndrome (NBCCS) and NBCCS‐associated cancers.( 24 ) Primers were designed based on GenBank NM_000264 as sense 5′‐ccatgaaacgcagattacc‐3′ and antisense 5′‐gagtcggagaactgggaga‐3′. Amplified products were purified using QIAquick PCR purification kit (QIAGEN, Tokyo, Japan) and cycle‐sequenced with the DYEnamic ET Terminator Kit (Amersham Biosciences) in both directions. The sequence was analyzed in a capillary automatic sequencer (ABI PRISM 3100 Genetic Analyzer; Applied Biosystems). Sequence data were analyzed using Basic Local Alignment Search Tool (BLAST) software located at the National Center for Biotechnology Information website (http://www.ncbi.nlm.nih.gov).
Statistical analysis. Values represent the mean ± SD. The Fisher's exact test, Kruskal–Wallis test and Mann–Whitney U‐test were used to assess the differences. Spearman's rank correlation was used to determine whether there was a positive or negative correlation. The log‐rank test was used to evaluate significant predictors of survival. The log‐rank test and Cox's univariate analysis were first performed on each of the factors. For multivariate analysis, overall survival was then analyzed by the stepwise regression model using variables that exhibited significance by univariate analysis. Cumulative survival was also analyzed by the Kaplan–Meier method. Differences were considered significant if P < 0.05. These analyses were made using the StatView system (Abacus, Berkeley, CA, USA) and SPSS Version 14 (SPSS, Chicago, IL, USA).
Results
Immunoreactivity for Shh, Dhh, Ptch, Smo and Gli1 is increased in carcinomas compared with benign tumors. Representative profiles of immunostaining for Shh, Dhh, Ihh, Ptch, Smo and Gli1 are shown in Fig. 1A. Normal OSE cells showed negative staining for all of the Hh signal molecules, except one case that exhibited weak staining for Ptch and Gli1 (Fig. 1B). In ovarian tumor cells, immunostaining of Shh, Ihh, Dhh, Ptch and Smo was detected in the cytoplasm. The expression of Ptch was observed along the cell membrane, consistent with Ptch serving as a transmembrane receptor in the Hh signal pathway. Although the Gli1 staining was observed mainly in the cytoplasm, nuclear staining was observed sporadically in ovarian carcinoma cells, suggesting that it was transported into the nuclei for transcription activation.
Figure 1.

(A) Immunohistochemical staining of Shh, Ihh, Dhh, Ptch, Smo and Gli1 proteins in various epithelial ovarian tumors. (a) Ovarian surface epithelium (×400); (b) serous borderline tumor (×200); and (c) serous adenocarcinoma (×100). (B) Immunostaining score of Hedgehog (Hh) pathway molecules in normal ovarian surface epithelial (OSE) and benign, borderline and malignant ovarian tumors. Values represent mean ± SD. *P < 0.05 and **P < 0.01.
The immunostaining scores of Shh, Dhh, Ptch, Smo and Gli1 in carcinomas were significantly increased compared with those in benign tumors (Fig. 1B). The expression levels of Hh signal molecules in borderline tumors were intermediate between those of benign and malignant tumors, but the differences were not significant. Among the carcinomas, there were no differences in Shh, Ihh, Dhh, Ptch, Smo and Gli1 expression according to histological type, grade and FIGO stage (Table 1).
Table 1.
Immunohistochemical expression of Hedgehog (Hh) signal molecules in normal ovarian surface epithelium (OSE) and epithelial ovarian neoplasms
| Tumor | Total | Shh | Ihh | Dhh | Ptch | Smo | Gli1 | Ki‐67 | ||||||||||||
|---|---|---|---|---|---|---|---|---|---|---|---|---|---|---|---|---|---|---|---|---|
| – | + | ++ | – | + | ++ | – | + | ++ | – | + | ++ | – | + | ++ | – | + | ++ | Mean ± SD | ||
| Normal OSE | 6 | 6 (100) | 0 | 0 | 6 (100) | 0 | 0 | 6 (100) | 0 | 0 | 5 (83) | 1 (17) | 0 | 6 (100) | 0 | 0 | 6 (100) | 0 | ||
| Benign cystadenoma | ||||||||||||||||||||
| Total | 14 | 9 (64) | 3 (21) | 2 (14) | 13 (93) | 1 (7) | 0 | 5 (36) | 6 (43) | 3 (21) | 7 (50) | 2 (14) | 5 (36) | 10 (71) | 2 (14) | 2 (14) | 7 (50) | 3 (21) | 4 (29) | 0.10 ± 0.13 |
| Serous | 6 | 3 (50) | 1 (17) | 2 (33) | 5 (83) | 1 (17) | 0 | 1 (17) | 2 (33) | 3 (50) | 3 (50) | 0 | 3 (50) | 3 (50) | 1 (17) | 2 (33) | 2 (33) | 2 (22) | 2 (22) | 0.07 ± 0.1 |
| Mucinous | 8 | 6 (75) | 2 (25) | 0 | 8 (100) | 0 | 0 | 4 (50) | 4 (50) | 0 | 4 (50) | 2 (25) | 2 (25) | 7 (88) | 1 (13) | 0 | 5 (63) | 1 (13) | 2 (25) | 0.13 ± 0.14 |
| Borderline tumor | ||||||||||||||||||||
| Total | 15 | 12 (80) | 0 | 3 (20) | 14 (93) | 1 (7) | 0 | 9 (60) | 4 (27) | 2 (13) | 5 (33) | 5 (33) | 5 (33) | 7 (47) | 6 (40) | 2 (13) | 8 (53) | 4 (27) | 3 (20) | 0.26 ± 0.22 |
| Serous | 7 | 4 (57) | 0 | 6 (86) | 6 (86) | 1 (14) | 0 | 2 (29) | 3 (43) | 2 (29) | 2 (29) | 1 (14) | 4 (57) | 4 (57) | 1 (14) | 2 (29) | 3 (43) | 2 (29) | 2 (29) | 0.29 ± 0.25 |
| Mucinous | 8 | 8 (100) | 0 | 0 | 8 (100) | 0 | 0 | 7 (88) | 1 (13) | 0 | 3 (38) | 4 (50) | 1 (13) | 3 (38) | 5 (63) | 0 | 5 (63) | 2 (25) | 1 (13) | 0.23 ± 0.19 |
| Malignant tumor | 57 | 29 (51) | 12 (21) | 15 (26) | 53 (93) | 2 (4) | 2 (4) | 12 (21) | 26 (46) | 19 (33) | 5 (9) | 18 (32) | 34 (60) | 19 (33) | 23 (40) | 15 (26) | 16 (28) | 24 (42) | 17 (30) | 0.46 ± 0.25 |
| Histological type | ||||||||||||||||||||
| Serous | 19 | 12 (63) | 3 (16) | 4 (21) | 16 (84) | 1 (5) | 2 (11) | 3 (16) | 9 (47) | 7 (37) | 2 (11) | 5 (26) | 12 (63) | 6 (32) | 11 (58) | 2 (11) | 8 (42) | 9 (47) | 2 (11) | 0.57 ± 0.23 |
| Mucinous | 6 | 4 (67) | 1 (17) | 1 (17) | 6 (100) | 0 | 0 | 0 | 4 (67) | 2 (33) | 1 (17) | 3 (50) | 2 (33) | 4 (67) | 1 (17) | 1 (17) | 2 (33) | 3 (50) | 1 (17) | 0.54 ± 0.20 |
| Endometrioid | 11 | 3 (27) | 3 (27) | 5 (11) | 11 (100) | 0 | 0 | 3 (27) | 2 (18) | 6 (55) | 1 (4) | 4 (36) | 6 (55) | 4 (36) | 3 (27) | 4 (36) | 3 (27) | 4 (36) | 4 (36) | 0.42 ± 0.28 |
| Clear cell | 21 | 10 (48) | 5 (24) | 6 (29) | 20 (95) | 1 (5) | 0 | 6 (29) | 11 (52) | 4 (19) | 1 (5) | 6 (29) | 14 (67) | 5 (24) | 8 (38) | 8 (38) | 3 (14) | 8 (38) | 10 (48) | 0.35 ± 0.23 |
| Histological grade | ||||||||||||||||||||
| G1 | 25 | 15 (60) | 2 (8) | 8 (32) | 24 (96) | 1 (4) | 0 | 6 (24) | 15 (60) | 4 (16) | 2 (8) | 9 (36) | 14 (56) | 9 (36) | 9 (36) | 7 (28) | 5 (20) | 11 (44) | 9 (36) | |
| G2 | 21 | 10 (48) | 6 (29) | 5 (24) | 19 (90) | 0 | 2 (10) | 4 (19) | 8 (38) | 9 (43) | 2 (10) | 7 (33) | 12 (57) | 7 (33) | 9 (43) | 5 (24) | 6 (29) | 10 (48) | 5 (24) | |
| G3 | 11 | 5 (46) | 4 (36) | 2 (18) | 10 (91) | 1 (9) | 0 | 2 (18) | 3 (27) | 6 (55) | 1 (9) | 2 (18) | 8 (73) | 3 (27) | 5 (46) | 3 (27) | 5 (46) | 3 (27) | 3 (27) | |
| FIGO stage | ||||||||||||||||||||
| I | 31 | 17 (55) | 5 (16) | 9 (29) | 30 (97) | 1 (3) | 0 | 9 (29) | 13 (42) | 9 (29) | 3 (10) | 12 (39) | 16 (52) | 11 (36) | 8 (26) | 12 (39) | 7 (23) | 10 (32) | 14 (45) | |
| II | 5 | 4 (80) | 1 (20) | 0 | 3 (60) | 1 (20) | 1 (20) | 0 | 2 (40) | 3 (60) | 0 | 2 (40) | 3 (60) | 0 | 5 (100) | 0 | 1 (20) | 3 (60) | 1 (20) | |
| III | 19 | 6 (32) | 6 (32) | 7 (37) | 18 (95) | 0 | 1 (5) | 3 (16) | 9 (47) | 7 (37) | 1 (5) | 3 (16) | 15 (79) | 8 (42) | 9 (47) | 2 (11) | 7 (37) | 11 (58) | 1 (5) | |
| IV | 2 | 2 (100) | 0 | 0 | 2 (100) | 0 | 0 | 0 | 2 (100) | 0 | 1 (50) | 1 (50) | 0 | 0 | 1 (50) | 1 (50) | 1 (50) | 0 | 1 (50) | |
The intensity of staining was scored as negative (–) to indicate immunostaining score less than 10, positive (+) to indicate immunostaining score 11–50 and strong positive (++) as more than 50. FIGO, International Federation of Gynecology and Obstetrics.
Expression of Shh, Dhh, Ptch, Smo and Gli1 is correlated with Ki‐67 positivity. Correlations among the expression levels of Shh, Ihh, Dhh, Ptch, Smo, Gli1 and Ki‐67 are shown in Table 2. The expression of Shh showed significantly positive correlations with Dhh (ρ = 0.444, P < 0.001), Ptch (ρ = 0.685, P < 0.001), Gli1 (ρ = 0.453, P < 0.001) and Smo (ρ = 0.460, P < 0.001). A significantly positive correlation with cell proliferation assessed by Ki‐67 PI was observed for Shh (ρ = 0.247, P = 0.011), Dhh (ρ = 0.522, P < 0.001), Ptch (ρ = 0.492, P < 0.001), Smo (ρ = 0.272, P = 0.005) and Gli1 (ρ = 0.191, P = 0.039).
Table 2.
Spearman's correlations between the immunostaining of Hedgehog pathway markers
| Marker | Correlation | Shh | Ihh | Dhh | Ptch | Smo | Gli1 | Positive index |
|---|---|---|---|---|---|---|---|---|
| Shh | Correlation coefficient | 1.000 | ||||||
| P‐value | 0.0 | |||||||
| Ihh | Correlation coefficient | 0.217* | 1.000 | |||||
| P‐value | 0.044 | 0.0 | ||||||
| Dhh | Correlation coefficient | 0.442** | 0.414(**) | 1.000 | ||||
| P‐value | 0.000 | 0.000 | 0.0 | |||||
| Ptch | Correlation coefficient | 0.685** | 0.284** | 0.620** | 1.000 | |||
| P‐value | 0.000 | 0.007 | 0.000 | 0.0 | ||||
| Smo | Correlation coefficient | 0.460** | 0.297** | 0.474** | 0.538** | 1.000 | ||
| P‐value | 0.000 | 0.005 | 0.000 | 0.000 | 0.0 | |||
| Gli1 | Correlation coefficient | 0.453** | 0.230* | 0.493** | 0.571** | 0.633** | 1.000 | |
| P‐value | 0.000 | 0.032 | 0.000 | 0.000 | 0.000 | 0.0 | ||
| Proliferation index | Correlation coefficient | 0.247* | 0.178 | 0.526** | 0.492** | 0.272* | 0.191 | 1.000 |
| P‐value | 0.022 | 0.105 | 0.000 | 0.000 | 0.011 | 0.077 | 0.0 |
Correlation significant at the 0.05 level (2‐tailed).
**Correlation significant at the 0.01 level (2‐tailed).
Expression of Dhh is correlated with poor prognosis of ovarian carcinoma patients. All 15 borderline patients were alive with no evidence of recurrence at the last follow up. Of the 57 patients with carcinoma, 17 died of the disease. Of the remaining 40 patients, 39 were alive and one died of another disease. The prognosis was significantly poorer in patients with advanced FIGO stages (overall survival: stage I + II, 96.0 ± 6.2 months vs stage III + IV, 47.8 ± 9.3 months, P = 0.003). In the 57 patients with ovarian carcinoma, the prognostic significance of Shh, Ihh, Dhh, Ptch, Smo and Gli1 expression was analyzed using the Kaplan–Meier method. The results obtained by log‐rank test showed that the prognosis was poorer in patients with positive immunostaining for Dhh (strongly/weakly positive, 67.1 ± 6.9 months vs negative, 103.9 ± 6.8 months, P = 0.037). There was no prognostic difference according to immunostaining for Shh, Ihh, Ptch, Smo or Gli1. Multivariate analysis for FIGO stage, histological grade and Hh signal molecule expression showed that Dhh expression was not an independent prognostic factor.
Ptch gene mutation is not present in ovarian carcinomas. To investigate whether constitutive activation of the Hh signal pathway in ovarian carcinomas was caused by Ptch gene abnormality, we analyzed Ptch mutation in 16 cases of ovarian carcinoma showing strong expression of Gli1, in which the presence of Ptch mutation was most likely to be present. None of the 16 cases had a mutation in the putative ‘hot spot’ of the Ptch gene.
Hedgehog signal molecules are expressed in ovarian carcinoma cells, but Ptch and Gli1 are not expressed in normal OSE cells in vitro. Reverse transcription–polymerase chain reaction and immunoblot analyses showed that Hh signal molecules were expressed at both the mRNA and protein levels in all four ovarian carcinoma cell lines (A2780, A2780/CDDP, SKOV3, OVCAR3) (Fig. 2). In normal OSE cells, although bands corresponding to Shh, Dhh and Smo were observed, the expression of Ptch and Gli1 was very weak and below the limit of detection. These findings indicate that the Hh signal pathway is activated in ovarian carcinoma cells compared with normal OSE cells.
Figure 2.

(A) mRNA and (B) protein expression of Hedgehog (Hh) signal molecules, such as Shh, Dhh, Ptch, Smo and Gli, were detected by reverse transcription–polymerase chain reaction and immunoblotting, respectively. Ptch and Gli1 were expressed constitutively in all four ovarian cancer cell lines, but not in normal ovarian surface epithelial (OSE) cells. OSE1 and OSE2 cells were obtained from different patients who were treated surgically for benign diseases. Glyceraldehyde‐3‐phosphate dehydrogenase or β‐actin expression served as an internal control.
Treatment with cyclopamine inhibits cell proliferation of ovarian carcinomas cells. In order to examine if the activated Hh pathway is essential for the proliferation of ovarian carcinoma cells, we treated the cells with either cyclopamine, a known inhibitor of the Hh signal pathway, or its non‐functional analog tomatidine. The WST‐1 proliferation assay showed that treatment with cyclopamine but not with tomatidine inhibited the proliferation of all four cell lines in a dose‐dependent fashion (Fig. 3A). To confirm the inhibition of the Hh signal pathway by cyclopamine, we analyzed the change in the protein and mRNA levels of Hh signal molecules in ovarian carcinoma A2780/CDDP cells and found that the Gli1 level was remarkably decreased 48 h after treatment with cyclopamine (Fig. 3B,C).
Figure 3.

(A) Effects of cyclopamine or tomatidine on cell proliferation in four ovarian cancer cell lines as determined by WST‐1 assay. Cells were cultured in 0.5% fetal bovine serum in medium and treated with 0, 5, 10 and 20 µmol/L cyclopamine or 0, 5, 10 and 20 µmol/L tomatidine for 72 h. Results of the WST‐1 assays were normalized to the appropriate control at 0 h. Values represent mean ± SD from three independent experiments. *P < 0.05 and **P < 0.01. 0, treated with ethanol alone; C, cyclopamine; T, tomatidine. (B) Reverse transcription–polymerase chain reaction. (C) Western blotting. The expression of Gli1 at the mRNA and protein levels 48 h after tomatidine or cyclopamine treatment.
Interfering Gli1 expression compromises proliferation of ovarian carcinomas cells. To further confirm the role of the Hh signal pathway in cell proliferation, we used RNA interference. Because Gli zinc‐finger transcription factors have been suggested to be essential for the transmission of Hh signals, we used siRNA for Gli1. We first tested three siRNA oligonucleotides of Gli1 in ovarian carcinoma cells and found that siRNA‐1 was the most effective at suppressing Gli1 expression (Fig. 4A); therefore, we used it for further analysis. The inhibition of Gli1 by RNA interference led to a significant decrease in the proliferative ability of A2780 cells to 66% 48 h after siRNA treatment (Fig. 4B).
Figure 4.
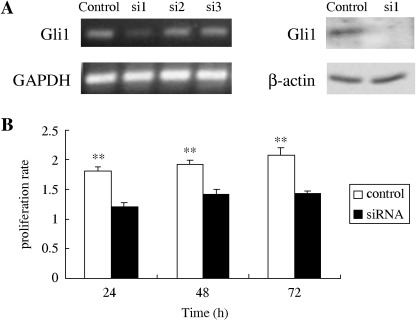
(A) The expression of Gli1 48 h after transfection with Gli1 small interfering RNA (siRNA) analyzed by reverse transcription–polymerase chain reaction and immunoblotting. Three siRNA (si‐1, si‐2, si‐3) were transfected into A2780 cells. For a control, cells were transfected with the silencer‐negative siRNA. Si‐1 was most effective at suppressing Gli1 expression and was therefore used for further analysis. (B) Effects of Gli1 siRNA si‐1 on cell proliferation in A2780 cells. Results of the WST‐1 assay were independently normalized to the appropriate control at 0 h. Cell proliferation was measured using the WST‐1 assay, and the results were independently compared to the appropriate control at 0 h. Values represent mean ± SD from three independent experiments. *P < 0.05 and **P < 0.01.
Suppression of the Hh signal pathway induces G1 arrest and apoptosis in ovarian carcinoma cells. Flow cytometric analysis carried out on the ovarian carcinoma cell lines is shown in Fig. 5A. The treatment of A2780/CDDP cells with cyclopamine induced a significant increase in the proportion of cells in the G1 phase of the cell cycle (54.2 ± 2.5%) along with a significant decrease in both S (26.4 ± 2.1%) and G2/M phases (17.5 ± 1.2%), compared with those without cyclopamine (G1, 40.5 ± 2.7%; S, 32.6 ± 1.5%; G2/M, 24.2 ± 2.0%). Similar results were obtained in the other three cell lines (Fig. 5A). These data indicate that cyclopamine treatment blocks the G1–S transition and induces G1 arrest in ovarian carcinoma cells.
Figure 5.

(A) Cell‐cycle analysis by flow cytometry. Cell‐cycle analysis was conducted in four ovarian cancer cell lines treated or not treated with 20 µmol/L cyclopamine for 48 h. For a control, cells were treated with ethanol alone. Values represent mean ± SD. (B) Apoptosis analysis by annexin V. Data are shown in A2780/CDDP cells treated with or without 20 µmol/L cyclopamine for 48 h. Values represent mean ± SD. *P < 0.05 and **P < 0.01.
Long‐term treatment with cyclopamine along with a low concentration of FBS induced a decrease in the number of viable cells in A2780/CDDP (Fig. 5B). After treatment with cylopamine for 48 h, the proportion of viable cells decreased significantly from 34.4 ± 1.4 to 11.8 ± 3.1%, and the proportion of apoptotic cells increased significantly from 61.4 ± 1.1 to 84.2 ± 3.7%. These results suggest that inhibition of the Hh signal pathway is involved not only in growth suppression via G1 arrest, but also in the increase in apoptosis in ovarian carcinoma cells.
G1 arrest by cyclopamine is associated with the downregulation of cyclin A and cyclin D1 along with the upregulation of p21 and p27. To further analyze the mechanism of G1 arrest by cyclopamine treatment in ovarian carcinoma cells, we examined the expression of cell‐cycle regulators, such as cyclin A, cyclin D1, cyclin E, p21 and p27 in A2780/CDDP cells (Fig. 6A). The intensity of bands for p21 and p27 was increased, whereas that of the cyclin A and cyclin D1 bands was decreased. The band intensity for cyclin E was not changed. In accordance with the changes in protein level, real‐time PCR showed that mRNA levels of cyclin A and cyclin D1 were decreased, and those of p21 and p27 were increased after treatment with cyclopamine for 48 and 72 h (Fig. 6B). The mRNA level of cyclin E did not show a significant change after cyclopamine treatment.
Figure 6.

Analysis of the expression of cell cycle‐related gene products such as cyclin A, cyclin D1, cyclin E, p21 and p27. (A) The 60‐kDa band of cyclin A and 38‐kDa band of cyclin D1 were decreased whereas the 21‐kDa band of cdk inhibitor p21 and 27‐kDa band of p27 were increased by cyclopamine treatment in A2780/CDDP cells. The 50‐kDa band of cyclin E was not changed by 20 µmol/L cyclopamine treatment. (B) The relative expressions of cyclin A, cyclin D1, p21 and p27 mRNA were estimated by real‐time polymerase chain reaction. Values represent mean ± SD. *P < 0.05 and **P < 0.01.
Discussion
The present study demonstrated the expression of Hh signal molecules in various epithelial ovarian tumors of benign, borderline and malignant histology. Although the presence of the Hh signal pathway has been reported in ovarian granulosa cells,( 25 , 26 ) this is the first report on its status in human ovarian neoplasms. The immunohistochemical expression of Shh, Dhh, Ptch, Smo and Gli1 protein in ovarian carcinomas was significantly stronger than that in benign cystadenomas. In borderline malignant tumors, this expression were intermediate between those of benign and malignant tumors. Our study also showed that the Hh signal pathway is not activated in normal OSE, the histogenetic origin of epithelial ovarian tumors. Additionally, the in vitro experiment showed that the Hh signal pathway is activated in ovarian carcinoma cells, but not in OSE cells. This evidence suggests that the Hh signal pathway is activated in a stepwise manner in ovarian carcinogenesis.
As the activation of Hh signaling is caused by mutation of the tumor suppressor Ptch in Gorlin syndrome,( 27 ) we analyzed the Ptch mutation in the putative ‘hot spot’.( 24 ) Sixteen ovarian carcinoma cases with strong expression of Gli1 were examined, as tumor cells with Ptch mutation have been reported to show an increased expression of Gli1 due to Ptch inactivation.( 22 ) There were no cases of Ptch mutation in our series, although further studies using larger samples are needed to confirm the presence or absence of mutational changes in the Hh signal pathway in ovarian carcinomas. Another possible mechanism of aberrant activation is the upregulation of Hh ligands acting via either paracrine or autocrine mechanisms.( 6 ) Our ovarian carcinoma cases showed strong expression of both Hh ligands, such as Shh and Dhh, and Hh target proteins, such as Ptch and Gli1, and this expression was not observed in the surrounding stromal cells. Therefore, the activation of Hh signaling might be due to an autocrine pathway in ovarian carcinomas. Recently, promoter methylation of Shh and Hh‐interacting protein has been reported as another regulatory mechanism of the Hh pathway.( 28 , 29 )
In ovarian carcinomas, the expression of Shh, Dhh, Ptch, Smo and Gli1 was highly correlated with cell proliferation assessed by the Ki‐67 positivity index, suggesting that Hh signal molecules are actually involved in cell proliferation. To investigate further the mechanisms of Hh signaling for cell proliferation, we blocked the Hh signal pathway with cyclopamine, a known Hh pathway inhibitor, or by interfering with the mRNA expression of Gli1 in ovarian carcinoma cell lines. The WST‐1 assay and flow cytomery showed that the proliferation of ovarian carcinoma cells was significantly inhibited by cyclopamine treatment, and that the inhibition of cell proliferation was due to a block at the G1–S transition. The analysis of cell‐cycle regulators also showed the reduced expression of cyclin A and cyclin D1 along with the increased expression of p21 and p27. These findings indicate that suppression of the Hh signal pathway is tightly linked to the expression of cell‐cycle regulators, leading to growth inhibition via G1 arrest. In the present study, the inhibition of cell proliferation by Hh signal suppression was observed in all of the four cell lines with different p53 status, such as A2780 (wild‐type p53), A2780/CDDP (mutant p53), SKOV3 (p53 deleted) and OVCAR3 (mutant p53). This might be consistent with a recent report showing that G1 arrest by inhibition of Hh signaling was not affected by p53 status.( 30 ) In addition, we showed that long‐term treatment with cylopamine induced the apoptosis of ovarian carcinoma cells in vitro. These findings suggest that suppression of the Hh signal pathway may be a promising candidate as a new treatment strategy for ovarian carcinoma.( 31 )
Finally, we examined the prognostic significance of the Hh signal in ovarian carcinoma patients. Among Hh signal ligands, both Shh and Dhh were expressed strongly in ovarian carcinoma cells, but Ihh was not. In addition, the expression of Dhh, but not Shh, was correlated with the poor prognosis of ovarian carcinoma patients in univariate analysis. It has been reported that these Hh ligands have a similar structure and have comparable affinities for the same plasma membrane receptor involved in Hh signaling.( 25 ) Although Shh has been investigated extensively, the role of Dhh in oncogenesis remains undetermined. A study of transgenic mice showed that overexpression of Dhh induced skin tumor formation.( 32 ) The present report is the first report suggesting the importance of the upregulation of Dhh, not Shh, in the prognosis of cancer patients. However, our multivariate analysis showed that Dhh expression was not an independent prognostic factor, and the number of patients in this study was small. Therefore, further studies are needed to clarify whether Dhh expression plays a role in the aggressive behavior of ovarian carcinomas.
Acknowledgments
This work was supported by a Grant‐in‐Aid for Scientific Research (no. 16790947 and no. 18659483) from the Ministry of Education, Science and Culture, Japan.
References
- 1. Murdoch WJ. Ovarian surface epithelium, ovulation and carcinogenesis. Biol Rev Camb Philos Soc 1996; 71: 529–43. [DOI] [PubMed] [Google Scholar]
- 2. Agarwal R, Kaye SB. Ovarian cancer: strategies for overcoming resistance to chemotherapy. Nat Rev Cancer 2003; 3: 502–16. [DOI] [PubMed] [Google Scholar]
- 3. Khalifeh I, Munkarah AR, Schimp V, Morris R, Lawrence WD, Ali‐Fehmi R. The impact of c‐kit and ki‐67 expression on patients prognosis in advanced ovarian serous carcinoma. Int J Gynecol Pathol 2005; 24: 228–34. [DOI] [PubMed] [Google Scholar]
- 4. Eder AM, Sui X, Rosen DG et al. Atypical PKCiota contributes to poor prognosis through loss of apical–basal polarity and cyclin E overexpression in ovarian cancer. Proc Natl Acad Sci USA 2005; 102: 12 519–24. [DOI] [PMC free article] [PubMed] [Google Scholar]
- 5. Hsu CY, Bristow R, Cha MS et al. Characterization of active mitogen‐activated protein kinase in ovarian serous carcinomas. Clin Cancer Res 2004; 10: 6432–6. [DOI] [PubMed] [Google Scholar]
- 6. Thayer SP, Di Magliano MP, Heiser PW et al. Hedgehog is an early and late mediator of pancreatic cancer tumorigenesis. Nature 2003; 425: 851–6. [DOI] [PMC free article] [PubMed] [Google Scholar]
- 7. Karhadkar SS, Bova GS, Abdallah N et al. Hedgehog signalling in prostate regeneration, neoplasia and metastasis. Nature 2004; 431: 707–12. [DOI] [PubMed] [Google Scholar]
- 8. Couve‐Privat S, Le Bret M, Traiffort E et al. Functional analysis of novel sonic hedgehog gene mutations identified in basal cell carcinomas from xeroderma pigmentosum patients. Cancer Res 2004; 64: 3559–65. [DOI] [PubMed] [Google Scholar]
- 9. Nusslein‐Volhard C, Wieschaus E. Mutations affecting segment number and polarity in Drosophila . Nature 1980; 287: 795–801. [DOI] [PubMed] [Google Scholar]
- 10. Beachy PA, Karhadkar SS, Berman DM. Tissue repair and stem cell renewal in carcinogenesis. Nature 2004; 432: 324–31. [DOI] [PubMed] [Google Scholar]
- 11. Watkins DN, Peacock CD. Hedgehog signalling in foregut malignancy. Biochem Pharmacol 2004; 68: 1055–60. [DOI] [PubMed] [Google Scholar]
- 12. Boonen SE, Stahl D, Kreiborg S et al. Delineation of an interstitial 9q22 deletion in basal cell nevus syndrome. Am J Med Genet A 2005; 132: 324–8. [DOI] [PubMed] [Google Scholar]
- 13. Scully REYR, Clement PB. Tumors of the ovary and maldeveloped gonads, fallopian tube, and broad ligament. In: Scully RE, ed. Atlas of Tumor Pathology, 3rd Series. Washington, DC: Armed Forces Institute, 1998: 51–168. [Google Scholar]
- 14. Silverberg SG. Histopathologic grading of ovarian carcinoma: a review and proposal. Int J Gynecol Pathol 2000; 19: 7–15. [DOI] [PubMed] [Google Scholar]
- 15. Kubo M, Nakamura M, Tasaki A et al. Hedgehog signaling pathway is a new therapeutic target for patients with breast cancer. Cancer Res 2004; 64: 6071–4. [DOI] [PubMed] [Google Scholar]
- 16. Tsuruo T, Hamilton TC, Louie KG et al. Collateral susceptibility of adriamycin‐, melphalan‐ and cisplatin‐resistant human ovarian tumor cells to bleomycin. Jpn J Cancer Res 1986; 77: 941–5. [PubMed] [Google Scholar]
- 17. Imai T, Horiuchi A, Wang C et al. Hypoxia attenuates the expression of E‐cadherin via up‐regulation of SNAIL in ovarian carcinoma cells. Am J Pathol 2003; 163: 1437–47. [DOI] [PMC free article] [PubMed] [Google Scholar]
- 18. Berman DM, Karhadkar SS, Hallahan AR et al. Medulloblastoma growth inhibition by hedgehog pathway blockade. Science 2002; 297: 1559–61. [DOI] [PubMed] [Google Scholar]
- 19. Taipale J, Chen JK, Cooper MK et al. Effects of oncogenic mutations in Smoothened and Patched can be reversed by cyclopamine. Nature 2000; 406: 1005–9. [DOI] [PubMed] [Google Scholar]
- 20. Chen JK, Taipale J, Cooper MK, Beachy PA. Inhibition of hedgehog signaling by direct binding of cyclopamine to Smoothened. Genes Dev 2002; 16: 2743–8. [DOI] [PMC free article] [PubMed] [Google Scholar]
- 21. Horiuchi A, Imai T, Wang C et al. Up‐regulation of small GTPases, RhoA and RhoC, is associated with tumor progression in ovarian carcinoma. Laboratory Invest 2003; 83: 861–70. [DOI] [PubMed] [Google Scholar]
- 22. Zedan W, Robinson PA, Markham AF, High AS. Expression of the Sonic Hedgehog receptor ‘PATCHED’ in basal cell carcinomas and odontogenic keratocysts. J Pathol 2001; 194: 473–7. [DOI] [PubMed] [Google Scholar]
- 23. Wang C, Horiuchi A, Imai T et al. Expression of BRCA1 protein in benign, borderline, and malignant epithelial ovarian neoplasms and its relationship to methylation and allelic loss of the BRCA1 gene. J Pathol 2004; 202: 215–23. [DOI] [PubMed] [Google Scholar]
- 24. Barnes EA, Heidtman KJ, Donoghue DJ. Constitutive activation of the shh‐ptc1 pathway by a patched1 mutation identified in BCC. Oncogene 2005; 24: 902–15. [DOI] [PubMed] [Google Scholar]
- 25. Besse F, Busson D, Pret AM. Hedgehog signaling controls Soma–Germen interactions during Drosophila ovarian morphogenesis. Dev Dyn 2005; 234: 422–31. [DOI] [PubMed] [Google Scholar]
- 26. Wijgerde M, Ooms M, Hoogerbrugge JW, Grootegoed JA. Hedgehog signaling in mouse ovary: Indian hedgehog and desert hedgehog from granulosa cells induce target gene expression in developing theca cells. Endocrinology 2005; 146: 3558–66. [DOI] [PubMed] [Google Scholar]
- 27. Gorlin RJ. Nevoid basal cell carcinoma (Gorlin) syndrome. Genet Med 2004; 6: 530–9. [DOI] [PubMed] [Google Scholar]
- 28. Wang LH, Choi YL, Hua XY et al. Increased expression of sonic hedgehog and altered methylation of its promoter region in gastric cancer and its related lesions. Mod Pathol 2006; 19: 675–83. [DOI] [PubMed] [Google Scholar]
- 29. Endo H, Utani A, Shinkai H. Desert hedgehog signalling pathway is involved in the proliferation of a malignant peripheral nerve sheath tumour‐derived cell line from neurofibromatosis type 1. Br J Dermatol 2002; 147: 821–2. [DOI] [PubMed] [Google Scholar]
- 30. Ohta M, Tateishi K, Kanai F et al. p53‐Independent negative regulation of p21/cyclin‐dependent kinase‐interacting protein 1 by the sonic hedgehog‐glioma‐associated oncogene 1 pathway in gastric carcinoma cells. Cancer Res 2005; 65: 10 822–9. [DOI] [PubMed] [Google Scholar]
- 31. Nishimaki H, Kasai K, Kozaki K et al. A role of activated Sonic hedgehog signaling for the cellular proliferation of oral squamous cell carcinoma cell line. Biochem Biophys Res Commun 2004; 314: 313–20. [DOI] [PubMed] [Google Scholar]
- 32. Adolphe C, Narang M, Ellis T, Wicking C, Kaur P, Wainwright B. An in vivo comparative study of sonic, desert and Indian hedgehog reveals that hedgehog pathway activity regulates epidermal stem cell homeostasis. Development 2004; 131: 5009–19. [DOI] [PubMed] [Google Scholar]