

Abstract
It has been proven that “side population (SP)” cells that exclude Hoechst 33342 dye are enriched with cancer stem cells in several tumors. In the present study we aimed to isolate and characterize SP cells from human primary osteosarcoma. Side population cells were detected in osteosarcoma samples. In vitro, SP cells regenerated both SP and non‐SP and the clonogenicity of SP cells was higher than that of non‐SP cells, just like stem cells. In vivo, SP cells exhibited heightened tumorigenicity and only the SP fraction had the capacity to self‐ renew both in vitro and in vivo. Furthermore, SP cells exhibited increased multidrug resistance and the RNA expression of ATP‐binding cassette protein transporters was increased in the SP group. In addition, “stemness” genes Oct‐4 and Nanog were also upregulated in the SP group. However, the expression of other putative stem cell markers (CD44, CD117 and CD133) had no significant difference between SP and non‐SP for each individual marker. These findings suggest that SP cells derived from osteosarcoma are enriched with tumorigenic cells with stem‐like properties and might be an ideal target for clinical therapy. (Cancer Sci 2011; 102: 1774–1781)
Bone sarcomas in general are rare tumors, which are derived from mesenchymal tissues or non‐epithelial tissues originating from the embryonic mesodermal or ectodermal germ layers. Osteosarcoma is the most common highly malignant primary bone sarcoma with a striking tendency to rapidly destroy the surrounding bone and metastasize in childhood and adolescence, accounting for approximately 20% of all bone tumors and <5% of pediatric malignancies overall.( 1 , 2 , 3 ) Most osteosarcoma tumors are of high grade and tend to develop pulmonary metastases. In the past, limb ablation was the only effective therapeutic option available to surgical oncologists in adolescent osteosarcoma patients, whereas 80% of patients with localized osteosarcoma developed metastases after surgical resection alone. Despite improvements in surgery and multi‐agent chemotherapy, in patients with metastatic or recurrent disease the 5‐year survival rate is <20%.( 4 , 5 ) The poor survival rate of these patients is largely due to their lack of responsiveness to chemotherapy. Now, some proposed innovative strategies such as immune‐based therapy, antiangiogenesis agents, tumor‐suppressor and suicide gene therapy are presented. Nevertheless, the tumor relapse rate remains high after these treatments.( 4 , 5 , 6 )
The mechanisms underlying sarcoma drug resistance and recurrence are poorly understood. One possible cause of therapeutic failure is that tumors contain cells with stem‐like properties,( 7 , 8 , 9 , 10 ) such as self‐renewal, multidrug resistance, quick expansion and invasive growth, which ultimately give rise to metastases and recurrences. Recently, new concepts of “cancer stem cell (CSC) or tumor‐initiating cell” have been proposed that tumors contain a small subset of cells with high resistance to chemotherapy and radiation, which both self‐renew and yield phenotypically diverse progeny to maintain tumor tissues, just like normal adult stem cells.( 11 , 12 , 13 ) The CSC hypothesis helps explain the drug resistance and relapse of tumors after current cancer therapies and focuses on new therapies targeting these cells.
Numerous investigations have provided evidence for the existence of CSC, which have already been identified in hematopoietic cancer, brain tumors, breast cancer, melanoma, prostate tumors and gastroenterological cancers.( 14 , 15 , 16 , 17 , 18 , 19 ) However, studies of osteosarcoma CSC have seldom been reported. Inspiringly, it has been demonstrated that bone sarcoma cells have attributes of mesenchymal stem/progenitor cells.( 7 , 8 ) Recent evidence indicates that some osteosarcoma cells have the capacity to form spherical colonies in vitro,( 7 , 9 ) just like stem cells, and osteosarcoma contains a small group of cells that are more tumorigenic in a mouse model than others.( 10 ) Therefore, it is probable that a small quantity of tumor‐initiating cells exist in osteosarcoma.
Dye exclusion is a valuable technique successful in isolating and identifying CSC,( 14 , 20 , 21 , 22 , 23 , 24 ) based on stem cells possessing a high ability to exclude fluorescent DNA‐binding dye, Hoechst 33342. The mechanism regulating the efflux of Hoechst dye is conferred partly through the expression of ATP binding cassette (ABC) protein transporter, ABCG2.( 25 ) A small subset of cells designated as a “side population (SP)” has been isolated using this technique by fluorescence‐activated cell sorting (FACS). The SP cells have been identified in several mammalian malignant tumor tissues and well‐established cancer cell lines.( 10 , 14 , 20 , 21 , 22 , 23 , 24 , 26 , 27 ) The studies reveal that SP cells have stem‐cell‐like characteristics, which suggests SP cells are enriched with CSC.
The present study was undertaken to isolate the SP fraction from human osteosarcoma and identify its stem‐like properties. We reported, for the first time, that SP cells isolated from primary osteosarcoma exhibited repopulating capacity, higher clonogenicity and tumorigenicity, self‐renewal, heightened multidrug resistance and increased mRNA expression of ABC transporters compared with non‐SP cells. Furthermore, “stemness” genes Oct‐4 and Nanog were upregulated in SP cells.
Materials and Methods
Cell isolation and culture. Six human osteosarcoma samples were obtained from six patients without chemotherapy treatment at the Institute of Orthopaedics and Traumatology of PLA of China, Xijing Hospital, The Fourth Military Medical University (FMMU). All study protocol was approved by the Research Ethics Committee of FMMU. The histological subtypes were four high‐grade osteoblastic osteosarcomas, one high‐grade chondroblastic osteosarcoma and one high‐grade fibroblastic osteosarcoma. Cells were routinely isolated from human osteosarcoma surgical specimens (Data S1). Cells were cultured in DMEM complete medium supplemented with 2 mM glutamine, 100 IU/mL penicillin, 100 μg/mL streptomycin and 15% heat‐inactivated fetal bovine serum (FBS; Invitrogen Life Technologies, Grand Island, NY, USA) at 37°C with 95% air, 5% CO2 and 100% humidity.
SP analysis. Cells were analyzed using FACS (Becton Dickinson, Mountain View, CA, USA) when they were in a logarithmic growth phase. The protocol was based on Goodell et al. ( 28 ) Details are given in the Data S1
Repopulation assay. To compare the repopulation ability of osteosarcoma SP cells with non‐SP cells in vitro, freshly sorted SP and non‐SP cells were cultured separately under the same culture conditions. After 2 weeks, both SP and non‐SP cells were restained with Hoechst 33342 dye and reanalyzed using FACS.
Tumorigenesis. To investigate tumorigenesis, SP and non‐SP cells from primary osteosarcomas were subcutaneously transplanted into 8‐week‐old female NOD/SCID mice using a limiting dilution assay. Details are given in the Data S1.
Colony formation assay. To determine the ability of the sorted cells to form colonies in vitro, a colony formation assay of SP, non‐SP and unstained cells (control) were routinely done. Details are given in the Data S1.
Sphere assay. The SP and non‐SP cells were plated at a density of 60 000 cells/well in six‐well, ultra low attachment plates under serum‐free, sphere‐specific conditions described by Gibbs and colleagues.( 7 ) Fresh aliquots of epidermal growth factor (EGF) and basic fibroblast growth factor (bFGF) were added every day. After culture for 7 days, spheres were visible under an inverted phase‐contrast microscope.
Drug sensitivity assay. Chemotherapeutic drug sensitivity was determined by using a MTT assay. Details are given in the Data S1.
Microarray analysis. Total RNA was extracted separately from SP and non‐SP cells (osteosarcoma sample 1 [OS1]) using Trizol reagent (Invitrogen Life Technologies). Microarray analysis was performed according to a standard protocol (CapitalBio Corporation, Beijing, China). cDNA labeled with a fluorescent dye (Cy5 and Cy3) was produced by Eberwine’s linear RNA amplification method and subsequent enzymatic reaction. As a measure of technical replication, one swap‐dye experiment was performed on each of the biological samples. Arrays were scanned with a confocal LuxScan scanner (CapitalBio) and the images were analyzed using LuxScan 3.0 software (CapitalBio).
Real‐time RT‐PCR analysis. Details are given in the Data S1.
Multiple staining analysis. After Hoechst staining, the cells were centrifuged and resuspended at 107 cells/mL in ice cold HBSS containing 2% FCS for antibody staining. Cells were then stained with the following antibodies: anti‐CD44‐APC (BD Biosciences, San Jose, CA, USA) and anti‐CD117‐PE (Pharmingen, Mississauga, ON, Canada) or anti‐CD133‐PE (Miltenyi Biotec, Auburn, CA, USA) for 20 min at 4°C and then washed with HFN (HBSS + 2% FCS + 0.05% NaN3). After antibody staining, cells were analyzed via FACS.
Statistical analysis. Statistical software SPSS 12.0 (SPSS Inc., Chicago, IL, USA) was used in data processing and analyzing. Data were expressed as the mean ± SD. Student’s t‐test was used to compare the differences between groups. A P‐value <0.05 was considered significant.
Results
Human osteosarcoma cells contain SP cells. The presence of SP cells in human osteosarcoma cells was examined by staining the cells with Hoechst 33342 dye to generate a Hoechst blue‐red profile. Based on the variance in Hoechst 33342 labeling, we gated the strongest dye efflux cells as SP cells, which were in the lower left quadrant of the FACS profile, and a main population that were Hoechst 33342 positive as non‐SP cells. As a control, the ABC transporter inhibitor verapamil was added to depress the capacity to exclude Hoechst 33342. The SP cells were detected in all samples except for one osteoblastic osteosarcoma, ranging from 3.7% to 10.2% (Fig. 1A). The profile of cells from one osteosarcoma sample (OS1) is shown as an example, which clearly revealed that SP cells constituted 7.8% of the total OS1 cell population (Fig. 1B), and the presence of SP fraction was abolished in the presence of verapamil (Fig. 1C).
Figure 1.
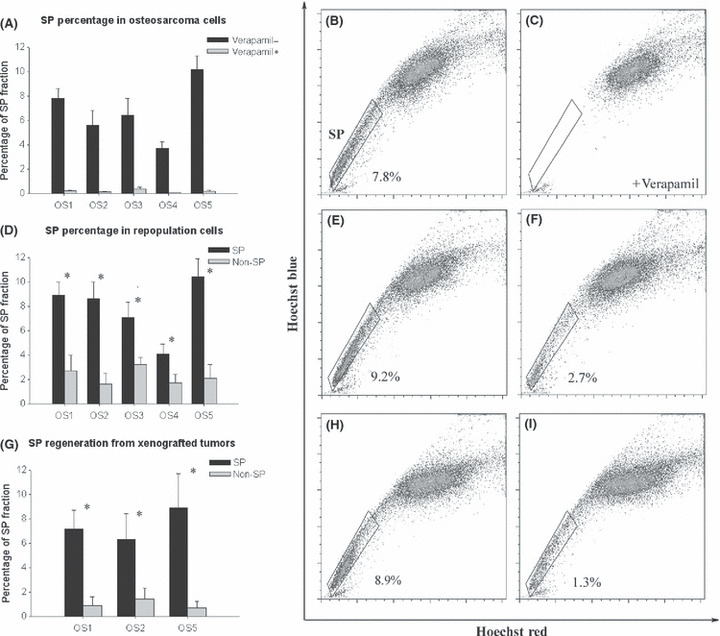
Side population (SP) cells were present in primary osteosarcoma cells, repopulation in vitro and xenografted tumors. (A) Percentages of the SP fraction in human primary osteosarcoma cells derived from five clinical samples with or without verapamil. (B) The SP fraction of primary osteosarcoma sample 1 (OS1) cells were gated and shown to be 7.8% of the whole viable population. (C) The SP fraction disappeared with Hoechst 33342 dye and verapamil co‐treatment. (D) Percentage of SP fraction in SP and non‐SP repopulation in vitro. (E) After 2 weeks culture, the sorted SP group (OS1) contained 9.2% SP cells. (F) Under the same culture conditions, the sorted non‐SP group (OS1) produced mainly non‐SP cells, but with a small fraction of SP cells (2.7%). (G) Percentage of secondary SP fraction in xenografted tumors from SP and non‐SP groups in mice. (H) Xenografted tumor that formed from SP cells (OS1) contained 8.9% SP cells. (I) Xenografted tumor that formed from non‐SP cells (OS1) mainly consisted of non‐SP cells and a small fraction of SP cells (1.3%). *P < 0.05, t‐test, statistical significance.
Side population regenerates both SP and non‐SP. The sorted SP cells and non‐SP cells were cultured separately for 2 weeks before they were restained with Hoechst 33342 dye. The FACS result of SP and non‐SP repopulation revealed that SP produced both SP and non‐SP, while non‐SP produced non‐SP mostly (Fig. 1D). Illustrated by the example of OS1, the cultures derived from sorted SP cells contained 9.2% of SP cells (Fig. 1E), the approximate ratio of SP to total cells compared with the original population before sorting, which indicated that SP cells had the capacity to regenerate both SP and non‐SP populations. Conversely, sorted non‐SP cells yielded mainly non‐SP cells, but with a small fraction of SP cells (Fig. 1F).
Side population cells show higher tumorigenicity in mice and have the ability to self‐renew. To assess the tumorigenicity of SP and non‐SP cells, various numbers of sorted cells from three primary osteosarcomas (except OS3 and OS4, because it was proven that they did not have the capacity to graft with mice in our preliminary investigation) were subcutaneously injected into mice and tumor formation was observed. As shown in Table 1A, although both SP and non‐SP cells had the capacity to regenerate tumors, the ratio of mice with tumors to mice injected with cells in the SP group was significantly higher compared with the non‐SP group. Despite more cells being transplanted to initiate tumor formation, the tumors formed from the non‐SP group were generally smaller than tumors from the SP group. Furthermore, the data showed that the minimum number of non‐SP cells needed to form a tumor was much larger than the minimum number of SP cells. Hence, it was obvious that the SP fraction derived from human osteosarcoma comprised an abundance of tumorigenic cells. The pathological result revealed that xenografted tumors had an identical histological appearance to original tumors. The FACS analysis showed a similar result for sorted cells cultured in vitro (Fig. 1G). The profile of the OS1 group is shown as an example (Fig. 1H,I). In vivo cells from SP tumor regenerated both SP and non‐SP cells similar to the original population, while cells from non‐SP tumor produced mainly non‐SP cells.
Table 1.
Proportion of tumors formed from side population (SP) and non‐SP (NSP) cells in NOD/SCID mice
| (A) Primary transplantation | ||||||||
|---|---|---|---|---|---|---|---|---|
| Cell dose | No. mice with tumors/No. injected mice (mean tumor volume [cm3]) | |||||||
| OS1 | OS2 | OS5 | Total | |||||
| SP | NSP | SP | NSP | SP | NSP | SP | NSP | |
| 5 × 10² | 0/3 | 0/3 | 2/3 (0.021) | 0/3 | 1/3 (0.009) | 0/3 | 3/9 | 0/9 |
| 1 × 10³ | 2/4 (0.027) | – | 3/4 (0.115) | – | 1/3 (0.102) | – | 6/11 | – |
| 5 × 10³ | – | 0/4 | – | 1/3 (0.002) | – | 0/3 | – | 1/10 |
| 1 × 10⁴ | 4/4 (0.462) | 2/4 (0.014) | 3/4 (0.308) | 1/4 (0.051) | 1/4 (0.214) | 1/4 (0.135) | 8/12 | 4/12 |
| 5 × 10⁴ | 3/4 (1.072) | – | 2/4 (0.722) | – | 2/4 (0.451) | – | 7/12 | |
| 1 × 10⁵ | – | 3/4 (0.318) | – | 2/4 (0.165) | – | 1/4 (0.155) | – | 6/12 |
| (B) Secondary transplantation | |||
|---|---|---|---|
| Cell dose | No. mice with tumors/No. injected mice (mean tumor volume [cm3]) | ||
| SP cells from SP tumors | Non‐SP cells from SP tumors | Non‐SP cells from non‐SP tumors | |
| 5 × 10² | 1/7 (0.013) | – | – |
| 1 × 10³ | 4/9 (0.092) | – | – |
| 1 × 10⁴ | 5/7 (0.385) | 3/12 (0.049) | 0/8 |
| 1 × 10⁵ | – | – | 0/7 |
One hallmark of stem cells and cancer stem cells is the ability to self‐renew. To test whether this ability differed in the SP and non‐SP groups, secondary transplantations were performed to measure the capacity of sorted cells from primary xenografted tumors to regenerate tumors. As shown in Table 1B, the secondary sorted SP cells from primary xenografted tumors that formed from the SP group had the capacity to form tumors in secondary mice, whereas non‐SP cells from non‐SP tumors failed to regenerate tumors. The pathological result revealed that both primary and secondary xenografted tumors had identically histological appearances to original tumors (Fig. 2). Therefore, it was clear that only SP cells had the capacity to self‐renew in vivo.
Figure 2.
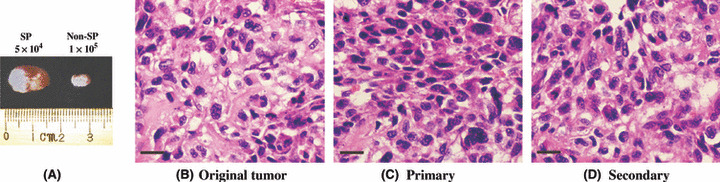
Side population (SP) cells were more tumorigenic. (A) Xenografted tumor masses. (B) Histopathological features of the original tumor. (C) Histopathological features of SP primary xenografted tumor. (D) Histopathological features of SP secondary xenografted tumor. (C) and (D) had almost identical appearances to (B). A representative osteosarcoma, OS1 (original magnification, ×400).
Side population cells are more clonogenic. The clonogenicity of SP and non‐SP cells was examined. The unstained cells were used as a control to determine whether the toxicity of Hoechst dye had an effect on stained cells. As shown in Figure 3(A,B), the clonogenicity of SP cells was higher than that of non‐SP cells and there was no difference between non‐SP cells and unstained cells.
Figure 3.
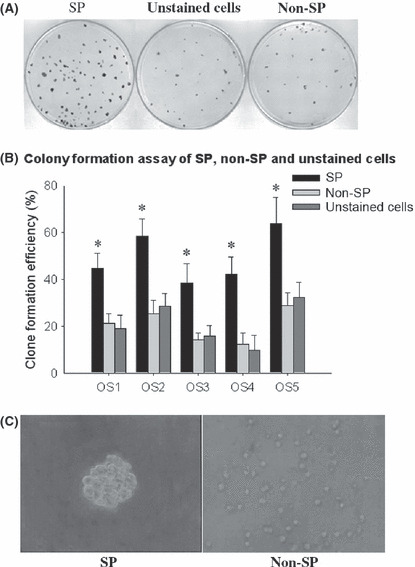
(A) Representative pictures of a clone formation assay of side population (SP), non‐SP and unstained cells (osteosarcoma sample 1 [OS1]). (B) Statistical analysis of clone formation efficiency. *P < 0.05, t‐test, vs non‐SP, statistical significance. (C) Representative pictures of a sphere cluster formed by SP cells after 7 days and no sphere cluster formed by non‐SP cells (original magnification, ×400).
Side population cells have the ability to form sphere clusters. After 7 days of culture, sphere clusters were clearly observed in SP cultures (all five samples), while non‐SP did not form spheres (Fig. 3C). The SP spheres were then seeded in standard plates with 15% FBS. Within a few hours cells migrated from the spheres and adhered to the bottom of the flasks. After 7 days of culture, adherent cells were restained with Hoechst 33342 and analyzed using FACS. The secondary sorted SP cells still had the ability to form spheres, while the non‐SP did not.
Side population cells exhibit heightened drug resistance. To test drug resistance, SP and non‐SP cells from three osteosarcomas were chosen to be exposed to three commonly used antitumor drugs. The difference of sensitivity to antitumor drugs between SP and non‐SP cells was assessed using the MTT assay (Fig. 4). IC50 values for a 48‐h treatment of doxorubicin, cisplatin and methotrexate were significantly increased (except cisplatin to OS1, and cisplatin and methotrexate to OS5) in SP cells compared with non‐SP cells (Table 2). The data revealed that SP cells showed higher resistance to chemotherapeutic drugs than non‐SP cells.
Figure 4.
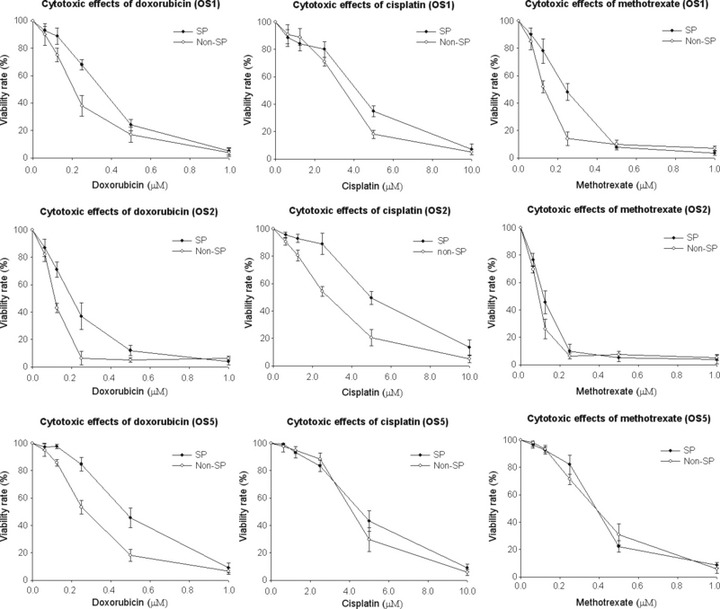
MTT curves of doxorubicin, cisplatin and methotrexate sensitivity of side population (SP) and non‐SP cells derived from three osteosarcomas.
Table 2.
Cytotoxic effects of chemotherapeutic drugs on side population (SP) and non‐SP (NSP) cells
| IC50 (μM) | |||||||||
|---|---|---|---|---|---|---|---|---|---|
| Doxorubicin | Cisplatin | Methotrexate | |||||||
| SP | NSP | SP | NSP | SP | NSP | ||||
| OS1 | 0.28 ± 0.014 | 0.21 ± 0.041 | 3.02 ± 0.208 | 2.76 ± 0.139 | 0.19 ± 0.018 | 0.13 ± 0.015 | |||
| P = 0.044* | P = 0.142 | P = 0.014* | |||||||
| OS2 | 0.18 ± 0.021 | 0.10 ± 0.017 | 4.84 ± 0.278 | 2.41 ± 0.347 | 0.10 ± 0.009 | 0.07 ± 0.011 | |||
| P = 0.007* | P = 0.01* | P = 0.019* | |||||||
| OS5 | 0.45 ± 0.062 | 0.27 ± 0.029 | 4.34 ± 0.456 | 4.07 ± 0.087 | 0.34 ± 0.021 | 0.36 ± 0.022 | |||
| P = 0.011* | P = 0.361 | P = 0.352 | |||||||
Values expressed as mean ± SD. *P < 0.05, t‐test, statistical significance. OS, osteosarcoma sample.
The ABC transporters and “stemness” genes are upregulated in SP cells. Comprehensive analysis of OS1 SP and non‐SP gene expression was performed using microarray analysis. The data revealed that 109 genes were upregulated in SP compared with non‐SP cells, while 26 genes were downregulated. According to their functions, the most upregulated genes were categorized into “transcriptional regulation” and “nucleic acid binding” groups. Parts of the genes function were unclear. It was noteworthy that two ABC transporter genes (ABCA2 and ABCG2) and one “stemness” gene (Oct‐4) were upregulated in SP cells.
The ABC transporters have the capacity to export many cytotoxic drugs( 29 , 30 ) and are upregulated in SP cells derived from other tissues,( 20 , 21 , 22 , 23 , 24 , 25 , 26 , 27 ) which might partly elucidate why SP cells show higher multidrug resistance compared with non‐SP cells. Oct‐4 and Nanog, key marker genes of embryonic stem cell self‐renewal and pluripotency, have been observed in human osteosarcoma cells, but not seen in somatic cells.( 31 , 32 ) Therefore, to investigate the abundance of ABC transporters related to multidrug resistance and the expression of “stemness” genes in SP and non‐SP cells, a real‐time RT‐PCR assay was used because the sensitivity of microarray examination is lower than that of real‐time RT‐PCR. Four major drug transporters (ABCA2, ABCB1/MDR1, ABCC1/MRP1 and ABCG2) and two major “stemness” genes (Oct‐4 and Nanog) were tested in all samples in the present study. The results revealed that the expression levels of these tested ABC transporter genes were evidently higher in SP cells compared with non‐SP cells, especially for ABCG2, which was upregulated significantly in the SP fraction of all tested cell samples (Fig. 5A–D). Similar results were observed in Oct‐4 and Nanog (Fig. 5E,F).
Figure 5.
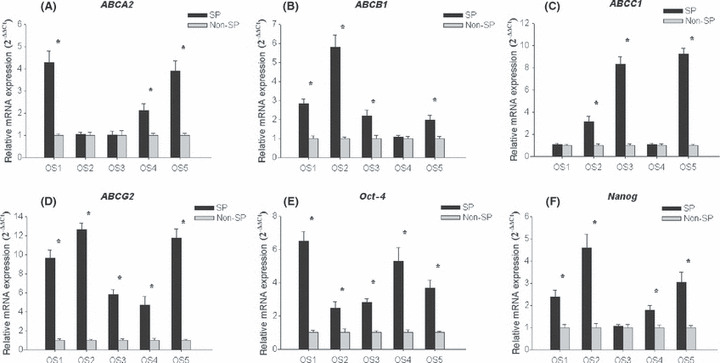
Relative mRNA expression of genes in side population (SP) and non‐SP cells. The expression of ATP binding cassette (ABC) transporter genes ABCA2 (A), ABCB1 (B), ABCC1 (C) and ABCG2 (D), and ‘stemness’ genes Oct‐4 (E) and Nanog (F) were determined by real‐time RT‐PCR. The expression level was normalized (ΔCt) to the expression of mRNA for β‐actin as an internal control and compared with the corresponding ΔCt (ΔΔCt) in controls (non‐SP cells). *P < 0.05, t‐test, statistical significance.
Expression of other stem cell markers on SP and non‐SP cells. To test the expression of other putative stem cell markers in the SP phenotype of osteosarcoma, the SP and non‐SP cells were stained with antibodies for three putative stem cell markers (CD44, CD117 and CD133). Cell surface marker analysis showed that all tested markers could be found in both the SP and non‐SP cells and expression of each individual marker was identical on the SP and non‐SP cells (Fig. 6).
Figure 6.
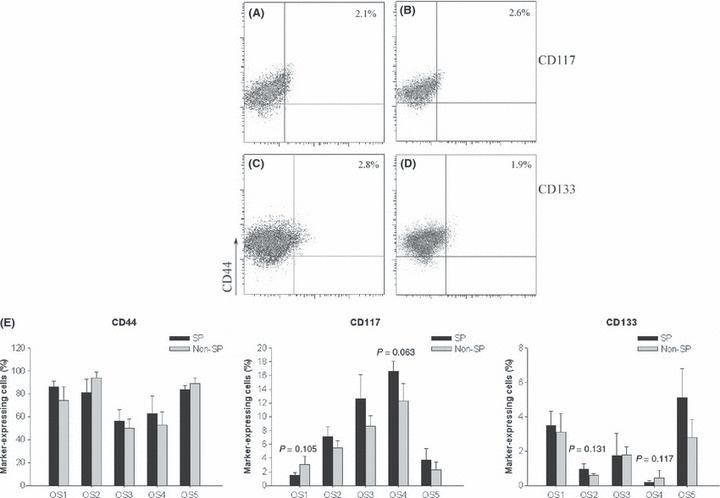
(A–D) Surface marker expression of osteosarcoma sample 1 (OS1) side population (SP) (left column) and non‐SP (right column) cells. (A,B) Expression of CD117. (C,D) Expression of CD133. CD44 expression is displayed on all y‐axes. (E) Percentages of cells expressing CD44, CD117 and CD133 in all SP and non‐SP cells. No statistical difference, t‐test.
Discussion
Unlike leukemias, gliomas and other tumors, few universally recognized cell surface markers have been successfully proven to select and identify the osteosarcoma‐initiating cells, even though many candidate markers, such as CD133 and Sca‐1, have been tested in recent studies.( 8 , 9 ) Hence, in the present study the Hoechst dye exclusion method was adopted to isolate SP cells from primary osteosarcoma to test their stem‐cell‐like characteristics. The established human osteosarcoma cell line U2OS should have been examined as a positive control according to the original scheme. Unfortunately, no SP fraction was detected in U2OS no matter how we tried in our preliminary investigation, consistent with other researchers.( 26 ) The differences in the existence of SP cells between primary tumor and long‐term cultured cell lines indicate that cell lines do not have the capacity to completely represent the true nature of tumors in vivo, especially those derived from osteosarcoma.
The SP cells were authentically found in osteosarcoma (including three general subtypes), which were more clonogenic than non‐SP cells and could grow as spheres in a semi‐solid medium. All of these suggest that SP cells from osteosarcoma have the capacity of clonogenicity and self‐renewal in vitro. It was also confirmed that the toxicity of the Hoechst dye had little effect on non‐SP cells, because the clonogenic ability of non‐SP cells was similar to that of the unstained cells.
The SP cells exhibited repopulating capacities, high tumorigenicity and self‐renewal characteristics. The repopulation from the SP fraction was similar in percentage of SP cells to the original population in vitro and the tumors formed from SP cells were analogous to the primary tumor in vivo, which suggests that SP cells have the capacity to generate both SP and non‐SP cells by asymmetric division, just like stem cells. Moreover, higher tumorigenicity of SP cells indicates that SP cells from osteosarcoma are enriched with tumor‐initiating cells. Importantly, only the SP fraction is able to self‐renew both in vitro and in vivo. All of these are consistent with properties of SP fraction derived from other cell lines and tumors.( 10 , 20 , 21 , 22 , 23 , 24 , 25 , 26 , 27 ) Interestingly, the percentage of SP cells is significantly larger in osteocarcinoma compared with most other tumors from which SP cells have been successfully isolated. Perhaps high‐grade malignancy of osteosarcoma is due to this, in part.( 10 ) However, a small fraction of SP cells were detected in non‐SP repopulation both in vitro and in vivo, opposed to the work by Wu et al. ( 10 ) It is controversial that non‐SP cells also have the capacity to produce cells of different populations and some studies choose to glide over this issue. In addition, it should not be ignored that non‐SP cells still maintained some level of tumorigenicity despite the large numbers of cells needed to form a tumor. Based on our results and the hypothesis proposed by Patrawala et al.,( 20 ) the most reasonable explanation might be that the non‐SP group contains small quantities of ABCG2‐primitive cells with self‐renewal and proliferative potentials but slow cycling, which have the capacity to generate ABCG2+ cells (SP cells) with high tumorigenicity and repopulating capacities under certain circumstances. Furthermore, we speculate that the number of SP cells should be positively correlated to the tumorigenicity of the cells tested.
Like stem cells with a high tolerance to cytotoxins, SP cells exhibited heightened resistance to multiple chemotherapeutic drugs. It is confirmed that high expression of ABC transporters regulating lipophilic chemotherapeutic drug efflux plays an important role in the mechanism of tumor cells with multidrug resistance. Therefore, we examined the mRNA expression levels of several members of the ABC transporter family in osteosarcoma cells sorted previously. Strikingly, these multi‐drug resistance (MDR) genes were upregulated in SP cells, which could partly elucidate the cause of increased chemoresistance of SP cells. All these genes would be ideal targets for osteosarcoma therapy.
In addition, elevated levels of “stemness” genes Oct‐4 and Nanog were observed in osteosarcoma SP cells. Recent studies have already confirmed that Oct‐4 and Nanog are key transcription factors playing important roles in the maintenance of self‐renewal and pluripotency of undifferentiated embryonic stem cells.( 31 , 32 ) Furthermore, sarcospheres derived from some osteosarcoma cells in vitro exhibit high expression levels of both Oct‐4 and Nanog.( 7 , 9 ) All of these previous studies suggest that there is a group of cells possessing attributes of stem cells in osteosarcoma. Our results are further supportive of this opinion. Increased expression of Oct‐4 and Nanog in SP cells indicates that SP cells are enriched with stem‐like characteristics.
In conclusion, our studies show that a small fraction of cells with the SP phenotype exists in primary osteosarcoma and SP cells exhibit significant tumorigenicity and several properties of stem sells such as repopulating capacity, elevated clonogenicity, self‐renewal, multi‐chemoresistance and high expression of “stemness” genes. All these results suggest that SP cells derived from osteosarcoma are enriched with stem‐like cells, which are responsible for tumor initiation and maintenance. Although SP cells could not absolutely represent the total CSC population, because the non‐SP group still contains some tumor‐initiating cells and other researchers found some cell‐surface markers could be used to isolate CSC of osteosarcoma,( 9 , 33 ) the SP analysis in isolating CSC of osteosarcoma could not be replaced because these potential stem markers (CD44, CD117 and CD133) did not associate with the SP phenotype. To precisely identify osteosarcoma CSC, a combination of different strategies might be attempted in future work.
Disclosure Statement
This paper does not have any conflict of interest with other people or organizations.
Supporting information
Data S1. Methods: Cell isolation and culture; SP analysis; tumorigenesis; colony formation assay; drug sensitivity assay; and real‐time RT‐PCR analysis.
Supporting info item
Acknowledgments
This work was supported by the National Key Basic Research Program of China (2009CB521705). The authors thank all members of the Department of Orthopaedic Surgery, Xijing Hospital, FMMU, for their support with this study.
References
- 1. Helman LJ, Meltzer P. Mechanisms of sarcoma development. Nat Rev Cancer 2003; 3: 685–94. [DOI] [PubMed] [Google Scholar]
- 2. Tang N, Song WX, Luo J et al. Osteosarcoma development and stem cell differentiation. Clin Orthop Relat Res 2008; 466: 2114–30. [DOI] [PMC free article] [PubMed] [Google Scholar]
- 3. Bielack SS, Carrle D, Hardes J et al. Bone tumors in adolescents and young adults. Curr Treat Options Oncol 2008; 9: 67–80. [DOI] [PubMed] [Google Scholar]
- 4. Akiyama T, Dass CR, Choong PF. Novel therapeutic strategy for osteosarcoma targeting osteoclast differentiation, bone‐resorbing activity, and apoptosis pathway. Mol Cancer Ther 2008; 7: 3461–9. [DOI] [PubMed] [Google Scholar]
- 5. Sakamoto A, Iwamoto Y. Current status and perspectives regarding the treatment of osteo‐sarcoma: chemotherapy. Rev Recent Clin Trials 2008; 3: 228–31. [DOI] [PMC free article] [PubMed] [Google Scholar]
- 6. Chou AJ, Geller DS, Gorlick R. Therapy for osteosarcoma: where do we go from here? Paediatr Drugs 2008; 10: 315–27. [DOI] [PubMed] [Google Scholar]
- 7. Gibbs CP, Kukekov VG, Reith JD et al. Stem‐like cells in bone sarcomas: implications for tumorigenesis. Neoplasia 2005; 7: 967–76. [DOI] [PMC free article] [PubMed] [Google Scholar]
- 8. Berman SD, Calo E, Landman AS et al. Metastatic osteosarcoma induced by inactivation of Rb and p53 in the osteoblast lineage. Proc Natl Acad Sci USA 2008; 105: 11851–6. [DOI] [PMC free article] [PubMed] [Google Scholar]
- 9. Tirino V, Desiderio V, d’Aquino R et al. Detection and characterization of CD133 + cancer stem cells in human solid tumours. PLoS ONE 2008; 3: e3469. [DOI] [PMC free article] [PubMed] [Google Scholar]
- 10. Wu C, Wei Q, Utomo V et al. Side population cells isolated from mesenchymal neoplasms have tumor initiating potential. Cancer Res 2007; 67: 8216–22. [DOI] [PubMed] [Google Scholar]
- 11. Dean M, Fojo T, Bates S. Tumour stem cells and drug resistance. Nat Rev Cancer 2005; 5: 275–84. [DOI] [PubMed] [Google Scholar]
- 12. Al‐Hajj M, Clarke MF. Self‐renewal and solid tumor stem cells. Oncogene 2004; 23: 7274–82. [DOI] [PubMed] [Google Scholar]
- 13. Li L, Neaves WB. Normal stem cells and cancer stem cells: the niche matters. Cancer Res 2006; 66: 4553–7. [DOI] [PubMed] [Google Scholar]
- 14. Scharenberg CW, Harkey MA, Torok‐Storb B. The ABCG2 transporter is an efficient Hoechst 33342 efflux pump and is preferentially expressed by immature human hematopoietic progenitors. Blood 2002; 99: 507–12. [DOI] [PubMed] [Google Scholar]
- 15. Singh SK, Hawkins C, Clarke ID et al. Identification of human brain tumour initiating cells. Nature 2004; 432: 396–401. [DOI] [PubMed] [Google Scholar]
- 16. Ponti D, Costa A, Zaffaroni N et al. Isolation and in vitro propagation of tumorigenic breast cancer cells with stem/progenitor cell properties. Cancer Res 2005; 65: 5506–11. [DOI] [PubMed] [Google Scholar]
- 17. Fang D, Nguyen TK, Leishear K et al. A tumorigenic subpopulation with stem cell properties in melanomas. Cancer Res 2005; 65: 9328–37. [DOI] [PubMed] [Google Scholar]
- 18. Ricci‐Vitiani L, Lombardi DG, Pilozzi E et al. Identification and expansion of human colon‐cancer‐initiating cells. Nature 2007; 445: 111–15. [DOI] [PubMed] [Google Scholar]
- 19. Patrawala L, Calhoun T, Schneider‐Broussard R et al. Highly purified CD44 + prostate cancer cells from xenograft human tumors are enriched in tumorigenic and metastatic progenitor cells. Oncogene 2006; 25: 1696–708. [DOI] [PubMed] [Google Scholar]
- 20. Patrawala L, Calhoun T, Schneider‐Broussard R et al. Side population is enriched in tumorigenic, stem‐like cancer cells, whereas ABCG2 + and ABCG2‐ cancer cells are similarly tumorigenic. Cancer Res 2005; 65: 6207–19. [DOI] [PubMed] [Google Scholar]
- 21. Ho MM, Ng AV, Lam S, Hung JY. Side population in human lung cancer cell lines and tumors is enriched with stem‐like cancer cells. Cancer Res 2007; 67: 4827–33. [DOI] [PubMed] [Google Scholar]
- 22. Haraguchi N, Utsunomiya T, Inoue H et al. Characterization of a side population of cancer cells from human gastrointestinal system. Stem Cells 2006; 24: 506–13. [DOI] [PubMed] [Google Scholar]
- 23. Chiba T, Kita K, Zheng YW et al. Side population purified from hepatocellular carcinoma cells harbors cancer stem cell‐like properties. Hepatology 2006; 44: 240–51. [DOI] [PubMed] [Google Scholar]
- 24. Szotek PP, Pieretti‐Vanmarcke R, Masiakos PT et al. Ovarian cancer side population defines cells with stem cell‐like characteristics and Mullerian inhibiting substance responsiveness. Proc Natl Acad Sci USA 2006; 103: 11154–9. [DOI] [PMC free article] [PubMed] [Google Scholar]
- 25. Zhou S, Schuetz JD, Bunting KD et al. The ABC transporter Bcrp1/ABCG2 is expressed in a wide variety of stem cells and is a molecular determinant of the side‐population phenotype. Nat Med 2001; 7: 1028–34. [DOI] [PubMed] [Google Scholar]
- 26. Hirschmann‐Jax C, Foster AE, Wulf GG et al. A distinct “side population” of cells with high drug efflux capacity in human tumor cells. Proc Natl Acad Sci USA 2004; 101: 14228–133. [DOI] [PMC free article] [PubMed] [Google Scholar]
- 27. Mitsutake N, Iwao A, Nagai K et al. Characterization of side population in thyroid cancer cell lines: cancer stem‐like cells are enriched partly but not exclusively. Endocrinology 2007; 148: 1797–803. [DOI] [PubMed] [Google Scholar]
- 28. Goodell MA, Rosenzweig M, Kim H et al. Dye efflux studies suggest that hematopoietic stem cells expressing low or undetectable levels of CD34 antigen exist in multiple species. Nat Med 1997; 3: 1337–45. [DOI] [PubMed] [Google Scholar]
- 29. Doyle LA, Ross DD. Multidrug resistance mediated by the breast cancer resistance protein BCRP (ABCG2). Oncogene 2003; 22: 7340–58. [DOI] [PubMed] [Google Scholar]
- 30. Szakács G, Paterson JK, Ludwig JA et al. Targeting multidrug resistance in cancer. Nat Rev Drug Discov 2006; 5: 219–34. [DOI] [PubMed] [Google Scholar]
- 31. Chambers I, Colby D, Robertson M et al. Functional expression cloning of Nanog, a pluripotency sustaining factor in embryonic stem cells. Cell 2003; 113: 643–55. [DOI] [PubMed] [Google Scholar]
- 32. Mitsui K, Tokuzawa Y, Itoh H et al. The homeoprotein Nanog is required for maintenance of pluripotency in mouse epiblast and ES cells. Cell 2003; 113: 631–42. [DOI] [PubMed] [Google Scholar]
- 33. Adhikari AS, Agarwal N, Wood BM et al. CD117 and Stro‐1 identify osteosarcoma tumor‐initiating cells associated with metastasis and drug resistance. Cancer Res 2010; 70: 4602–12. [DOI] [PMC free article] [PubMed] [Google Scholar]
Associated Data
This section collects any data citations, data availability statements, or supplementary materials included in this article.
Supplementary Materials
Data S1. Methods: Cell isolation and culture; SP analysis; tumorigenesis; colony formation assay; drug sensitivity assay; and real‐time RT‐PCR analysis.
Supporting info item