

Abstract
This study found that the HIV‐1 protease inhibitor nelfinavir (NFV) induced growth arrest and apoptosis of human prostate cancer cells (LNCaP, DU145 and PC‐3 cells), as measured by MTT and terminal deoxyribonucleotide transferase‐mediated dUTP nick end labeling (TUNEL) assays, respectively, on the third day of culture. In addition, NFV blocked androgen receptor (AR) signaling in association with downregulation of nuclear levels of AR in LNCaP cells as measured by reporter assay and western blot analysis. As expected, NFV downregulated the level of the AR target molecule prostate specific antigen in these cells. Moreover, NFV disrupted STAT3 signaling; protease inhibitors blocked interleukin‐6‐induced phosphorylation of STAT3 and inhibited STAT3 DNA binding activity in LNCaP and DU145 cells, as measured by western blot analysis and enzyme‐linked immunosorbent assay (ELISA), respectively. Furthermore, NFV blocked AKT signaling in prostate cancer cells as measured by kinase assay with glycogen synthase kinase‐3α/β as a substrate. Importantly, NFV inhibited the proliferation of LNCaP cells presented as tumor xenografts in BALB/c nude mice without side‐effects. Taken together, NFV inhibited the proliferation of prostate cancer cells in conjunction with blockade of signaling by AR, STAT3, and AKT, suggesting that this family of compounds might be useful for the treatment of individuals with prostate cancer. (Cancer Sci 2005; 96: 425 – 433)
Abbreviations:
- AR
androgen receptor
- ARE
androgen response elements
- DHT
5 α‐dihydrotestosterone
- DMSO
dimethyl sulfoxide
- ELISA
enzyme‐linked immunosorbent assay
- FBS
fetal bovine serum
- GSK‐3
glycogen synthase kinase‐3
- IDV
indinavir
- MTT
mitochondrial‐dependent conversion of the tetrazolium salt
- NFV
nelfinavir
- PI
HIV‐1 protease inhibitor
- PI3‐K
phosphatidylinositol 3‐kinase
- PSA
prostate specific antigen
- RTV
ritonavir
- SQV
saquinavir
- STAT3
signal transducers and activators of transcription 3
- TUNEL
terminal deoxyribonucleotide transferase‐mediated dUTP nick end labeling.
Androgens play an important role in the development and maintenance of the normal prostate as well as the initiation and progression of prostate cancer.( 1 , 2 ) Androgen deprivation therapy remains the mainstay of treatment for prostate cancer once it has progressed outside the prostate capsule.( 2 ) The androgen receptor (AR) belongs to the steroid hormone subfamily of nuclear hormone receptors and mediates the signal of androgens. AR is complexed in the cytoplasm to chaperone proteins that keep the receptor in a transcriptionally inactive form. Upon binding to the ligands, AR dissociates from the chaperone and translocates to the nucleus, where it binds to androgen response elements (ARE), recruits coregulators, and activates target genes such as prostate specific antigen (PSA).( 1 , 2 ) PSA belongs to the kallikrein‐like serine protease family; it is produced almost exclusively by the prostate epithelial cells, and is used as a serum marker for the diagnosis and progression of prostate cancer.( 3 ) The 5′ upstream promoter and enhancer region of the PSA gene contains several ARE to which ligand‐activated AR binds and induces expression of PSA.( 4 , 5 , 6 )
The JAK/STAT (Janus family tyrosine kinase [JAK]/signal transducer and activator of transcription [STAT]) signal pathway is involved in the control of gene expression in response to extracellular stimuli including cytokines and hormones, as well as growth factors, and regulate a variety of biological responses, such as development, differentiation, and proliferation.( 7 , 8 ) Once STAT proteins are activated by tyrosine‐phosphorylation, they form homo‐ or heterodimers and translocate to the nucleus, where they bind to specific sequences of target genes, thereby stimulating gene transcription. STAT3 is one of the seven STAT family members. Recent studies have shown that STAT3 is constitutively activated in a wide variety of cancer cells, including those from cancers of the head and neck, breast and prostate, and multiple myeloma, as well as malignant lymphoma.( 7 , 8 , 9 , 10 , 11 ) Thus, STAT3 might be a promising molecular target in a variety of cancer cells.
AKT/protein kinase B (PKB) is a serine (Ser)/threonine (Thr) protein kinase and plays an important role in controlling cell growth and apoptosis.( 12 ) Upstream of AKT is phosphatidylinositol 3‐kinase (PI3‐K), which activates AKT by phosphorylation at Ser 473 and Thr 308 of AKT.( 12 ) The activated AKT phosphorylates target molecules including Bad, forkhead transcriptional factor (FKHR), and glycogen synthase kinase‐3 (GSK‐3β), which induce antiapoptotic effects.( 13 , 14 , 15 ) Phosphatase and rensin homologue (PTEN) phosphatase is a major negative regulator of the PI3‐K/AKT signal pathway.( 16 , 17 ) In many cancer types, including prostate cancer, phosphatase and tensin homologue (PTEN) is inactivated by several mechanisms, including homozygous deletions, hemizygous deletions and mutations on the second allele, or methylation of its promoter region. Loss of expression of this phosphatase results in constitutive activation of AKT signaling.( 16 , 17 , 18 , 19 )
Human immunodeficiency virus type 1 (HIV‐1) protease inhibitors (PI) have become important tools in the treatment of HIV infection, and include saquinavir mesylate (SQV), ritonavir (RTV), indinavir sulfate (IDV), and nelfinavir mesylate (NFV). Recent studies have shown that PI possess antitumor activity that is independent of their ability to inhibit HIV protease: we found that SQV, RTV, and IDV induced the growth arrest and differentiation of NB4 and HL‐60 human myeloid leukemia cells, and enhanced the ability of all‐trans retinoic acid (ATRA) to decrease proliferation and increase differentiation in these cells.( 20 ) Other investigators have shown that PI can decrease the proliferation of Kaposi sarcoma as well as prostate cancer cells via inhibition of nuclear factor‐κB (NF‐κB) activity.( 20 , 21 , 22 , 23 )
In this study, we found that PI induced the growth arrest and apoptosis of prostate cancer cells in conjunction with disruption of their AR, STAT3, and AKT signal pathways. These studies suggest that PI might be useful for the treatment of individuals with prostate cancer.
Materials and Methods
Cell line. Prostate cancer LNCaP, PC‐3, and DU145 cells were obtained from the American Type Culture Collection (Manassas, VA, USA). They were maintained in RPMI 1640 with 10% fetal bovine serum (FBS).
Chemicals. The SQV (Roche, Branchburg, NJ, USA), RTV (Abbott Laboratories, North Chicago, IL, USA), IDV (Merck, West Point, PA, USA), and NFV (Japan Tobacco Specification, Tokyo, Japan) were dissolved in 50% dimethyl sulfoxide (DMSO; Burdick and Jackson, Muskegon, MI, USA) to a stock concentration of 10−2 M and stored at −80°C. Interleukin (IL)‐6 was provided by Kirin (Tokyo, Japan). AG490 and LY294002 were purchased from Calbiochem (San Diego, CA, USA).
MTT assays. Cells (104/mL) were incubated with various concentration of PI (10−5 to 5 × 10⁻⁵ M) for 3 days in 96‐well plates (Flow Laboratories, Irvine, CA, USA). After culture, cell number and viability were evaluated by measuring the mitochondrial‐dependent conversion of the tetrazolium salt MTT (Sigma), to a colored formazan product, as previously described.( 24 )
Colony forming assay. LNCaP cells were cultured in a two‐layer soft agar system for 14 days. Washed single‐cell suspensions of cells were enumerated and plated into 24‐well flat bottom plates with a total of 500 cells per well in a volume of 400 µL per well. The feeder layer was prepared with agar that had been equilibrated at 42°C. Prior to this step, PI were pipetted into the wells. After incubation for 14 days, colonies were counted. All experiments were carried out three times using triplicate plates per experimental point.
Assessment of apoptosis. Apoptotic cell death was examined by using the terminal deoxyribonucleotide TUNEL method using the In Situ Cell Death Detection kit (Roche Molecular Biochemicals, Germany) according to the manufacturer's instructions. For quantification, three different fields were counted under the microscope and at least 300 cells were enumerated in each field. All experiments were performed twice.
Plasmids. A 564‐bp fragment of the PSA promoter with a 2.4‐kb enhancer sequence (−5322 to −2925) cloned upstream of luciferase (PSA P/E‐Luc) was used.( 5 ) Also, ARE4‐E4 Lux, which is the multimerized four consensus ARE from the PSA promoter cloned upstream of the luciferase gene in the pGL3 vector (Promega, Chicago, IL) was used.( 25 )
Transfections and luciferase assay. LNCaP cells were plated in 24‐well plates and incubated until 60–80% confluency. Cells were transfected with the indicated plasmids using the GenePORTER transfection reagent (Gene Therapy Systems, San Diego, CA, USA). Following transfection, cells were incubated with 10% charcoal‐stripped FBS RPMI‐1640 either with or without DHT (10−8 M) and either with PI or control diluent (0.01% DMSO) for 24 h. Luciferase activity in cell lysates was measured by using the Dual Luciferase assay system (Promega, Madison, WI, USA); and this was normalized by using Renilla activity. The results were presented as fold induction, which is the relative luciferase activity of the treated cells over that of the control cells. All transfection experiments were carried out in triplicate wells and repeated separately at least three times.
Western blot analysis. LNCaP cells were plated on 60‐mm plates and incubated until 60–80% confluency, then the media was replaced with RPMI‐1640 containing 10% charcoal striped FBS either with or without DHT (10−8 M) and with either PI or control diluent (0.01–0.25% DMSO). After incubation, cells were washed twice in PBS, and whole cell lysates and nuclear extracts were prepared as previously described.( 24 ) Proteins were resolved by 4–15% sodium dodecyl sulfate polyacrylamide gel, transferred to an Immobilon polyvinylidene difluoride membrane (Amersham, Arlington Heights, IL, USA), and probed sequentially with antibodies. Anti‐AR N‐20 (Santa Cruz Biotechnology, Santa Cruz, CA, USA), anti‐PSA C‐19 (Santa Cruz), anti‐STAT3 (Santa Cruz), anti‐p‐STAT3 (Tyr705) (Cell Signaling, Beverly, MA, USA), anti‐AKT (Cell Signaling), anti‐p‐AKT (Ser473) (Cell Signaling), anti‐GSKα/β (Cell Signaling), anti‐p‐GSKα/β (Ser21/ 9) (Cell Signaling) and anti‐β‐actin (Santa Cruz) antibodies were used. The blots were developed using an enhanced chemiluminescence kit (Amersham).
Evaluation of DNA binding activity of STAT3 by ELISA. The DNA binding activity of STAT3 was quantified by ELISA using the Trans‐AM STAT Transcription Factor Assay kit (Active Motif North America, Carlsbad, CA, USA), according to the instructions of the manufacturer. Briefly, nuclear extracts were prepared as previously described and incubated in 96‐well plates coated with immobilized oligonucleotides containing a consensus (5′‐TTCCCGGAA‐3′) binding site for STAT3. STAT3 binding to the target oligonucleotide was detected by incubation with primary antibody specific for the activated form of STAT3 (Active Motif North America), visualized by anti‐IgG horseradish peroxidase conjugate and developing solution, and quantified at 450 nm with a reference wavelength of 655 nm. Background binding was subtracted from the value obtained for binding to the consensus DNA sequence.
AKT immunoprecipitation kinase assay. LNCaP cells were treated with either NFV (2 × 10⁻⁵ M) or control diluent (0.01% DMSO). After 24 h, cells were harvested and cell lysates were prepared. An AKT kinase assay was performed using an AKT kinase assay kit (Cell Signaling), according to the manufacturer's instructions. Briefly, 2 mg of cell lysates were incubated for 12 h with protein G‐agarose beads bearing anti‐AKT on a rotator at 4°C to immunoprecipitate AKT. This precipitate was next used to phosphorylate a specific substrate: the recombinant GSK‐3α/β protein expressed in Escherichia coli. Briefly, 1 µg recombinant GSK‐3α/β was incubated with AKT‐antibody‐protein G‐agarose complexes in the presence of magnesium/ATP mixture for 30 min at 37°C. Samples were boiled for 5 min, resolved on 10% SDS‐PAGE, and transferred onto Immobilon polyvinylidene difluoride membranes. The membranes were incubated sequentially with an anti‐p‐GSK‐3α/β (Ser21/ 9) and anti‐AKT antibodies.
Mice. Twelve male immunodeficient BALB/c nude mice at 6 weeks of age were purchased from Japan SLC (Shizuoka, Japan), and were maintained in pathogen‐free conditions with irradiated chow. Animals were bilaterally subcutaneously (s.c.) injected with 5 × 10⁶ LNCaP cells per tumor in 0.1 mL Matrigel (Collaborative Biomedical Products, Bedford, MA, USA). Mice were divided randomly into two groups of six mice each. Once tumor volume reached approximately 100 mm3, treatment was initiated. Either NFV (60 mg/kg) or control diluent was administered orally five times a week. The dose of NFV was determined by our preliminary studies (data not shown). Tumors were measured every week with vernier calipers. Tumor sizes were calculated by the formula: a × b × c, where a is the length, b is the width, and c is the height in mm. At the end of the experiment, animals were killed by CO2 asphyxiation and tumor weights were measured after they were carefully resected. Tumor tissue was collected for analysis.
Measurement of PSA in mice. Blood was withdrawn from mice several hours before they were killed. Serum levels of PSA were measured by immune assay using the Hybritech Access (Beckman Coulter, Chaska, MN, USA) according to the manufacturer's protocol.
Histology. Tumors were fixed for 12 h in 10% neutral buffered formaldehyde after sacrifice, tissue blocks were embedded in paraffin, and sections stained with hematoxylin and eosin were examined by light microscopy.
Statistical analysis. The statistical significance of the differences was analyzed by the non‐parametric Mann–Whitney U‐test and paired t‐test.
Results
Protease inhibitors induced growth arrest and apoptosis of prostate cancer cells. To explore the antiproliferative and proapoptotic effects of PI, LNCaP cells were cultured in the presence of various concentrations of PI (1–5 × 10⁻⁵ M). RTV, SQV, and NFV effectively inhibited the growth of LNCaP cells with ED50 values of approximately 3.5, 3.5, and 1.5 × 10⁻⁵ M, respectively, as measured by MTT assay on the third day of culture (Fig. 1a). Conversely, IDV was not able to inhibit their growth (Fig. 1a). These results were consistent with our previous studies showing that NFV, RTV and SQV, but not IDV inhibited the proliferation of multiple myeloma cells in vitro. ( 26 ) NFV also showed the strongest antitumor activity against androgen‐independent prostate cancer PC‐3 and DU145 cells with ED50 values of 1.2 and 2.3 × 10⁻⁵ M, respectively (Fig. 1b). Furthermore, the ability of PI to inhibit the growth of LNCaP cells was studied by colony forming assay (Fig. 1c). NFV showed stronger antitumor activity compared with other PI, which was consistent with the results of the MTT assay (Fig. 1a, c). We therefore chose NFV for further experiments. As shown in Figure 1d, NFV caused apoptosis in LNCaP cells in a dose‐ and time‐dependent manner as measured by TUNEL assay (Fig. 1d). After 24 h of culture, 1 × 10⁻⁵ and 2 × 10⁻⁵ M of NFV induced a mean 20 ± 5% and 37 ± 6% of LNCaP cells to become apoptotic, respectively, which increased to a mean of 39 ± 10% and 65 ± 4%, respectively, after another 24 h of culture.
Figure 1.
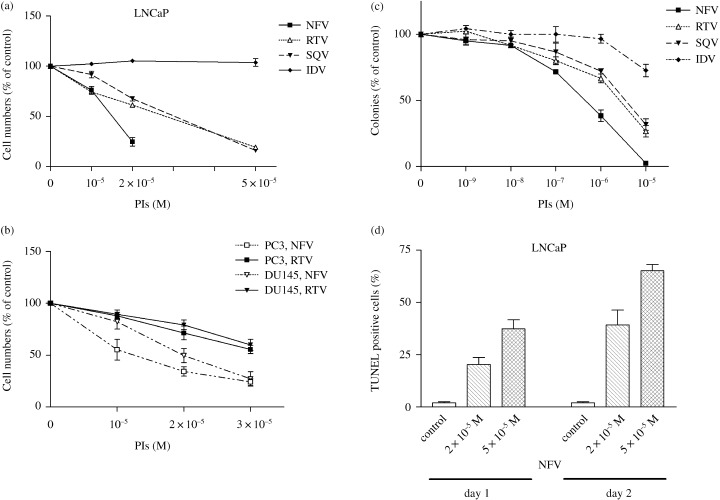
PI induce growth arrest and apoptosis of prostate cancer cells. MTT assay: (a) LNCaP, (b) PC‐3 and (b) DU145 cells were plated in 96‐well plates and cultured with either PI (10−6 M−5 × 10⁻⁵ M) or control diluent (0.005–0.25% DMSO). After 3 days, the cells were treated with MTT for 4 h, and absorbance was measured. Results represent the mean ± SD of three experiments performed in triplicate. Colony forming assay: (c) LNCaP cells (500 cells per plate) were cultured with a variety of concentrations of PI (10−9−10−5 mol/L). Colonies (> 40) were enumerated after 14 days of incubation. Results are expressed as a mean percentage of control plates containing 0.1% DMSO (control diluent). Each point represents a mean of three independent experiments with triplicate plates. Bars, SD. TUNEL assay: (d) LNCaP cells were plated in 96‐well plates and cultured with either NFV (2 × 10⁻⁵ M or 5 × 10⁻⁵ M) or control diluent (0.25% DMSO); and 1 or 2 days later, apoptosis was measured by TUNEL assay. Results represent the mean ± SD of two experiments carried out in triplicate.
Effect of PI on expression of p21 waf 1 p27 kip 1 and p53 in LNCaP cells. The modulation of expression of the cell cycle checkpoint proteins, p21 waf 1 p27 kip 1 and p53 were examined by western blot analysis (Fig. 2a). LNCaP cells constitutively expressed wild type p53 protein; neither NFV (1 or 2 × 10⁻⁵ M, 24 h) nor RTV (2 or 5 × 10⁻⁵ M, 24 h) modulated levels of p53 in LNCaP cells (Fig. 2a). The level of the p21 waf 1 protein was negligible in the untreated LNCaP cells; however, exposure of these cells to RTV (2 or 5 × 10⁻⁵ mol/L, 24 h) resulted in a dramatically increased level of p21 waf 1 protein in a dose‐dependent manner (Fig. 2a). However, NFV did not induce the expression of p21 waf 1 protein in LNCaP cells (Fig. 2a). Both NFV and RTV increased the levels of p27 kip 1 in these cells by two‐ or fourfold, respectively. The time course study showed that RTV induced the expression of p21 waf 1 after as little as 3 h of culture, and the level of this cyclin dependent kinase inhibitor was still rising at 24 h (Fig. 2b). IDV was not able to modulate any of the cell cycle checkpoint proteins (figure not shown).
Figure 2.
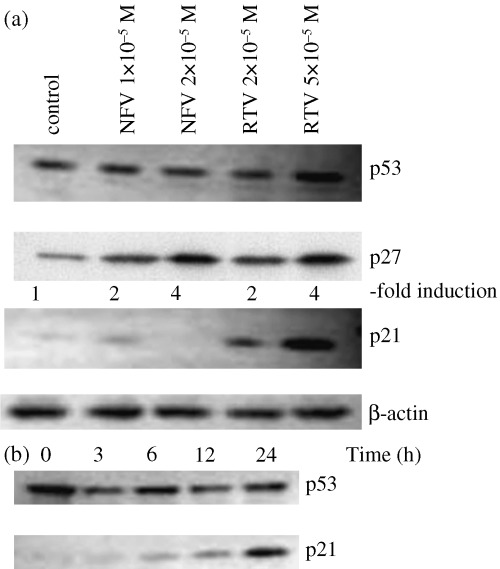
Effect of PI on levels of p53, p27 kip 1 , and p21 waf 1 protein in LNCaP cells. (a) LNCaP cells were cultured in the presence of either NFV (1 or 2 × 10⁻⁵ M), RTV (2 or 5 × 10⁻⁵ M), or control diluent (0.25% DMSO). After 24 h, cells were harvested and subjected to western blot analysis. The polyvinylidene fluoride membrane was sequentially probed with anti‐p53, p21 waf 1 and p27 kip 1 antibodies, and band intensities were measured using densitometry. (b) LNCaP cells were cultured in the presence of RTV (5 × 10⁻⁵ M). After various durations, cells were harvested and subjected to western blot analysis. The polyvinylidene fluoride membrane was sequentially probed with anti‐p53 and p21 waf 1 antibodies.
Effect of PI on levels of PSA and AR protein. LNCaP cells cultured in the presence of 10% FBS constitutively expressed the PSA protein, and RTV, NFV, and SQV almost completely inhibited the expression of PSA in these cells (Fig. 3a). The level of PSA in the control LNCaP cells cultured with charcoal striped FBS (10%, 24 h) was extremely low (Fig. 3b). DHT (10−8 M, 24 h) increased PSA expression approximately 15‐fold in these cells. Exposure of LNCaP cells to RTV (2 × 10⁻⁵ M), SQV (2 × 10⁻⁵ M), and NFV (10−5 M, 24 h) almost completely blocked DHT‐induced levels of PSA in these cells. (Fig. 3b). In addition, we explored the effect of PI on the nuclear level of AR. DHT (10−8 M, 24 h) increased the intranuclear levels of AR by approximately fivefold; and the addition of NFV (10−5 M, 24 h) blocked the DHT‐induced nuclear levels of AR (Fig. 3c). To study whether PI affect the nuclear translocation of AR mediated by DHT, we analyzed levels of AR shortly after exposure of cells to DHT (Fig. 3d). DHT (10−8 M, 6 h) increased the intranuclear levels of AR by approximately threefold; and NFV (10−5 M, 6 h) downregulated the DHT‐induced nuclear level of AR by approximately 30% (Fig. 3d). At the same time, we extracted cytoplasmic protein and measured the level of AR. The exposure of LNCaP cells to DHT decreased the level of AR in the cytoplasm by half; however, the addition of NFV did not affect the DHT‐induced downregulation of AR (Fig. 3d), suggesting that NFV did not interfere with the DHT‐induced nuclear translocation of AR.
Figure 3.
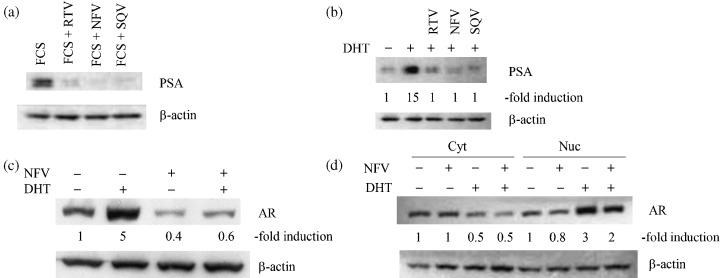
Effect of PI on expression of PSA and AR. (a) LNCaP cells were placed in culture medium containing 10% FBS and exposed to either RTV (2 × 10⁻⁵ M), NFV (10−5 M), or SQV (2 × 10⁻⁵ M). After 24 h, cells were harvested and subjected to western blot analysis. (b) LNCaP cells were placed in culture medium containing 10% charcoal striped FBS for 24 h before the addition of either DHT (10−8 M) alone, or DHT (10−8 M) in combination with either RTV (2 × 10⁻⁵ M), NFV (10−5 M), or SQV (2 × 10⁻⁵ M). After the addition of reagents, cells were cultured for 24 h, then proteins were extracted and subjected to western blot analysis. (c,d) LNCaP cells were placed in culture medium containing 10% charcoal striped FBS for 24 h before the addition of either DHT (10−8 M) alone, or DHT (10−8 M) in combination with NFV (10−5 M). Either after (c) 24 h or (d) 6 h, cytoplasmic and nuclear proteins were obtained and subjected to western blot analysis. The band intensities were measured by densitometry. Cyt, cytoplasmic protein; Nuc, nuclear protein.
Effect of PI on the promoter of PSA. We next analyzed the effect of PI on the ability of DHT to transactivate the PSA promoter/enhancer. The LNCaP prostate cancer cells were cultured with DHT (10−8 M) after they were transfected with the PSA promoter/enhancer‐luciferase reporter vector. The reporter activity increased approximately 18‐fold as compared with non‐treated control LNCaP cells (Fig. 4a). When the cells were treated with the combination of DHT (10−8 M, 18 h) and NFV (10−5 M, 18 h), luciferase activity was dramatically reduced by approximately 70% compared with DHT alone (Fig. 4a). We also studied the effect of NFV using the 496‐bp fragment of the PSA enhancer, which has multiple ARE.( 25 ) Luciferase activity was stimulated by DHT (10−8 M), and NFV (10−5 M) inhibited this effect by approximately 80% (Fig. 4b). As expected, DHT did not activate and NFV did not inhibit luciferase activity when the four most active ARE were mutated (Fig. 4b). These findings suggest that NFV inhibits the ability of androgens to activate the PSA promoter/enhancer, and this effect appears to be mediated via the inhibition of AR/ARE transcriptional activity. Further experiments were performed using a luciferase reporter construct in which the ARE of the PSA was concatemerized (ARE4‐E4Lux). LNCaP cells were transfected with ARE4‐E4Lux and cultured with DHT (10−8 M) either with or without NFV. The reporter activity increased approximately sevenfold when these cells were cultured with DHT, as compared with the non‐treated control LNCaP cells (Fig. 4c). When the cells were treated with the combination of DHT (10−8 M) and NFV (10−5 M), luciferase activity was reduced by 70% compared with DHT alone (Fig. 4c). RTV (10−5 M) also inhibited both DHT‐induced PSA promoter activity and ARE transcriptional activity in LNCaP cells (data not shown).
Figure 4.
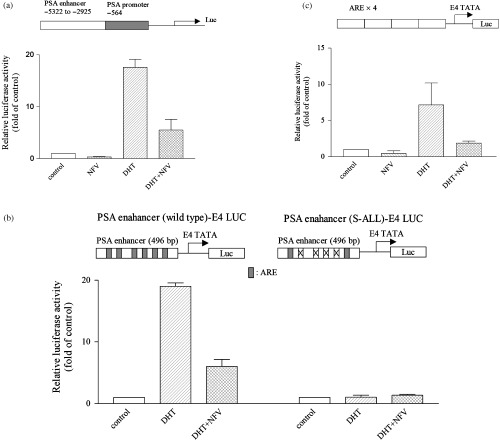
(a) Effect of PI on the transcriptional activity of the PSA promoter/enhancer in LNCaP cells. The reporter construct (PSA P/E‐Luc) is shown at the top. LNCaP cells were transfected with PSA P/E‐Luc (0.8 µg), and DHT (10−8 M) with either NFV (10−5 M) or control diluent (0.05% DMSO) were added. A pRL‐SV40‐Luciferase (Renilla luciferase) vector was cotransfected for normalization. Results represent the mean ± SD of three experiments carried out in triplicate. (b) Effect of PI on wild type and mutant PSA enhancer. Diagrams of the PSA enhancer E4 LUC and PSA enhancer S‐All‐LUC are shown at the top. Wild type and mutant ARE sites are represented by rectangles and cross‐hatches, respectively. LNCaP cells were transfected with the reporter construct (0.8 µg), and DHT was added to a final concentration of 10−8 M with either NFV (10−5 M) or control diluent (0.05% DMSO). The pRL‐SV40‐Luciferase (Renilla luciferase) vector was cotransfected for normalization. Results represent the mean ± SD of three experiments carried out in triplicate. (c) Effect of PI on ARE activation in LNCaP cells. Shown at the top is the construct (ARE4‐E4Lux) containing the four concatemerized ARE identical to those in the PSA enhancer, which is attached to the luciferase reporter. LNCaP cells were transfected with ARE4‐E4Lux (0.8 µg). DHT (10−8 M) was added with either NFV (10−5 M) or control diluent (0.05% DMSO). pRL‐SV40‐Luciferase (Renilla luciferase) vector was cotransfected for normalization. Results represent the mean ± SD of three experiments carried out in triplicate.
Effect of PI on basal and IL‐6‐stimulated STAT3 activity in prostate cancer cells. The effect of PI on STAT3 activity was investigated by an ELISA‐based assay. Of the three prostate cancer cell lines, DU145 cells possessed the strongest STAT3 DNA binding activity, and 10−5 M of NFV inhibited this activity by approximately 50% (Fig. 5a). LNCaP cells also possessed measurable STAT3 DNA binding activity and NFV (10−5 M, 24 h) inhibited this activity by approximately half (Fig. 5a). The addition of IL‐6 (50 ng/mL, 30 min) to these cells further increased DNA binding activity (fivefold), and preincubation of these cells with 10−5 M of NFV for 3 h decreased IL‐6‐induced STAT3 DNA binding activity by 40% (Fig. 5a). Conversely, STAT3 DNA binding activity was negligible in PC‐3 cells, and NFV was not able to reduce this binding activity (Fig. 5a).
Figure 5.
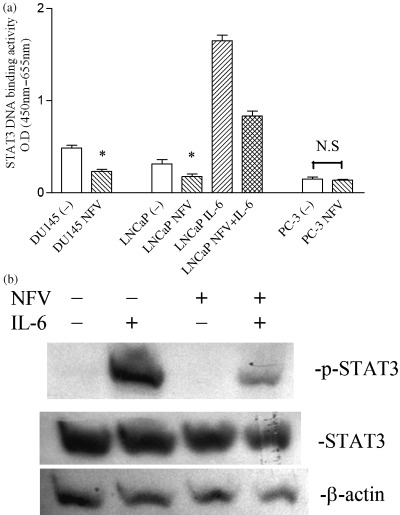
Effect of PI on STAT3 activity in prostate cancer cells. (a) STAT3 ELISA: DU145, LNCaP, and PC‐3 cells were cultured with either NFV (10−5 M) or control diluent (0.05% DMSO). After 3 h, cells were exposed to interleukin‐6 (50 ng/mL) for 30 min. Nuclear protein was extracted and subjected to ELISA for measurement of STAT3 DNA binding activity. Results represent the mean ± SD of two experiments carried out in duplicate. Statistical significance was determined by paired t‐test. *P < 0.05; NS, not significant. (b) Western blot analyses: LNCaP cells were cultured with either NFV (10−5 M) or control diluent. After 3 h, cells were exposed to interleukin‐6 (50 ng/mL) for 30 min. Cells were harvested and subjected to western blot analysis. The polyvinylidene fluoride membrane was sequentially probed with anti‐p‐STAT3 (Tyr705), ‐STAT3, and ‐β‐actin antibodies.
The effect of PI on STAT3 was further examined using western blot analysis (Fig. 5b). The phosphorylated form of STAT3 was not detectable in control LNCaP cells; exposure of these cells to IL‐6 (50 ng/mL, 30 min) dramatically induced the phosphorylation of STAT3, and pretreatment (3 h) of these cells with 10−5 M of NFV inhibited the IL‐6‐induced phosphorylation of STAT3 by at least 50% (Fig. 5b). NFV alone did not modulate levels of total STAT3 in these cells (Fig. 5b).
Effect of PI on AKT signaling. Control LNCaP cells expressed the phosphorylated form of AKT, and exposure of these cells to NFV (10−5 M, 24 h) completely blocked expression of the phosphorylated form of AKT without affecting the total amount of AKT (Fig. 6a). PC‐3 cells also constitutively expressed p‐AKT and NFV downregulated the expression of the phosphorylated form of AKT in a dose‐dependent manner (Fig. 6b). The effect of NFV on AKT signaling was further studied by using the AKT kinase assay with GSK‐3α/β as a substrate. NFV (10−5 M, 24 h) inhibited AKT kinase activity in LNCaP cells by approximately half (Fig. 6c).
Figure 6.
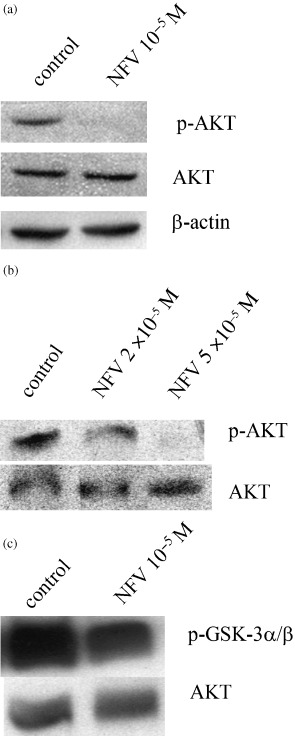
Effect of PI on AKT activity. (a,b) Western blot analysis: (a) LNCaP and (b) PC‐3 cells were cultured either with NFV (1–5 × 10⁻⁵ M) or control diluent (0.05–0.25% DMSO). After 24 h, cells were harvested and proteins were extracted and subjected to western blot analysis. The polyvinylidene fluoride membrane was sequentially probed with anti‐p‐AKT (Ser473), ‐AKT, and ‐β‐actin antibodies. (c) AKT kinase assay: LNCaP cells were cultured with either NFV (10−5 M) or control diluent (0.05%). After 24 h, cells were harvested and proteins were extracted and subjected to AKT kinase assay using recombinant GSK‐3α/β as a substrate. The polyvinylidene fluoride membrane was sequentially probed with anti‐p‐GSK‐3α/β(Ser21/9) and ‐AKT antibodies.
Inhibitors of STAT3 and AKT downregulate levels of PSA. We explored the association between STAT3, AKT and AR signaling. We used the JAK2 inhibitor AG490 and the PI3‐K inhibitor LY294002 to disrupt the STAT3 and AKT signaling pathways, respectively. The inhibition of STAT3 and AKT signaling pathways by these inhibitors effectively blocked expression of the AR‐driven PSA gene in LNCaP cells (Fig. 7a). Western blot analysis of p‐AKT (Fig. 7a) and STAT3 ELISA (Fig. 7b) showed the specificity of each inhibitor.
Figure 7.
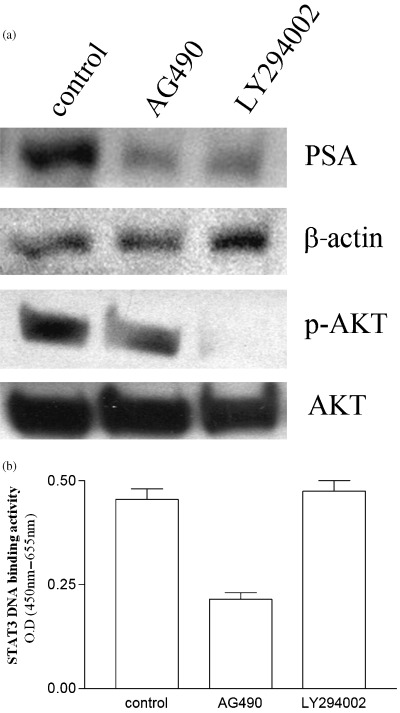
Effect of inhibitors of STAT3 and AKT signaling on levels of PSA in LNCaP cells. (a) Western blot analysis. LNCaP cells were cultured with either control diluent (0.25% DMSO), JAK2 inhibitor AG490 (5 × 10⁻⁵ M) or PI3‐K inhibitor LY294002 (5 × 10⁻⁵ M). After 24 h, cells were harvested and proteins were extracted and subjected to western blot analysis. The polyvinylidene fluoride membrane was sequentially probed with anti‐PSA, ‐p‐AKT (Ser473), ‐AKT, and ‐β‐actin antibodies. (b) STAT3 ELISA: LNCaP cells were cultured with either control diluent (0.25% DMSO), JAK2 inhibitor AG490 (5 × 10⁻⁵ M) or PI3‐K inhibitor LY294002 (5 × 10⁻⁵ M) for 24 h. Nuclear protein was extracted and subjected to ELISA for measurement of STAT3 DNA binding activity. Results represent the mean ± SD of two experiments carried out in duplicate.
Effect of NFV on LNCaP cells in vivo. We evaluated the effect of NFV in vivo on LNCaP cells growing in BALB/c nude mice. NFV (60 mg/kg) was given by gavage five times per week. Tumor volumes were measured weekly. All mice were killed after 3 weeks, and tumors were dissected and weighed. NFV significantly suppressed both the growth of LNCaP tumors (P < 0.05; Fig. 8a) and their mean weights (P < 0.01) at autopsy (Fig. 8b), as compared with diluent controls.
Figure 8.

Effect of NFV on growth of LNCaP tumors in nude mice. (a) LNCaP cells were injected bilaterally subcutaneously into BALB/c nude mice, forming two tumors per mouse. NFV (60 mg/kg) was administered orally to mice five times a week for 3 weeks. Tumor volumes were measured every week. Each point represents the mean ± SD of 12 tumors. (b) Tumor weights at autopsy: After 6 weeks of treatment, tumors were removed and weighed. Results represent mean ± SD of tumor weights. Statistical significance was determined by the Mann–Whitney U‐test. Bars, SD. (c) Serum levels of PSA. After 3 weeks of treatment, blood was withdrawn from each mouse and serum levels of PSA were measured. Bars, SD. (d,e) Histology of LNCaP human prostate tumors from mice treated with NFV in vivo: After 3 weeks of growth in nude mice either with or without treatment with NFV, LNCaP tumors were removed, fixed in formalin, and stained with HE. (d) Control tumors from mice that received diluent displayed poorly differentiated adenocarcinoma (× 200). (e) Tumors from mice treated with NFV (60 mg/kg) five times a week for 3 weeks showed marked fibrosis and appearance of inflammatory cells such as giant cells (arrows; × 200).
Blood was withdrawn from mice several hours before they were sacrificed, and levels of PSA were measured. The mean serum level of PSA in the mice who received NFV was significantly lower than that in the mice who received diluent (2.2 ± 1.2 ng/mL vs 5.3 ± 1.9 ng/mL, P = 0.03) (Fig. 8c). The serum levels of PSA in normal mice at the same age were less than 0.03 ng/mL (data not shown).
The tumors and organs of the mice were fixed, stained, and viewed by light microscopy. The tumors from control mice had a histological appearance that was typical of infiltrating, poorly differentiated adenocarcinomas of the prostate (Fig. 8d). Tumors from mice receiving NFV had marked fibrosis and inflammatory cells such as giant cells (Fig. 8d). Organs from mice treated with NFV did not show any changes compared with controls, including their livers, kidneys, and spleens. During the study, all the mice were weighed each week; the mean weights of the experimental groups were statistically the same as those of the control mice (data not shown).
Discussion
In the present study, we found that HIV‐1 PI blocked AR signaling in association with downregulating the nuclear levels of AR. PI were also active against androgen‐independent prostate cancer PC‐3 and DU145 cells, whose growth was not under the control of androgen, suggesting that PI may affect other signal pathways in these cells. One of the candidates is STAT3 signaling. As previously described,( 9 , 10 ) we found that STAT3 was activated in DU145 cells (Fig. 5). PI inhibited the DNA binding activity of STAT3 in these cells (Fig. 5). In addition, we have recently shown that PI induced the growth arrest and apoptosis of multiple myeloma cells in conjunction with a blockade of STAT3 signaling.( 26 ) Thus, inhibition of STAT3 signaling probably mediates at least in part PI‐induced growth arrest and apoptosis of cancer cells.
The STAT3 DNA binding activity was barely detectable in PC‐3 cells (Fig. 5a). Therefore, other signal pathways probably contribute to the proliferation of PC‐3 cells and PI could affect these pathways. PTEN is inactivated in PC‐3 cells because of homozygous deletion, resulting in activation of AKT signaling.( 17 ) PI downregulated levels of the phosphorylated form of AKT in PC‐3 cells (Fig. 6). These results suggest that the inhibition of AKT signaling probably contributes to PI‐mediated growth arrest and apoptosis of these cells. Another signal pathway, which might be affected by PI, relates to transcription factor NF‐κB. We have previously found (along with other researchers) that NF‐κB is activated in androgen‐independent PC‐3 and DU145 cells compared with androgen‐dependent LNCaP cells.( 24 , 27 ) RTV (2 × 10⁻⁵ M, 24 h) inhibited the DNA binding activity of NF‐κB by approximately 50% as measured by an ELISA‐based assay (data not shown). These results are consistent with those from previous studies by other investigators, who have shown that RTV inhibits NF‐κB activity in Kaposi sarcoma cells.( 21 , 22 ) Conversely, NFV was not able to inhibit NF‐κB activity in PC‐3 cells under similar culture conditions (data not shown). Further studies are warranted to clarify the chemical differences between each PI.
The ARE transcriptional activity is regulated by coregulators, functioning either as coactivators or corepressors.( 28 ) One of the coactivators for AR is AKT. The PI3‐K/Akt pathway is constitutively active in LNCaP cells because of the loss of PTEN expression, and PI3‐K/AKT has been shown to activate AR signaling.( 19 , 29 ) NFV inhibited AKT activity in LNCaP cells (Fig. 6). In addition, the present study found that LY294002, the inhibitor of PI3‐K, downregulated levels of PSA, AR‐driven gene in LNCaP cells in association with a blockade of AKT signaling (Fig. 7a). Taken together, the inhibition of AKT signaling in LNCaP cells probably contributes to the PI‐mediated blockade of AR signaling.
STAT3 also functions as coactivator for AR signaling. Forced expression of STAT3 increased AR transcriptional activity in CV‐1 cells.( 30 ) STAT3 signaling was activated in LNCaP cells, and PI inhibited both basal and IL‐6‐stimulated STAT3 activity in these cells (Fig. 5). The exposure of LNCaP cells to the JAK2 inhibitor AG490 downregulated levels of PSA in conjunction with inhibition of STAT3 DNA binding activity in these cells (Fig. 7a,b). We therefore consider that inhibition of STAT3 may contribute to the blockade of AR signaling mediated by PI in LNCaP cells.
The PI increased levels of p27 kip 1 in LNCaP cells (Fig. 2a). The level of p27 kip 1 is regulated by the PTEN/PI3‐K/AKT signal pathway by two mechanisms: first, PTEN negatively regulates the expression of E3 ligase SCF SKP 2 , which mediates p27 kip 1 ubiquitin‐dependent proteolysis.( 31 ) Another mechanism relates to FKHR, which inhibits p27 kip 1 gene transcription.( 32 ) Inactivation of AKT signaling by PI might contribute to the upregulation of p27 kip 1 by inhibiting the degradation of p27 kip 1 protein as well as the stimulation of p27 kip 1 gene transcription, resulting in growth arrest of prostate cancer cells.
Androgen‐independent prostate cancer cells initially respond to conventional chemotherapy; however, they eventually acquire drug resistance and no longer respond to anticancer drugs. The mechanisms of drug resistance include overexpression of P‐glycoprotein (P‐gp), which pumps drugs out of the cells, resulting in decreased intracellular concentrations of the drugs.( 33 ) Another explanation of drug resistance relates to cytochrome p 450 3A4 (CYP 3A4), which is associated with the metabolism of chemotherapeutic agents. Xenobiotics, including anticancer drugs such as doxorubicin, promote nuclear translocation of pregnane X receptor (PXR), which binds to the promoter of CYP 3A4 and activates its expression, resulting in detoxification of drugs.( 34 ) Previous studies have shown that RTV inhibits the activities of both P‐gp and CYP 3A4.( 35 , 36 , 37 ) Co‐administration of docetaxel and RTV increased the plasma levels of docetaxel by 50‐fold in mice as compared with those who received docetaxel alone.( 37 ) We have recently shown that RTV blocks the docetaxel‐induced expression of CYP3A4 transcripts in DU145 cells and enhances the antitumor effect of docetaxel against these cells in vitro and in vivo. ( 38 ) Furthermore, recent studies have shown that activation of both STAT3 and AKT also contributed to drug resistance in cancer cells.( 39 , 40 ) These studies showed that inhibition of STAT3 using JAK2 inhibitor AG490 sensitizes malignant lymphoma and multiple myeloma cells to chemotherapeutic drugs including cisplatin, fludarabine, and doxorubicin.( 39 ) Disruption of AKT signaling by the mTOR inhibitor rapamycin reversed chemoresistance in murine lymphoma cells in vivo. ( 40 )
In summary, we have found that PI induces the growth arrest and apoptosis of both androgen‐dependent and ‐independent prostate cancer cells in conjunction with a blockade of AR, STAT3, and AKT signaling. Disruption of STAT3 and AKT signaling might contribute to growth inhibition as well as to the blockade of AR signaling mediated by PI in prostate cancer cells. Furthermore, levels of AR are markedly reduced in prostate cancer cells by PI and an elevated expression of AR has been associated with androgen‐independent growth.( 41 ) PI could be useful as adjunctive therapeutic agents for individuals with prostate cancer as well as other types of cancer in which hormones, activated STAT3 and/or AKT play a role.
Acknowledgments
This work was supported in part by a Grant‐in‐Aid from the Ministry of Education, Culture, Sports, Science, and Technology of Japan. H.P.K. is supported by National Institutes of Health grants as well as the Aaron Eschman Fund.
References
- 1. Quigley CA, DeBellis A, Marschke KB, El‐Awady MK, Wilson EM, French FS. Androgen receptor defects: historical, clinical, and molecular perspectives. Endocr Rev 1995; 16: 271–321. [DOI] [PubMed] [Google Scholar]
- 2. Gelmann EP. Molecular biology of the androgen receptor. J Clin Oncol 2002; 20: 3001–15. [DOI] [PubMed] [Google Scholar]
- 3. Polascik TJ, Oesterling JE, Partin AW. Prostate specific antigen. A decade of discovery: what we have learned and where we are going. J Urol 1999; 162: 293–306. [DOI] [PubMed] [Google Scholar]
- 4. Pang S, Dannull J, Kaboo R et al. Identification of a positive regulatory element responsible for tissue‐specific expression of prostate‐specific antigen. Cancer Res 1997; 57: 495–9. [PubMed] [Google Scholar]
- 5. Huang W, Shostak Y, Tarr P, Sawyers C, Carey M. Cooperative assembly of androgen receptor into a nucleoprotein complex that regulates the prostate‐specific antigen enhancer. J Biol Chem 1999; 274: 25 756–68. [DOI] [PubMed] [Google Scholar]
- 6. Schuur ER, Henderson GA, Kmetec LA, Miller JD, Lamparski HG, Henderson DR. Prostate‐specific antigen expression is regulated by an upstream enhancer. J Biol Chem 1996; 271: 7043–51. [DOI] [PubMed] [Google Scholar]
- 7. Jove R, Yu H. The STATs of cancer: New molecular targets come of age. Nat Med 2004; 10: 97–105. [DOI] [PubMed] [Google Scholar]
- 8. Buettner R, Mora LB, Jove R. Activated STAT signaling in human tumors provides novel molecular targets for therapeutic intervention. Clin Cancer Res 2002; 8: 945–54. [PubMed] [Google Scholar]
- 9. Barton BE, Karras JG, Murphy TF, Barton A, Huang HF. Signal transducer and activator of transcription 3 (STAT3) activation in prostate cancer: Direct STAT3 inhibition induces apoptosis in prostate cancer lines. Mol Cancer Ther 2004; 3: 11–20. [PubMed] [Google Scholar]
- 10. Mora LB, Buettner R, Seigne J et al. Constitutive activation of Stat3 in human prostate tumors and cell lines: direct inhibition of Stat3 signaling induces apoptosis of prostate cancer cells. Cancer Res 2002; 62: 6659–66. [PubMed] [Google Scholar]
- 11. Takemoto S, Mulloy JC, Cereseto A et al. Proliferation of adult T cell leukemia/lymphoma cells is associated with the constitutive activation of JAK/STAT proteins. Proc Natl Acad Sci USA 1997; 94: 13 897–902. [DOI] [PMC free article] [PubMed] [Google Scholar]
- 12. Franke TF, Kaplan DR, Cantley LC. PI3K: downstream AKTion blocks apoptosis. Cell 1997; 88: 435–7. [DOI] [PubMed] [Google Scholar]
- 13. Cardone MH, Roy N, Stennicke HR et al. Regulation of cell death protease caspase‐9 by phosphorylation. Science 1998; 282: 1318–21. [DOI] [PubMed] [Google Scholar]
- 14. Brunet A, Bonni A, Zigmond MJ et al. Akt promotes cell survival by phosphorylating and inhibiting a Forkhead transcription factor. Cell 1999; 96: 857–68. [DOI] [PubMed] [Google Scholar]
- 15. Wang Q, Wang X, Hernandez A, Hellmich MR, Gatalica Z, Evers BM. Regulation of TRAIL expression by the phosphatidylinositol 3‐kinase/Akt/GSK‐3 pathway in human colon cancer cells. J Biol Chem 2002; 277: 36 602–10. [DOI] [PubMed] [Google Scholar]
- 16. Davies MA, Kim SJ, Parikh NU, Dong Z, Bucana CD, Gallick GE. Adenoviral‐mediated expression of MMAC/PTEN inhibits proliferation and metastasis of human prostate cancer cells. Clin Cancer Res 2002; 8: 1904–14. [PubMed] [Google Scholar]
- 17. Steck PA, Pershouse MA, Jasser SA et al. Identification of a candidate tumor suppressor gene, MMAC1, at chromosome 10q23.3 that is mutated in multiple advanced cancers. Nat Genet 1997; 15: 356–62. [DOI] [PubMed] [Google Scholar]
- 18. Li J, Yen C, Liaw D et al. PTEN, a putative protein tyrosine phosphatase gene mutated in human brain, breast, and prostate cancer. Science 1997; 275: 1943–7. [DOI] [PubMed] [Google Scholar]
- 19. Wu X, Senechal K, Neshat MS, Whang YE, Sawyers CL. The PTEN/MMAC1 tumor suppressor phosphatase functions as a negative regulator of the phosphoinositide 3‐kinase/Akt pathway. Proc Natl Acad Sci USA 1998; 95: 15 587–91. [DOI] [PMC free article] [PubMed] [Google Scholar]
- 20. Ikezoe T, Daar ES, Hisatake J, Taguchi H, Koeffler HP. HIV‐1 protease inhibitors decrease proliferation and induce differentiation of human myelocytic leukemia cells. Blood 2000; 96: 3553–9. [PubMed] [Google Scholar]
- 21. Pati S, Pelser CB, Dufraine J, Bryant JL, Reitz MS Jr, Weichold FF. Antitumorigenic effects of HIV protease inhibitor ritonavir: inhibition of Kaposi sarcoma. Blood 2002; 99: 3771–9. [DOI] [PubMed] [Google Scholar]
- 22. Sgadari C, Barillari G, Toschi E et al. HIV protease inhibitors are potent anti‐angiogenic molecules and promote regression of Kaposi sarcoma. Nat Med 2002; 8: 225–32. [DOI] [PubMed] [Google Scholar]
- 23. Pajonk F, Himmelsbach J, Riess K, Sommer A, McBride WH. The human immunodeficiency virus (HIV)‐1 protease inhibitor saquinavir inhibits proteasome function and causes apoptosis and radiosensitization in non‐HIV‐associated human cancer cells. Cancer Res 2002; 62: 5230–5. [PubMed] [Google Scholar]
- 24. Ikezoe T, Yang Y, Saito T, Koeffler HP, Taguchi H. Proteasome inhibitor PS‐341 down‐regulates level of PSA and induces growth arrest and apoptosis of androgen‐dependent human prostate cancer LNCaP cells. Cancer Sci 2004; 95: 271–5. [DOI] [PMC free article] [PubMed] [Google Scholar]
- 25. Hisatake J, Ikezoe T, Carey M, Holden S, Tomoyasu S, Koeffler HP. Down‐regulation of prostate‐specific antigen expression by ligands for peroxisome proliferator‐activated receptor gamma in human prostate cancer. Cancer Res 2000; 60: 5494–8. [PubMed] [Google Scholar]
- 26. Ikezoe T, Saito T, Bandobashi K, Yang Y, Koeffler HP, Taguchi H. HIV‐1 Protease inhibitor induces growth arrest and apoptosis of human multiple myeloma cells via inactivation of STAT 3 and ERK1/2. Mol Cancer Ther 2004; 3: 473–9. [PubMed] [Google Scholar]
- 27. Suh J, Payvandi F, Edelstein LC, Amenta PS, Zong WX, Gelinas C, Rabson AB. Mechanisms of constitutive NF‐kappaB activation in human prostate cancer cells. Prostate 2002; 52: 183–200. [DOI] [PubMed] [Google Scholar]
- 28. Chatterjee B. The role of the androgen receptor in the development of prostatic hyperplasia and prostate cancer. Mol Cell Biochem 2003; 253: 89–101. [DOI] [PubMed] [Google Scholar]
- 29. Li P, Nicosia SV, Bai W. Antagonism between PTEN/MMAC1/TEP‐1 and androgen receptor in growth and apoptosis of prostatic cancer cells. J Biol Chem 2001; 276: 20 444–50. [DOI] [PubMed] [Google Scholar]
- 30. De Miguel F, Lee SO, Onate SA, Gao AC. Stat3 enhances transactivation of steroid hormone receptors. Nucl Recept 2003; 1: 3–11. [DOI] [PMC free article] [PubMed] [Google Scholar]
- 31. Mamillapalli R, Gavrilova N, Mihaylova VT et al. PTEN regulates the ubiquitin‐dependent degradation of the CDK inhibitor p27 (KIP 1) through the ubiquitin E3 ligase SCF (SKP 2). Curr Biol 2001; 11: 263–7. [DOI] [PubMed] [Google Scholar]
- 32. Medema RH, Kops GJ, Bos JL, Burgering BM. AFX‐like Forkhead transcription factors mediate cell cycle regulation by Ras and PKB through p27kip 1. Nature 2000; 404: 782–7. [DOI] [PubMed] [Google Scholar]
- 33. Schwarzenbach H. Expression of MDR1/P‐glycoprotein, the multidrug resistance protein MRP, and the lung‐resistance protein LRP in multiple myeloma. Med Oncol 2002; 19: 87–104. [DOI] [PubMed] [Google Scholar]
- 34. Xie W, Barwick JL, Downes M et al. Humanized xenobiotic response in mice expressing nuclear receptor SXR. Nature 2000; 406: 435–9. [DOI] [PubMed] [Google Scholar]
- 35. Olson DP, Scadden DT, D’Aquila RT, De Pasquale MP. The protease inhibitor ritonavir inhibits the functional activity of the multidrug resistance related‐protein 1 (MRP‐1). AIDS 2002; 16: 1743–7. [DOI] [PubMed] [Google Scholar]
- 36. Kumar GN, Rodrigues AD, Buko AM, Denissen JF. Cytochrome P450‐mediated metabolism of the HIV‐1 protease inhibitor ritonavir (ABT‐538) in human liver microsomes. J Pharmacol Exp Ther 1996; 277: 423–31. [PubMed] [Google Scholar]
- 37. Royer I, Monsarrat B, Sonnier M, Wright M, Cresteil T. Metabolism of docetaxel by human cytochromes P450: interactions with paclitaxel and other antineoplastic drugs. Cancer Res 1996; 56: 58–65. [PubMed] [Google Scholar]
- 38. Ikezoe T, Hisatake Y, Said JW, Taguchi H, Koeffler HP. HIV‐1 Protease inhibitor, ritonavir: A potent inhibitor of CYP 3A4, enhanced the anticancer effects of docetaxel in androgen‐independent prostate cancer cells in vitro and in vivo . Cancer Res 2004; 64: 7426–31. [DOI] [PubMed] [Google Scholar]
- 39. Alas S, Bonavida B. Inhibition of constitutive STAT3 activity sensitizes resistant non‐Hodgkin's lymphoma and multiple myeloma to chemotherapeutic drug‐mediated apoptosis. Clin Cancer Res 2003; 9: 316–26. [PubMed] [Google Scholar]
- 40. Wendel HG, De Stanchina E, Fridman JS et al. Survival signalling by Akt and eIF4E in oncogenesis and cancer therapy. Nature 2004; 428: 332–7. [DOI] [PubMed] [Google Scholar]
- 41. Chen CD, Welsbie DS, Tran C et al. Molecular determinants of resistance to antiandrogen therapy. Nat Med 2004; 10: 33–9. [DOI] [PubMed] [Google Scholar]