

Abstract
Directed movement of normal cells occurs when actin‐related protein 2 and 3 complex (Arp2/3 complex) triggers the actin polymerization that forms lamellipodia immediately after binding to WAVE2. In order to determine whether the same mechanism correlates with liver metastasis from colorectal cancer, paired mirror sections of 154 cancer specimens (29 cases with liver metastasis and 125 cases without liver metastasis in which T factor, gender, primary tumor site, and age at operation were matched) were examined immunohistochemically for the localization of Arp2 and WAVE2. Expression of both Arp2 and WAVE2 was detected in the same cancer cells in 55 (35.7%) of the 154 cases, but not detected in the normal colonic epithelial cells. Univariate analysis showed that the colocalization was significantly predictive of liver metastasis (risk ratio [RR] 8.760. Likewise, histological grade (RR 2.46), lymphatic invasion (RR 9.95), and tumor budding (RR 4.00) were significant predictors. Among these, colocalization and lymphatic invasion were shown to be independent risk factors by multivariate analysis. Another 59 colorectal specimens were examined for mRNA expression of Arp2 by real time polymerase chain reaction. High mRNA levels of Arp2, that in situ hybridization revealed to be expressed by the cancer cells, were significantly associated with liver metastasis. However, its effect was absorbed by the influence of risk of the colocalization that is closely related to high expression of Arp2. These results indicate that the colocalization of Arp2 and WAVE2 is an independent risk factor for liver metastasis of colorectal carcinoma. (Cancer Sci 2007; 98: 992–999)
Actin filaments are the dominant structural components of lamellipodia, and actin is the most abundant protein in many eukaryotic cells. Regulation of lamellipodium formation is essential for embryonic development, wound healing, immune responses, and tissue development.( 1 , 2 , 3 , 4 ) Since the discovery of the Arp2/3 complex about a decade ago, a broad range of biochemical and cell‐biological studies have pointed to its pivotal role as a regulator of actin filament formation.( 5 , 6 , 7 )
One of the hallmarks of cancer cells is penetration into adjacent tissue, or invasion. While the majority of colorectal cancer cells form irregular ductal structures, highly metastatic colorectal cancer cells are frequently dissociated or dedifferentiated at the invasive front. This feature is called budding formation, indicating reduction of cell–cell adhesion. At the same time, cancer cells extend cell protrusions that are driven by actin polymerization at the leading edge, and thus co‐ordinated inactivation of cell–cell adhesion and actin polymerization is required for active invasion and metastasis of colorectal cancer cells. It is possible that the Arp2/3 complex is one of the coordinators of both events in the downstream of cellular signaling, not only in normal cells but also in cancer cells.
The formation of cadherin‐mediated cell junctions is accompanied by profound remodeling of the actin cytoskeleton. The Arp2/3 complex is involved in the regulation of cadherin‐mediated cell–cell adhesion,( 8 , 9 , 10 , 11 ) and is also linked to the proteins of the integrin family in various ways.( 12 , 13 , 14 ) The composition of a large member of the integrin family proteins, and each of the members of the family appears to partly determine the specific reaction of each cell type to stimulation by the extracellular matrix. In a previous study of a human monocyte cell line (THP‐1), we demonstrated that the Arp2/3 complex regulates integrin β‐1‐mediated attachment to fibronectin during chemotaxis induced by monocyte/macrophage chemoattractant protein 1 (MCP)‐1 by binding to the Wiskott–Aldrich syndrome protein (WASP).( 14 )
Although many proteins are capable of regulating the function of the Arp2/3 complex in vitro, the members of the WASP/Scar/WASP family verprolin‐homologous protein (WAVE) appear to be the most important.( 15 , 16 , 17 ) The yeasts Saccharomyces cerevisiae and Schizosaccharomyces pombe contain only one WASP/Scar protein, whereas Dictyostelium, Caenorhabditis elegans, and Drosophila melanogaster possess one WASP and one WASP/Scar protein.( 2 , 18 ) Multicellular animals possess five WASP family proteins: WASP, N‐WASP, and WAVE1–3 which are identical to Scar1–3. These proteins have a common C‐terminal verprolin‐homology domain that is responsible for Arp2/3 complex activation as well as for cell adhesion.( 14 , 19 , 20 , 21 )
Scar and WASP have clearly distinct functions in Drosophila. Scar, but not WASP, is indispensable for cytoplasmic organization in the blastoderm, axon development in the central nervous system, egg chamber structure, and adult eye morphology.( 22 ) In mammals, the system may be more complicated, since WAVE1, WAVE2, WASP, and N‐WASP appear to have specific functions during mammalian development that cannot be compensated by other family members.( 23 , 24 )
One of the five WASP family proteins, WAVE2, is essential for lamellipodial formation in directed migration, at least in mouse embryonic fibroblasts and endothelial cells.( 25 , 26 ) In the present study we focused on the localization of Arp2 and WAVE2 in human colorectal cancer, since we have already reported that the Arp2/3 complex is involved in carcinogenesis.( 27 ) We examined the localization of Arp2 and WAVE2 in colorectal cancer cells immunohistochemically, and the biological significance of their localization was assessed by correlation with clinical data, particularly in relation to liver metastasis.
Materials and Methods
Tissue specimens. The material in this analysis was selected from 478 colorectal cancers resected at Tokyo Medical University Hospital between 1987 and 2000. There were 29 cases of colorectal cancers in which tissue blocks of the metastatic adenocarcinoma to the liver and the primary cancer were both available. These 29 patients were all Japanese (21 men, eight women), aged between 38 and 77 years (median age 60 years). Seven liver metastases were synchronous and the other 22 were metachronous. The mean period from the operation to the development of metastasis of these 22 cases was 17.3 months (from three to 71 months). The site of the primary tumor was as follows: rectum, 10; sigmoid colon, eight; ascending colon, six; transverse colon, three; cecum, two. For each of these cases, three or four control cases were selected. Each control case had no lymph node or liver metastasis, and T factor, gender, primary tumor site (rectum or colon), and age at operation (±5 years) were matched to those cases with liver metastasis. A total of 154 cases (mean follow‐up period, 125 months) were selected for the examination of the association between the colocalization of Arp2 and WAVE2 and liver metastasis.
The archived blocks of formalin‐fixed, paraffin‐embedded tissue from these cases were retrieved from the Department of Diagnostic Pathology. Two or three representative blocks of the primary site and one metastatic site were selected for immunohistochemical analysis of Arp2 and WAVE2.
In order to examine the mRNA expression of Arp2, samples of cancerous tissue and non‐cancerous mucosal tissue, each measuring about 3 × 3 × 2 mm were carefully collected by trained pathologists from the surgical specimen in each case obtained from 59 cases of colorectal carcinoma, treated between 1999 and 2003 at Hachioji Medical Center, Tokyo Medical University. Each tissue sample was divided into two parts. One part was frozen immediately at –80°C for RNA and protein extraction. The other part was fixed with 4% paraformaldehyde for about 24 h and embedded in paraffin for immunohistochemical assessment of Arp2/3 complex and WAVE2 and hematoxylin and eosin staining. The presence of both cancerous and non‐cancerous tissue from each case was confirmed by microscopic examination.
Depth of invasion was assessed and histological grading of the primary tumor was carried out according to a system based on the TNM classification of malignant tumors.( 28 ) The largest cross‐sectional plane showing the deepest tumor invasion was examined for vascular or lymphatic invasion. Tumor budding was defined as an isolated single cancer cell or a cluster composed of fewer than five cancer cells.( 29 ) Growth pattern at the invading front was classified according to the pattern of tumor infiltration (INF)a: expanding growth; INFb: intermediate growth between INFa and INFc; and INFc: irregular growth. Signed informed consent for the use of their specimens was obtained from all of the patients in accordance with the institutional guidelines.
Immunohistochemical staining of Arp2 and WAVE2. Paired serial 4‐µm‐thick sections were cut from each block for the immunohistochemical localization of Arp2 and WAVE2. To examine identical cut surfaces of the sections the first serial section was placed with its newly cut surface upward on the silane‐coated glass slides and the second was placed on the slide in the usual position to provide paired ‘mirror’ sections. Deparaffinized sections were subjected to heat‐induced antigen retrieval as follows. The sections were heated in 1 mM ethylenediaminetetraacetic acid (EDTA) (pH 8.0) for 10 min at 110°C in a conventional pressure sterilizer (ALP KT‐2322; Alp Industry, Tokyo, Japan). After cooling, one section was incubated overnight with an anti‐Arp2 goat polyclonal antibody (K‐15, Santa Cruz Biotechnology, Santa Cruz, CA, USA) diluted to 1:50, and the other with an anti‐WAVE2 polyclonal antibody (a generous gift from Dr Tadaomi Takenawa, Department of Biochemistry, Institute of Medical Science, University of Tokyo. Polyclonal anti‐WAVE2 antibody was prepared in goat immunized with the basic region of human WAVE2 [amino acids 180–241] expressed in Escherichia coli) diluted to 1:50. The primary antibodies bound to the antigens were detected by using a Histofine Simple Stain MAX‐PO kit (Nichirei, Tokyo, Japan) according to the manufacturer's instruction manual. Hematoxylin was used for counterstaining. If more than 5% of cancer cells expressed both Arp2 and WAVE2 in their cytoplasm, Arp2 and WAVE2 were judged to be coexpressed by the tumor.
Cell culture. A human colon cancer cell line derived from a primary cancer (SW480; American Type Culture Collection (ATCC, Manassas, VA, USA) and from a lymph node metastasis of the same cancer (SW620; ATCC) were grown in RPMI 1640 (Life Technologies, Rockville, MD, USA) supplemented with 10% fetal bovine serum (FBS) and one unit of a penicillin–streptomycin mixture (Life Technologies).( 30 )
Visualization of Arp2, Arp3, and WAVE2 colocalization and actin filaments. Human cancer cells (SW480 and SW620) were cultured on several slide glasses. Cancer cells were fixed in 4% paraformaldehyde for 10 min, then treated with 0.1% Triton X‐100 in phosphate‐buffered saline (PBS) for 5 min. The fixed cells were stained for WAVE2 and the Arp2/3 complex by indirect immunofluorescence and for actin filaments by rhodamine‐conjugated phalloidin. First, a mixture of the anti‐Arp2 goat polyclonal antibody used for immunohistochemistry diluted to 1:50 and an anti‐Arp3 mouse monoclonal antibody (clone 4, Becton Dickinson, Franklin Lakes, NJ, USA) at a dilution of 1:1000 were prepared for double staining of Arp2 and Arp3 in order to confirm the complex formation of Ar2 and Arp3. The specimen was incubated in the mixture of primary antibodies for 60 min. After rinsing three times, a secondary antibody (Alexa Fluor 488 conjugated antimouse immunoglobulin [Molecular Probes, Eugene, OR, USA]) was reacted, and after a brief rinsing Alexa Fluor 568 conjugated antigoat immunoglobulin (Molecular Probes) was reacted for 60 min, respectively. Next, a mixture of the anti‐WAVE2 goat polyclonal antibody used for immunohistochemistry at a dilution of 1:50 and an anti‐Arp3 mouse monoclonal antibody (clone 4, BD) at a dilution of 1:1000 reacted with other slide glasses on which cancer cells were fixed. The specimens were reacted with first and secondary antibodies and rinsed as described above, and Rhodamine‐conjugated phalloidin (Molecular Probes) was incubated for 20 min. Images were taken with a confocal laser scanning microscope (Radiance µ2000; Bio‐Rad, Hemel Hempstead, UK).
Western blot analysis. Approximately 1 × 10⁶ cultured cells were suspended in 1 mL of lysis buffer comprising 1% Nonidet P‐40 alternative, 150 mM NaCl, 10 mM Tris‐HCl (pH 8.0), 2 mM sodium orthovanadate, 10 µg/mL leupeptin, 50 mM NaF, 5 mM EDTA, 1 mM ethylene glycolbis‐tetra‐acetic acid (EGTA), 1 mM phenylmethylsulfonyl fluoride, and 30 µg/mL aprotinin. The cells were then sonicated for 15 s and centrifuged at 10 000 g for 10 min. The soluble fractions were subjected to sodium dodecyl sulfate‐polyacrylamide gel electrophoresis (SDS‐PAGE). Western blot analysis was carried out as described previously.( 31 ) A goat polyclonal anti‐Arp2 antibody and the anti‐WAVE2 goat polyclonal antibody used for immunohistochemistry were used as probes. Actin was used as a quantitative control. These procedures were repeated three times.
Quantitative real‐time polymerase chain reaction. First‐strand cDNA was synthesized from 1 µg of total RNA with oligo‐dT primer (Promega, Madison, WI, USA) and M‐MLV® reverse transcriptase (Invitrogen, Carlsbad, CA, USA). Real‐time polymerase chain reaction (PCR) analysis was carried out using the Mx3005P QPCR system (Stratagene, La Jolla, CA, USA) with TaKaRa Ex Taq R‐PCR ver. 2.1 (TaKaRa Bio, Otsu, Japan), ROX Reference Dye (Stratagene) and SYBR® Green I (Cambrex, Washington, DC, USA). We used Arp2‐specific primers 5′‐CCACCTAGTGTGCTAAAGACTACG‐3′ and 5′‐TCAACTCCAGGACATGGAAG‐3′, Arp3‐specific primers 5′‐TAATAAAAGCAAAGTGCAGAAC‐3′ and 5′‐TTCAAACAGTACCCAAAGAGTAG‐3′, WAVE2‐specific primers 5′‐CTTTCAGCCATCCGTCAAGG‐3′ and 5′‐AATCGGACCAGTCGTCCTCA‐3′, and β‐actin‐specific primers 5′‐GGGAAATCGTGCGTGACATTAAG‐3′ and 5′‐TGTGTTGGCGTACAGGTCTTTG‐3′. Reaction mixtures were denatured at 95°C for 30 s and then were subjected to 50 PCR cycles at 95°C for 10 s and 60°C for 30 s. Arp2, Arp3 and WAVE2 mRNA levels were normalized to β‐actin signals.( 32 ) We carried out the experiments to determine mRNA levels in duplicate.
In situ hybridization. The probe of in situ hybridization was derived from the 664~1164 bases of Arp2 mRNA amplified from the total RNA of the human colon cancer cell line (SW837) by an in vitro transcription method.( 33 ) The 501 bp‐product with T7 RNA promoter was obtained by reverse transcription followed by PCR following Arp2‐specific primers 5′‐TTC TGT TGC GAG GAT ACG CCT‐3′ and 5′‐CTTAATACGACTCACTATAGGGTAT CCGCTAGAACTGCACCACC‐3′. The PCR product was labeled by digoxigenin using DIG RNA Labeling Kit (Roche Diagnostics, Auckland, New Zealand). Tyramide‐based in situ hybridization was carried out according to the method described by Suzuki et al.( 34 )
Statistical analysis. The relationship between the patients’ clinicopathological features and colocalization of Arp2 and WAVE2 was analyzed by the χ2 test. The difference in the mean expression level of normalized Arp2 mRNA between colocalization‐positive and colocalization‐negative cancers was analyzed by the Student's t‐test. Conditional logistic regression analysis was used to assess the relationship between each risk factor and liver metastasis adjusted for the possible confounding effect of all other factors included in the same model. A P‐value less than 0.05 was considered to indicate a statistically significant difference. All calculations were carried out using the SAS statistical software package (SAS Institute, Cary, NC, USA).
Results
Immunohistochemistry. Arp2 and WAVE2 were expressed in the cytoplasm of colorectal cancer cells. The serial mirror sections stained immunohistochemically for Arp2 and WAVE2 indicated that both proteins were expressed in the same cancer cells. Colocalization was detected in 55 (35.7%) of the 154 cancer specimens. Cancer cells expressing both Arp2 and WAVE2 were scattered throughout the cancer tissue and frequently appeared at the invasive front, where budding processes are formed (Fig. 1a,b). In most cases judged positive for the colocalization, the number of cancer cells expressing both Arp2 and WAVE2 were no more than 10% of all cancer cells. Arp2 or WAVE2 was expressed in different cells among the non‐cancerous epithelial cells and none of them clearly coexpressed both. Epithelial cells maintaining normal structure were rarely stained for either Arp2 or WAVE2, and if so very weakly. A few epithelial cells that showed atypia sometimes coexpress weakly. Small numbers of the stromal cells adjacent to cancer cells showed equivocal coexpression in which the intensity of Arp2 and WAVE2 staining was lower than that of cancer cells. In the normal cells, only macrophages showed distinct colocalization of Arp2 and WAVE2. A small number of endothelial cells and inflammatory cells had equivocal staining of Arp2 and/or WAVE2.
Figure 1.
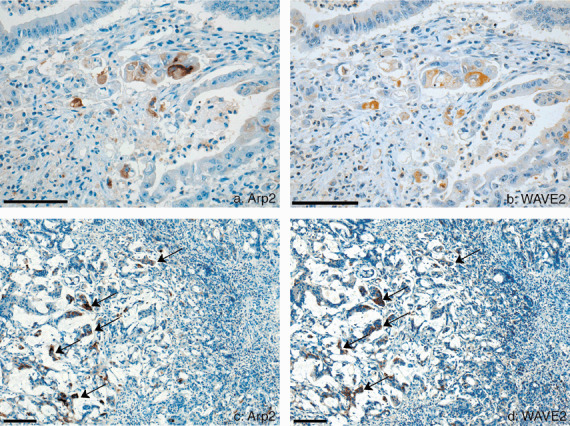
Colocalization of actin‐related protein 2 (Arp2) and WAVE2 in the cancer cells of colon carcinoma in the margin of invasion and in the metastatic site of the liver. (a) Arp2 was detected in cancer cells where budding formation was seen in the margin of invasion of the colon cancer. Bar, 250 m. (b) Digital mirror image was reconditioned to the same image of (a) by the use of computer software. WAVE2 was expressed in the same cancer cells in which Arp2 was detected in A. Bar, 250 m. (c) Arp2 was detected in the metastatic colon cancer cells in the liver of the case that showed no colocalization at the primary site. Bar, 500 m. (d) Digital mirror image was reconditioned to the same image of (c). WAVE2 is detected in the same cancer cells seen to express Arp2 in (c). Bar, 500 m.
Clinicopathological significance of colocalization of Arp2 and WAVE2. Of 55 patients with colocalization, 22 (40.0%) patients had liver metastasis, but only seven (7.1%) of 99 patients with no colocalization had metastatic disease. Univariate conditional logistic regression analysis showed that the risk ratio (RR) for liver metastasis was 8.76 times higher in colorectal cancers with colocalization‐positive than those without (Table 1). Lymphatic invasion (RR 9.95), tumor budding (RR 4.00), and histological grade (RR 2.46) other than blood vessel invasion or INF were also predictors of liver metastasis. We carried out multivariate conditional logistic regression analysis using factors that had significant correlation with liver metastasis by univariate analysis. The analysis clearly demonstrated that colocalization and lymphatic invasion were significant variables for predicting liver metastasis among these predictors (Table 2). In 29 cases with liver metastasis, 22 (75.9%) cancer tissues showed colocalization. All of the other seven cases with liver metastasis in which the primary sites were judged not to have colocalization showed colocalization in the metastatic carcinoma of the liver specimens (Fig. 1c,d).
Table 1.
Risk factors in univariate analysis with respect to liver metastasis
| Score | Cases (n = 154) | Liver metastasis (%) (n = 29) | Risk ratio (95% confidence interval) | |
|---|---|---|---|---|
| Histological grade | ||||
| G1 | 110 | 16 (14.5) | ||
| G2 | 44 | 13 (29.5) | 2.46 (1.06–5.68) | |
| Lymphatic invasion | ||||
| (–) | 102 | 7 (6.9) | ||
| (+) | 52 | 22 (42.3) | 9.95 (3.87–25.59) | |
| Blood vessel invasion | ||||
| (–) | 39 | 6 (15.4) | ||
| (+) | 115 | 23 (20.0) | 0.73 (0.27–1.94) | |
| INF | ||||
| a | 24 | 2 (8.3) | ||
| b | 127 | 26 (20.5) | 2.83 (0.62–12.82) | |
| c | 3 | 1 (33.3) | ||
| Tumor budding | ||||
| (–) | 77 | 7 (9.1) | ||
| (+) | 77 | 22 (28.6) | 4.00 (1.59–10.01) | |
| Colocalization | ||||
| (–) | 99 | 7 (7.1) | ||
| (+) | 55 | 22 (40.0) | 8.76 (3.43–22.41) | |
INF, pattern of tumor infiltration.
Table 2.
Multivariate conditional logistic regression analysis for prediction of liver metastasis
| Factor | Univariat P‐value | Multivariate Hazard rate | P‐value |
|---|---|---|---|
| Tumor budding, positive versus negative | 0.0034 | ||
| Lymphatic invasion, positive versus negative | < 0.0001 | 11.642 | <0.0001 |
| Histological grade, G1 versus G2 | 0.0405 | ||
| Colocalization, positive versus negative | < 0.0001 | 9.003 | 0.0002 |
Table 3 shows the relationship between Arp2 and WAVE2 colocalization and clinicopathological factors. The cancer cells in the budding area frequently showed colocalization, and colocalization was strongly associated with the presence of budding formation (P < 0.0001). Of the 110 well‐differentiated adenocarcinomas (G1), 29 (26.4%) were found to coexpress Arp2 and WAVE2, and colocalization was observed in 26 (59.1%) of the 44 moderately‐differentiated adenocarcinomas (G2). In the well‐differentiated carcinomas, a few cancer cells exhibiting colocalization were seen in the areas where duct formation was distinct, but they were frequently observed in the areas of budding formation. Colocalization also correlated with irregular growth at invading font (P = 0.0221).
Table 3.
Relationship between clinicopathologic factors and colocalization
| Cases | Colocalization (%) | P‐value | ||
|---|---|---|---|---|
| Histological grade | ||||
| G1 | 110 | 29 (26.4) | 0.0002 | |
| G2 | 44 | 26 (59.1) | ||
| Lymphatic invasion | ||||
| (–) | 102 | 32 (31.7) | 0.1545 | |
| (+) | 52 | 23 (44.2) | ||
| Blood vessel invasion | ||||
| (–) | 115 | 44 (38.2) | 0.3341 | |
| (+) | 39 | 11 (28.2) | ||
| INF | ||||
| a | 24 | 3 (12.5) | 0.0221 | |
| b | 127 | 52 (39.4) | ||
| c | 3 | 2 (66.7) | ||
| Tumor budding | ||||
| (–) | 77 | 13 (16.9) | <0.0001 | |
| (+) | 77 | 42 (54.5) | ||
INF, pattern of tumor infiltration.
Intracellular localization of WAVE2 and Arp2/3 complex. SW620 cells formed lamellipodia where newly polymerized actin fibers were visualized by phalloidin. Double staining of Arp2 and WAVE2 showed colocalization at the leading edge, and confirmed the complex formation of Arp2 and Arp3 (Fig. 2a–c). Then, triple staining of WAVE2, Arp3, and phalloidin demonstrated colocalization at the leading edge of lamellipodia. Merged image showed blue‐purple staining by the colocalization of Arp2/3 complex, WAVE2, and phalloidin (Fig. 2d–g).
Figure 2.
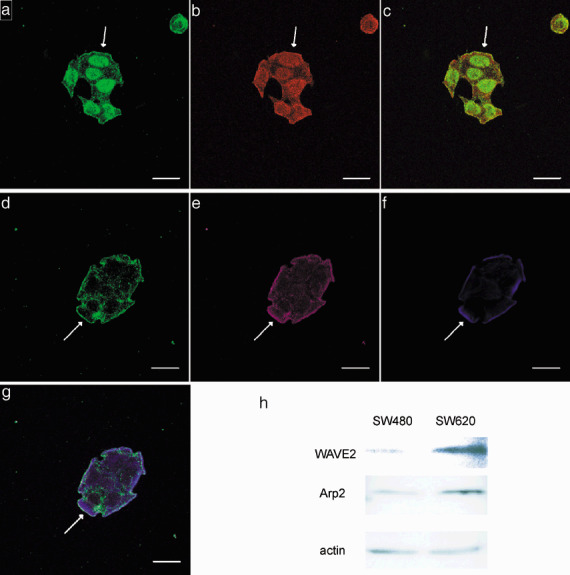
Immunofluorescence, Western blot analysis of actin‐related protein 2 (Arp2) and WAVE2 in colon cancer cell lines SW480 and SW620. Double staining of Arp3 and Arp2 was carried out in SW620 cells. (a) Immunofluorescence staining of Arp3 is shown as green line at the periphery of SW620 cells indicated by arrow. (b) Immunofluorescence staining of Arp2 is shown as red line at the periphery of the cells shown in (a). (c) Merged image of (a) and (b) shows colocalization of Arp3 and Arp2 as a yellow line. Triple staining of Arp3, WAVE2, and phalloidin was carried outin SW620 cells. (d) Immunofluorescence staining of Arp3 is shown as a green line at the periphery of SW620 cells indicated by arrow. (e) Immunofluorescence staining of WAVE2 is shown as a purple line at the periphery of the cells shown in (d). (f) Newly polymerized actin fibers which form lamellipodium were detected by phalloidin (blue staining). (g) Merged image of (d, e, and f) shows colocalization of Arp3, WAVE2 and phalloidin as blue‐purple staining. Bar, 20 m. (h) Expression of Arp2 and WAVE2 on the protein level by the colon cancer cell line derived from the primary site (SW480) and the corresponding cell line derived from the metastatic lymph node (SW620) were compared. WAVE2 expression was detected in both SW480 cells and SW620 cells, but the WAVE2 band detected in the SW620 cells was more distinct than in the SW480 cells. Similar results were obtained for the Arp2 expression.
Western blot analysis of Arp2 and WAVE2. Expression of Arp2 and WAVE2 at the protein level by the colon cancer cell line derived from the primary site (SW480) and by the line derived from the lymph node metastasis of the same cancer (SW620) were compared. WAVE2 expression was detected in both SW480 cells and SW620 cells, but the WAVE2 band detected in SW620 cells was more distinct than the band detected in the SW480 cells (Fig. 2h). Similar results were obtained three times. Arp2 was also expressed in both cell lines. In two of the three determinations the Arp2 band was more distinct in the SW620 cells than in SW480 cells, but hardly any difference in the Arp2 band was detected in the third determination.
Level of Arp2, Arp3, and WAVE, mRNA expression. The percentiles of mRNA level of Arp2, Arp3, and WAVE2 are shown in Figure 3(a–c). These percentiles showed similar distribution patterns and the Arp2 mRNA level significantly correlated with the Arp3 mRNA level (P < 0.0001). The WAVE2 mRNA level also correlated with both Arp2 (P < 0.0001) and Arp3 (P < 0.0001).
Figure 3.
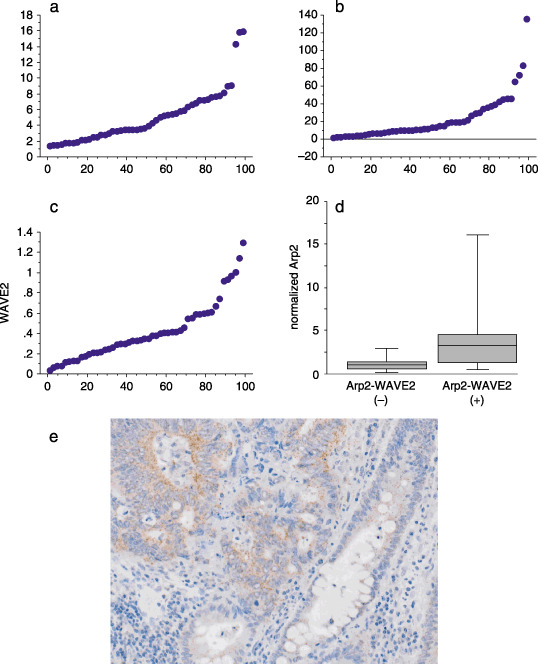
mRNA level expression of actin‐related protein 2 (Arp2), Arp3, and WAVE2. (a) The percentile of mRNA level of Arp2 is shown. (b) The percentile of mRNA level of Arp3 is shown. (c) The percentile of mRNA level of WAVE2 is shown. These plots patterns of percentile are similar. The Arp2 mRNA level significantly correlated with the Arp3 mRNA level (P < 0.0001). The WAVE2 mRNA level also correlated with both Arp2 (P < 0.0001) and Arp3 (P < 0.0001). (d) The average expression of normalized Arp2 at the mRNA level was 1.7 in the 35 colon cancer tissue specimens in which no Arp2 and WAVE2 colocalization was detected immunohistochemically and 5.6 in the 13 colocalization positive‐cancers. There was a significant correlation between high level of Arp2 expression and colocalization (P = 0.027). (e) In situ hybridization of Arp2 in the colon cancer tissue. Colon cancer cells expressed Arp2 stronger than adjacent non‐cancerous epithelial cells.
The average expression normalized Arp2 mRNA level was 1.1 in the 34 cases without liver metastasis. However, it was 6.7 in the 14 cases in which liver metastases were detected. However, the Arp2 mRNA level correlated with liver metastasis (P = 0.008) though its risk value was absorbed by the influence of the risk associated with immunohistochemically detectable colocalization by multivariate analysis. Although the sample size was small in this material, the colocalization remained as a significant risk factor when such clinical factors as pT, pN, and histological grade were included. The average expression normalized Arp2 mRNA level was 1.7 in the 35 cancers without colocalization of Arp2 and WAVE2, as opposed to 5.6 in the 13 cancers in which colocalization was observed (Fig. 3d), and there was a significant correlation between the high level of mRNA Arp2 expression and colocalization (P = 0.027).
When more than 5% of cancer cells that showed intracytoplasmic granular, dotted, or homogenous staining were detected in the immunostaining of Arp2, 16 cases were judged as positive staining. The average mRNA expression of Arp2 in positive cases was 5.4 and 2.5 in 32 negative staining cases, and there was significant correlation between high level mRNA expression of Arp2 and positive immunohistochemical staining (P = 0.039). Similarly, the average mRNA expression of WAVE2 in 21 cases with positive staining was 0.59 and 0.25 in 27 cases with negative staining (P = 0.043).
Figure 3(e) shows in situ hybridization of Arp2 of colocalization‐positive case that the cancer cells expressed Arp2 diffusely in the cancer tissue. The intensity of mRNA expression of Arp2 was stronger in the cancer cells than that in normal epithelial cells. This expression pattern was similar to that of immunostaining in that much more cancer cells were stained for Arp2 than normal epithelial cells. The stromal cells adjacent to the cancer cells and endothelial cells express Arp2 weakly. The intensity of Arp2 mRNA expression between the cases could not be compared because the influence of different fixation time of the blocks could not be excluded.
Discussion
We have shown that the colocalization of Arp2 and WAVE2 is an independent risk factor of liver metastasis. Metastasis is a multistep process by which cancer cells spread to other organs. The first step involves loosening of cell–cell adhesion.( 35 , 36 ) The second step is the formation of lamellipodial protrusions that allows directional cell movement. Arp3 and WAVE2 were colocalized at the advancing margin of a colon cancer cell (SW620) in this study. Because the mechanism of the formation of lamellipodium that Arp2/3 complex is activated by binding with WAVE2 was demonstrated by using non‐cancerous cells,( 37 , 38 ) we think this mechanism is also involved in the second step leading to the liver metastasis of colorectal cancer.
The colocalization of Arp2 and WAVE2 was significantly associated with tumor budding, and indeed, cancer cells forming tumor budding frequently show colocalization of Arp2 and WAVE2 at the margin of invasion. The presence of tumor budding is considered strong evidence of high metastatic potential.( 39 , 40 ) Cancer cells with budding formation have loose cell–cell adhesion. Our data suggest that these cells have the potential to move aggressively.
In our immunohistochemical staining for colon cancer tissue, distinct colocalization of Arp2 and WAVE2 was not detected in normal epithelial cells, though the immunoreaction of either Arp2 or WAVE2 was seen focally. In a previous study,( 27 ) we detected immunoreaction of Arp2 and Arp3 in macrophages, lymphocytes, and endothelial cells. Macrophages were shown to express both Arp2 and WAVE2 in this study. Because these cells are thought to function while migrating in tissues, cells that coexpress Arp2 and WAVE2 may have greater ability to move freely than cells that do not. We think that immunohistochemical colocalization of Arp2 and WAVE2 by cancer cells partly explains their ability to migrate actively.
We carried out a Western blot analysis to determine whether the Arp2 protein level was elevated in the tissue specimens of metastatic cases, and we found no difference in expression level between the cancer tissue of liver metastatic cases and non‐metastatic cases (data not shown). We therefore examined the paired colon cancer cell lines SW480 (derived from the primary site) and SW620 (derived from the metastatic site). But a distinct difference in the expression of either Arp2 or WAVE2 was not detected by Western blot analysis. Though quantification of the protein level was not examined, the result may be due to the fact that no more than 10–20% of cancer cells show colocalization.
The level of expression of Arp2 mRNA was high in cases that coexpressed WAVE2. Another study demonstrated lower mRNA expression of Arp2/3 complex in gastric cancer tissue than in normal gastric mucosa.( 41 ) Poorly‐differentiated cancer cells show almost complete loss of cell–cell adhesion and polarity, and diffusely invade into the surrounding normal tissue. This invasive pattern is likely to be different from that of well‐differentiated carcinoma, which forms a well‐defined mass lesion. Since poorly‐differentiated cancers do not form clear lamellipodial extensions, they may possess other mechanisms of cell movement. However, our results of the level of Arp2 mRNA expression cannot exclude the probability of the influence of the stromal cells because the specimens include abundant stromal cells that can express Arp2 mRNA. Various types of cancer cell lines should be examined for the expression level of Arp2 mRNA.
In the present study of colorectal cancer cells we focused on the Arp2/3 complex and attempted to correlate its presence with clinical features, including metastasis. In colorectal cancer cells with high metastatic potential, the Arp2/3 complex appears to be activated by binding to WAVE2. In well‐differentiated adenocarcinomas, such as the majority of colon cancers, the function of Arp2/3 complex is likely to be maintained or enhanced. As far as we know, no Arp2 or Arp3 gene abnormalities have been reported in cancer, and our own examinations of several human cell lines have failed to reveal any mutations (data not shown). High mRNA expression of WAVE2 may serve to regulate cell movement in colon cancer. A highly metastatic melanoma cell line has been reported to show higher expression of WAVE2, at both the protein and mRNA levels than its parental cell line, and WAVE2 RNAi was found to reduce its metastatic potential.( 42 )
We do not have data that can explain how a high level of Arp2 mRNA is associated with colocalization. We hypothesize that a high Arp2 mRNA level might be the increase of the activated form of WAVE2. The majority of WAVE2 in the cell is complexed with Abl‐interactor‐1 (Abi1), Nck‐associated protein‐1 (Nap1), a small protein HSPC300, and p53‐inducible protein‐121 (PIR121)/Sra1. However, it is not clear how activated WAVE2 interacts with the Arp2/3 complex on the membrane of the lamellipodia. This interaction may be a key to explaining the association between high Arp2 mRNA levels and the colocalization of Arp2 and WAVE2.
The present study demonstrates that the colocalization of Arp2 and WAVE2 is an independent risk factor for liver metastasis in colorectal cancer. The result is considered to be reliable because the function of the interaction of Arp2/3 complex and WAVE2 has been established as the signal to form lamellipodial protrusion to induce cell migration, and because it is associated with tumor budding and irregular invading growth (INF) that are established features of aggressive colorectal cancer. Further studies designed to selectively block the interaction of Arp2 and WAVE2 in cancer cells may yield means of preventing invasion and metastasis.
Acknowledgments
This study was supported in part by a Grant‐in‐Aid for Scientific Research (C) (Kakenhi 15590319). We thank Dr Tadaomi Takenawa, Department of Biochemistry, Institute of Medical Science, University of Tokyo for providing the antibody to WAVE2. We also thank Mayumi Yokotsuka for technical assistance of immunofluorescence imaging, and Rumi Tsujimoto and Masami Tanaka for technical assistance of real time PCR. The authors are indebted to Professor J. Patrick Barron of the International Medical Communications Center of Tokyo Medical University for his review of this manuscript.
References
- 1. Pollard TD, Borisy GG. Cellular motility driven by assembly and disassembly of actin filaments. Cell 2003; 112: 453–65. [DOI] [PubMed] [Google Scholar]
- 2. Sawa M, Suetsugu S, Sugimoto A, Miki H, Yamamoto M, Takenawa T. Essential role of the C. elegans Arp2/3 complex in cell migration during ventral enclosure. J Cell Sci 2003; 116: 1505–18. [DOI] [PubMed] [Google Scholar]
- 3. Magdalena J, Millard TH, Etienne‐Manneville S, Launay S, Warwick HK, Machesky LM. Involvement of the Arp2/3 complex and Scar2 in Golgi Polarity in scratch wound models. Mol Biol Cell 2003; 14: 670–84. [DOI] [PMC free article] [PubMed] [Google Scholar]
- 4. Thrasher AJ. WASp in immune‐system organization and function. Nat Rev Immunol 2002; 2: 635–46. [DOI] [PubMed] [Google Scholar]
- 5. Machesky LM, Atkinson SJ, Ampe C, Vandekerckhove J, Pollard TD. Purification of a cortical complex containing two unconventional actins from Acanthamoeba by affinity chromatography on profiling‐agarose. J Cell Biol 1994; 127: 107–15. [DOI] [PMC free article] [PubMed] [Google Scholar]
- 6. Welch MD, Iwamatsu A, Mitchison TJ. Actin polymerization is induced by Arp2/3 protein complex at the surface of Listeria monocytogenes. Nature 1997; 385: 265–9. [DOI] [PubMed] [Google Scholar]
- 7. Vartiainen MK, Machesky LM. The WASP‐Arp2/3 pathway: genetic insights. Curr Opin Cell Biol 2004; 16: 174–81. [DOI] [PubMed] [Google Scholar]
- 8. Kovacs EM, Goodwin M, Ali RG, Paterson AD, Yap AS. E‐cadherin physically associates with the Arp2/3 complex to direct actin assembly in nascent adhesive contacts. Curr Biol 2002; 12: 379–82. [DOI] [PubMed] [Google Scholar]
- 9. Helwani FM, Kovacs EM, Paterson AD et al. Cortactin is necessary for E‐cadherin‐mediated contact formation and actin reorganization. J Cell Biol 2004; 164: 899–910. [DOI] [PMC free article] [PubMed] [Google Scholar]
- 10. Verma S, Shewan AM, Scott JA et al. Arp2/3 activity is necessary for efficient formation of E‐cadherin adhesive contacts. J Biol Chem 2004; 279: 34 062–70. [DOI] [PubMed] [Google Scholar]
- 11. Bershadsky A. Magic touch: how does cell‐cell adhesion trigger actin assembly? Trends Cell Biol 2004; 14: 589–93. [DOI] [PubMed] [Google Scholar]
- 12. DeMali KA, Wennerbrg K, Burridge K. Integrin signaling to the actin cytoskeleton. Curr Opin Cell Biol 2003; 15: 3572–82. [DOI] [PubMed] [Google Scholar]
- 13. Anderson SI, Behrendt B, Machesky LM, Insall RH, Nash GB. Linked regulation of motility and integrin function in activated migrating neutrophils revealed by interference in remodelling of the cytoskeleton. Cell Moti Cytoskeleton 2003; 54: 135–46. [DOI] [PubMed] [Google Scholar]
- 14. Mukai Y, Iwaya K, Ogawa H, Mukai K. Involvement of Arp2/3 complex in MCP‐1 induced‐chemotaxis. Biochem Biophys Res Commun 2005; 334: 395–402. [DOI] [PubMed] [Google Scholar]
- 15. Machesky LM, Mullins RD, Higgs HN et al. Scar, a WASp‐related protein, activates nucleation of actin filaments by the Arp2/3 complex. Proc Natl Acad Sci USA 1999; 96: 3739–44. [DOI] [PMC free article] [PubMed] [Google Scholar]
- 16. Miki H, Sasaki T, Takai Y, Takenawa T. Induction of filopodium formation by a WASP‐related actin‐depolymerizing protein N‐WASP. Nature 1998; 391: 93–6. [DOI] [PubMed] [Google Scholar]
- 17. Suetsugu S, Miki H, Takenawa T. Identification of two human WAVE/SCAR homologues as general actin regulatory molecules which associate with the Arp2/3 complex. Biochem Biophys Res Commun 1999; 260: 296–302. [DOI] [PubMed] [Google Scholar]
- 18. Winter DC, Choe EY, Li R. Genetic dissection of the budding yeast Arp2/3 complex: a comparison of the in vivo and structural roles of individual subunits. Proc Natl Acad Sci USA 1999; 96: 7288–93. [DOI] [PMC free article] [PubMed] [Google Scholar]
- 19. Machesky LM, Insall RH. Scar1 and the related Wiskott–Aldrich syndrome protein, WASP, regulate the actin cytoskeleton through the Arp2/3 complex. Curr Biol 1998; 8: 1347–56. [DOI] [PubMed] [Google Scholar]
- 20. Mullins RD. How WASP‐family proteins and the Arp2/3 complex convert intracellular signals into cytoskeletal structures. Curr Opin Cell Biol 2000; 12: 91–6. [DOI] [PubMed] [Google Scholar]
- 21. Prehoda KE, Scott JA, Mullins RD, Lim WA. Integration of multiple signals through cooperative regulation of the N‐WASP‐Arp2/3 complex. Science 2000; 290: 801–6. [DOI] [PubMed] [Google Scholar]
- 22. Zallen JA, Cohen Y, Hudson AM, Cooley L, Wieschaus E, Schejter ED. SCAR is a primary regulator of Arp2/3‐dependent morphological events in Drosophila. J Cell Biol 2002; 156: 689–701. [DOI] [PMC free article] [PubMed] [Google Scholar]
- 23. Snapper SB, Takeshima F, Anton I et al. N‐WASP deficiency reveals distinct pathways for cell surface projections and microbial actin‐based motility. Nat Cell Biol 2001; 3: 897–904. [DOI] [PubMed] [Google Scholar]
- 24. Yan C, Martinez‐Quiles N, Eden S et al. WAVE2 deficiency reveals distinct roles in embryogenesis and Rac‐mediated actin‐based motility. EMBO J 2003; 22: 3602–12. [DOI] [PMC free article] [PubMed] [Google Scholar]
- 25. Suetsugu S, Yamazaki D, Kurisu S, Takenawa T. Differential roles of WAVE1 and WAVE2 in dorsal and peripheral ruffle formation for fibroblast cell migration. Dev Cell 2003; 5: 595–609. [DOI] [PubMed] [Google Scholar]
- 26. Yamazaki D, Suetsugu S, Miki H et al. WAVE2 is required for directed cell migration and cardiovascular development. Nature 2003; 424: 452–6. [DOI] [PubMed] [Google Scholar]
- 27. Otsubo T, Iwaya K, Mukai Y et al. Involvement of Arp2/3 complex in the process of colorectal carcinogenesis. Mod Pathol 2004; 17: 461–7. [DOI] [PubMed] [Google Scholar]
- 28. Sobin LH, Wittekind C, eds. TNM. Classification of Malignant Tumors, 5th edn. New York, NY: Wiley‐Liss, 1997. [Google Scholar]
- 29. Ueno H, Murphy J, Jass JR, Mochizuki H, Talbot IC. Tumor ‘budding’ as an index to estimate the potential of aggressiveness in the rectal cancer. Histopatology 2002; 40: 127–32. [DOI] [PubMed] [Google Scholar]
- 30. McNutt NS, Mak LL, Kim YS. Comparison of cell peripheries in the human colonic adenocarcinoma cell lines SW480 and SW620 grown in floating chamber culture, cover slip culture, athymic (nude) mice, and BALB/c mice. Lab Invest 1981; 44: 309–23. [PubMed] [Google Scholar]
- 31. Iwaya K, Tsuda H, Fujita S, Suzuki M, Hirohashi S. Natural state of mutant p53 protein and heat shock protein 70 in breast cancer tissues. Lab Invest 1995; 72: 707–14. [PubMed] [Google Scholar]
- 32. Oikawa K, Ohbayashi T, Kiyono T et al. Expression of a novel human gene, human wings apart‐like (hWAPL), is associated with cervical carcinogenesis and tumor progression. Cancer Res 2004; 64: 3545–9. [DOI] [PubMed] [Google Scholar]
- 33. Young ID, Ailles L, Deugau K, Kisilevsky R. Transcription of cRNA for in situ hybridization from polymerase chain reaction‐amplified DNA. Lab Invest 1991; 64: 709–12. [PubMed] [Google Scholar]
- 34. Suzuki T, Kadoya Y, Sato Y et al. The expression of pancreatic markers in centroacinar cells of the normal and regenerating rat pancreas: their possible transformation to endocrine cells. Arch Histol Cytol 2003; 66: 347–58. [DOI] [PubMed] [Google Scholar]
- 35. Hirohashi S. Inactivation of the E‐cadherin‐Mediated cell adhesion system in human cancer. Am J Pathol 1998; 153: 333–9. [DOI] [PMC free article] [PubMed] [Google Scholar]
- 36. Oda T, Kanai Y, Oyama T et al. E‐cadherin gene mutations in human carcinoma cell lines. Proc Natl Acad Sci USA 1994; 95: 1858–62. [DOI] [PMC free article] [PubMed] [Google Scholar]
- 37. Oikawa T, Yamaguchi H, Itoh T et al. PtdIns (3,4,5)P3 binding is necessary for WAVE2–induced formation of lamellipodia. Nat Cell Biol 2004; 6 : 420–6. [DOI] [PubMed]
- 38. Shi J, Scita G, Casanova JE. WAVE2 signaling mediates invasion of polarized epithelial cells by salmonella typhimurium. J Biol Chem 2005; 280: 29 849–55. [DOI] [PubMed] [Google Scholar]
- 39. Ueno H, Mochizuki H, Hashiguchi Y et al. Risk factors for an adverse outcome in early invasive colorectal carcinoma. Gastroenterology 2004; 127: 385–94. [DOI] [PubMed] [Google Scholar]
- 40. Prall F, Nizze H, Barten M. Tumor budding as prognostic factor in stage I/II colorectal carcinoma. Histopathology 2005; 47: 17–24. [DOI] [PubMed] [Google Scholar]
- 41. Kaneda A, Kaminishi M, Sugimura T, Ushijima T. Decreased expression of the seven ARP2/3 complex genes in human gastric cancers. Cancer Lett 2004; 212: 203–10. [DOI] [PubMed] [Google Scholar]
- 42. Yamaguchi H, Lorenz M, Kempiak S et al. Molecular mechanisms of invadopodium formation: the role of the N‐WASP‐Arp2/3 complex pathway and cofilin. J Cell Biol 2005; 168: 441–52. [DOI] [PMC free article] [PubMed] [Google Scholar]