

Abstract
FKHRL1 (also called FOXO3a) is a member of the Forkhead Box, class O (FOXO) subfamily of forkhead transcription factors and functions downstream of Bcr–Abl tyrosine kinase as a phosphorylated inactive form in chronic myelogenous leukemia (CML). The Bcr–Abl tyrosine kinase inhibitor imatinib induces cell cycle arrest and subsequent apoptosis via the conversion of FKHRL1 from the phosphorylated inactive form to the dephosphorylated active form in CML‐derived cell lines. In the present study, we examined whether active FKHRL1 can overcome resistance to imatinib. To this end, we generated a 4‐hydroxytamoxifen‐inducible active FKHRL1 (FKHRL1‐TM; a triple mutant of FKHRL1 in which all three Akt phosphorylation sites have been mutated)–estrogen receptor fusion protein expression system in CML‐derived imatinib‐resistant cell lines. 4‐Hydroxytamoxifen inhibited cell growth and cell cycle progression, and subsequently induced apoptosis, accompanied by upregulation of tumor necrosis factor‐related apoptosis‐inducing ligand (TRAIL). Thus, active FKHRL1 antagonized deregulated proliferation and induced apoptosis in these cell lines. In addition, imatinib‐resistant cells underwent apoptosis after transfection with full‐length TRAIL cDNA. Collectively, our results suggest that active FKHRL1 can overcome imatinib resistance in CML cells, in part via TRAIL production. (Cancer Sci 2007; 98: 1949–1958)
Imatinib is a specific inhibitor of the Abl and Bcr–Abl tyrosine kinases, and is a highly potent therapeutic agent against chronic myelogenous leukemia (CML).( 1 ) However, because imatinib‐treated cells often lose sensitivity to imatinib at the blastic‐crisis phase in CML, how to overcome resistance to imatinib is of great therapeutic importance. Until now, several mechanisms of imatinib resistance, such as amplification and mutation of a bcr–abl fusion gene, have been reported.( 2 , 3 , 4 , 5 , 6 ) Therefore, it is important to develop therapeutic means of overcoming resistance to imatinib.
More than one hundred forkhead family transcription factors have been identified in diverse species ranging from yeasts to humans.( 7 ) These transcription factors are related to embryogenesis, differentiation, and tumorigenesis.( 8 ) Among them, the three forkhead transcription factors FKHRL1, AFX (also called FOXO4), and FKHR (also called FOXO1) have been identified as human homologs of DAF‐16, which is involved in the lifespan extension of Caenorhabditis elegans,( 9 ) and these three molecules are directly phosphorylated by activated Akt.( 10 , 11 , 12 , 13 , 14 , 15 , 16 ) We reported previously that FKHRL1 is phosphorylated directly by activated Akt as one of the downstream molecules of the phosphatidylinositol 3‐kinase (PI3K)–Akt activation pathway in erythropoietin (EPO) and thrombopoietin (TPO) signaling.( 17 , 18 ) Furthermore, very recently, we found that FKHRL1 lies downstream of BCR–ABL signaling, and that this molecule functions as an effector of imatinib‐induced cell cycle arrest and subsequent apoptosis in CML cells.( 19 ) Based on these findings, we proposed that FKHRL1 would represent an attractive target for therapeutic manipulation in CML.
In the present study, we examined whether or not active FKHRL1 can overcome resistance to imatinib using the cell lines KCL22/SR, K562/SR, and KU812/SR.( 20 , 21 ) To address this question, we generated a 4‐hydroxytamoxifen (4‐OHT)‐inducible FKHRL1‐TM (active FKHRL1; a triple mutant of FKHRL1 in which all three Akt phosphorylation sites have been mutated)–estrogen receptor (ER) system in these leukemia cell lines. We show here that 4‐OHT treatment inhibits cell growth of the transfectant cells via the production of tumor necrosis factor‐related apoptosis‐inducing ligand (TRAIL; also called Apo‐2 ligand (Apo‐2L)), although these cell lines are still resistant to imatinib. FKHRL1 represents an attractive target for therapeutic manipulation in imatinib‐resistant CML cells.
Materials and Methods
Reagents and antibodies. Fetal calf serum (FCS) and 4‐OHT were purchased from Sigma (St Louis, MO, USA). Polyclonal antibody against BCR was purchased from Santa Cruz Biotechnology (Santa Cruz, CA, USA). Antibodies against phospho‐FKHRL1 (Thr32) and phospho‐c‐Abl (Tyr245) were purchased from Cell Signaling Technology (Beverly, MA, USA). Antibody against native FKHRL1 was purchased from Upstate Biotechnology (Lake Placid, NY, USA). The 2‐phenylaminopyrimidine derivative imatinib (molecular weight 590) was developed and kindly provided by Novartis (Basel, Switzerland). The stock solutions of this compound were prepared at 1 mM with dimethyl sulfoxide and stored at –20°C. pcDNA3 containing human FKHRL1‐TM‐ER cDNA was kindly provided by Pual Coffer from the University Medical Center (Heidelberglaan, the Netherlands). Recombinant human TRAIL (Killer TRAILTM) was purchased from ALEXIS Biochemicals (Lausen, Switzerland). Anti‐TRAIL antibody was purchased from BD Biosciences Pharmingen (San Jose, CA, USA). A human TRAIL expression vector (TRAIL/pMKITneo) was kindly provided by Hideo Yagita (Juntendo, Tokyo).
Cell culture of CML‐derived cell lines and generation of transfectants. KCL22, K562, and KU812 cells were maintained in liquid culture with RPMI‐1640 containing 10% FCS. KCL22/SR, K562/SR, and KU812/SR cells were maintained in liquid culture with RPMI containing 10% FCS with imatinib (1 µM) and transfected with mammalian expression vector (pcDNA3; Invitrogen, Carlsbad, CA, USA) containing human FKHRL1‐TM‐ER cDNA,( 22 ) by the lipofection method according to the manufacturer's instructions (Promega, Madison, WI, USA). We selected three independent clones resistant to neomycin (1.0 mg/mL).
Colorimetric 3‐(4.5‐dimethylthiazol‐2‐yl)‐2.5‐diphenyltetrazolium bromide assay for cell proliferation. Cell growth was examined using a colorimetric assay according to the method of Mosmann with some modifications.( 23 ) Briefly, cells were incubated at a density of 1 × 10⁴/100 µL in 96‐well plates in Iscove modified Dulbecco medium (IMDM) or RPMI‐1640 containing 10% FCS. After 72 h of culture at 37°C, 20 µL sterilized 5 mg/mL 3‐(4.5‐dimethylthiazol‐2‐yl)‐2.5‐diphenyltetrazolium bromide (MTT; Sigma) was added to each well. Following a 2‐h incubation at 37°C, 100 µL of 10% sodium dodecyl sulfate (SDS) was added to each well to dissolve the dark‐blue crystal product. The optical density was measured at a wavelength of 595 nm using a microplate reader (model 3550; Bio‐Rad, Richmond, CA, USA).
Preparation of cell lysates and western blotting. The cells were washed and suspended in lysis buffer containing 20 mM Tris (pH 7.4), 150 mM NaCl, 1% Nonidet P (NP)‐40, 5 mM ethylenediaminetetraacetic acid, 1 mM phenylmethylsulfonyl fluoride (PMSF), 1.7 ng/mL aprotinin, 50 µg/mL leupeptin, 2 mM sodium orthovanadate, and 20 mM sodium fluoride. After 20 min of incubation on ice, insoluble materials were removed by centrifugation at 15 000g for 20 min. The supernatants were boiled for 5 min in SDS‐polyacrylamide gel electrophoresis (PAGE) sample buffer, resolved by SDS‐PAGE, and electroblotted onto a polyvinylidene fluoride (PVDF) membrane (Bio‐Rad). The blots were blocked with 5% skim milk in Tris‐buffered saline for 1 h at room temperature (RT), then incubated with the appropriate concentration of primary antibody overnight at 4°C or for 2–4 h at RT. After washing with Tris‐buffered saline containing Tween 20 (1 : 2000), the blots were probed with a 1:10 000 dilution of antirabbit or antimouse horseradish peroxidase‐conjugated secondary antibody for 60 min at RT. After a second washing, the blots were incubated with an enhanced chemiluminescence substrate (ECL Western blot detection system; Amersham Pharmacia Biotech, Buckinghamshire, UK) and exposed to Hyperfilm ECL (Amersham Pharmacia Biotech) to visualize the immunoreactive bands. The blots were stripped with Re‐Blot Plus Strong Antibody Stripping Solution (Chemicon International, Temecula, CA, USA) at RT for 30 min, washed, blocked, and reprobed.
Cell cycle analysis. Cell cycle analysis was carried out by staining DNA with propidium iodide in preparation for flow cytometry with the FACScan/CellFIT system (Becton‐Dickinson, San Jose, CA, USA).
Detection of apoptotic cells. After apoptosis was induced by the desired method, cells were collected and washed once with phosphate‐buffered saline. Cells were stained with annexin V‐Cy5 in the MEBCYTO‐Apoptosis Kit (MBL, Nagoya, Japan), and analyzed by FACScan. Annexin V‐stained cells were counted as early stage apoptotic cells, as in previous studies. Each data point was derived from an analysis of 1–1.5 × 10⁴ cells.
Real‐time quantitative polymerase chain reaction. Total RNA was isolated from the imatinib‐ or 4‐OHT‐treated cells using an RNeasy Mini Kit (Qiagen). Then, cDNA synthesis was carried out using an M‐MLV Reverse Transcriptase Kit (Invitrogen) according to the manufacturer's protocol. In brief, 1 µg of total RNA was reverse transcribed in 20 µL of reaction mixture containing 1 mM each dNTP, 0.01 M dithiothreitol (DTT), 200 U murine leukemia virus reverse transcriptase, 200 ng oligo (dT) primer, and 5× first‐strand buffer. The reaction mix was incubated at 37°C for 60 min and then the cDNA was denatured at 95°C for 10 min. For each sample, a control reaction not containing the reverse transcriptase enzyme was also carried out. Specific primers and probe for human TRAIL were purchased from Applied Biosystems (Assay on Demand Gene Expression Products, Foster City, CA, USA). The gene glyceraldehyde‐3‐phosphate dehydrogenase (GAPDH) was used as an endogenous control to standardize the amount of RNA in each reaction (Taqman human GAPDH control reagents). Polymerase chain reaction (PCR) was carried out on the cDNA samples using an ABI PRISM 7700 sequence detector (Applied Biosystems). The TaqMan 1000 reaction Gold with Buffer A Pack (PE Applied Biosystems) was used according to the manufacturer's protocol. For each sample tested, the PCR reaction was carried out in a 50‐µL volume containing 1 µL cDNA reaction mixture (equivalent to 50 ng of template RNA) and 1.25 U AmpliTaq Gold. Oligonucleotide primers and fluorogenic probe were added to a final concentration of 400 nM and 200 nM, respectively. The amplification step consisted of 40 cycles of 95°C for 15 s and 60°C for 1 min.
Reverse transcription‐PCR. Polymerase chain reaction amplification of human TRAIL and GAPDH was carried out in a final volume of 50 µL containing 3 µL first‐strand cDNA solution, 2.5 U Taq polymerase, 1× PCR buffer, 25 µM of each dNTP (Qiagen, Hilden, Germany), and 25 pmol of each 3′ and 5′ TRAIL‐specific oligonucleotide (forward primer, 5′‐GAA TCC CAT GGC TAT GAT GGA GGT CCA G‐3′ and reverse primer, 5′‐GGA TTC GAG GAC CTC TTT CTC TCA CTA‐3′) (GenBank accession number U37518), or 3′ and 5′ GAPDH‐specific oligonucleotide (forward primer, 5′‐ACG GAT TTG GTC GTA TTG GGC G‐3′ and reverse primer, 5′‐CTC CTG GAA GAT GGT GAT GG‐3′) (GenBank accession number J04038), as described previously.( 24 ) The PCR conditions were as follows: initial denaturation step at 94°C for 2 min, followed by 35 cycles (TRAIL) or 27 cycles (GAPDH) of denaturation for 30 s, annealing for 1 min at 58°C (TRAIL) or 64°C (GAPDH), extension at 72°C for 1 min and a final extension step at 72°C for 5 min. PCR products were electrophoresed on 3% agarose gels containing ethidium bromide and visualized under ultraviolet transillumination.
Transfection of K562/SR. K562/SR/FKHRL1‐TM‐ER cells were suspended in the specified electroporation buffer (Cell Line Nucleofector Kit V; Amaxa, Cologne, Germany) to a final concentration of 2 × 10⁷ cells/mL. Plasmid DNA (5 µg) was mixed with 0.1 mL of cell suspension, transferred to an electroporation cuvette, and nucleofected with an Amaxa Nucleofecor apparatus (Amaxa) with high efficiency (80.9 ± 8.4%) according to the manufacturer's protocol (Program X‐01). After electroporation, cells were transferred immediately to 2.0 mL complete medium, and cultured in six‐well plates. Transfection efficiency was calculated by simultaneous transfection with pEGFP‐C2 vector alone.
Morphologic study. A light microscopy examination was performed on Wright‐Giemsa stained cytospin preparations.
Results
Imatinib inhibits the activation of Bcr–Abl tyrosine kinase in the CML‐derived imatinib‐resistant cell lines K562/SR, KCL22/SR, and KU812/SR. In the present study we used the CML‐derived imatinib‐resistant cell lines K562/SR, KCL22/SR, and KU812/SR.( 20 , 21 ) To confirm that these clones were resistant to imatinib, we examined the effect of imatinib on the cell viability of each clone. As shown in Fig. 1a, the IC50 values of imatinib against the three imatinib‐resistant clones was much higher than that against each corresponding parental cell line, indicating that these clones are still resistant to imatinib.
Figure 1.

Effect of imatinib on cell viability and phosphorylation of Bcr–Abl and FKHRL1 in imatinib‐resistant cell lines. (a) Assessment of cell viability. The cells were treated with increasing concentrations of imatinib (0.5–2.5 µM) for 48 h. Cell viability was assessed by Trypan dye exclusion. (b) Phosphorylation of Bcr–Abl and FKHRL1. The cells were treated with imatinib (1 µM) for 6 h. After solubilization, cell extracts were resolved by 7.5% sodium dodecylsulfate–polyacrylamide gel electrophoresis and immunoblotted with antibodies directed against phospho‐Abl or phospho‐Thr32. The blot was reprobed with anti‐BCR antibody or anti‐FKHRL1 antibody to confirm equal loading of protein. Asterisk, endogenous FKHRL1.
Next, we examined whether imatinib inhibited Bcr–Abl tyrosine kinase activity in the CML‐derived imatinib‐resistant cell lines K562/SR, KCL22/SR, and KU812/SR. Western blotting analysis with antiphospho‐c‐Abl (Tyr245) revealed that the Bcr–Abl fusion protein was phosphorylated constitutively in all of the cell lines in the absence of imatinib (Fig. 1b). Phosphorylation of the Bcr–Abl protein was significantly diminished at 1 µM imatinib, and was completely abolished at 5 µM imatinib in all of the cell lines (Fig. 1b), although the expression level of Bcr–Abl protein was not changed after imatinib treatment. These results indicated that Bcr–Abl tyrosine kinase activity is actually suppressed in these imatinib‐resistant cell lines. Therefore, aberrant activation of molecules downstream of Bcr–Abl tyrosine kinase, but not Bcr–Abl tyrosine kinase activity itself, or alternatively a Bcr–Abl activity‐independent mechanism may be involved in the acquisition of imatinib resistance in these sublines.( 20 , 21 )
Imatinib does not affect constitutive phosphorylation of FKHRL1 in the K562/SR, KCL22/SR, and KU812/SR cell lines. Previously we reported that FKHRL1 functions as an effector of imatinib‐induced inhibition of cell growth as a downstream molecule of Bcr–Abl in CML cells, and that overexpression of active FKHRL1 in the nucleus antagonized deregulated proliferation of KCL22 cells.( 19 ) Based on these findings, we hypothesized that loss of FKHRL1 function as a transcription factor may be involved in imatinib resistance. Indeed, imatinib did not inhibit phosphorylation of FKHRL1 in the imatinib‐resistant cell lines (Fig. 1b), indicating that FKHRL1 is not working as a transcription factor in the imatinib‐resistant cell lines. If so, overexpression of active FKHRL1 in the nucleus could induce apoptosis in these imatinib‐resistant cell lines.
Overexpression of active FKHRL1 (FKHRL1‐TM‐ER) overcomes imatinib resistance in the K562/SR, KCL22/SR, and KU812/SR cell lines. To test the above hypothesis, we generated transfectants expressing FKHRL1‐TM‐ER, which is converted to the active form after the addition of 4‐OHT to the imatinib‐resistant cell lines (Fig. 2a). The transfectants were tentatively designated K562/SR/FKHRL1‐TM‐ER, KCL22/SR/FKHRL1‐TM‐ER, and KU812/SR/FKHRL1‐TM‐ER. The transfectant or parental cells were treated with increasing concentrations of 4‐OHT (0.01–1 µM) for 48 h and then the MTT‐incorporation assay was carried out. As shown in Fig. 2b, induction of the expression of FKHRL1‐TM by 4‐OHT treatment led to the suppression of MTT incorporation into the transfected cells, whereas 4‐OHT treatment had no significant effect on MTT incorporation into the parental control cells. These results suggest that overexpression of FKHRL1‐TM‐ER in the nucleus overcomes imatinib resistance in the K562/SR, KCL22/SR, and KU812/SR cell lines.
Figure 2.

Establishment of the 4‐hydroxytamoxifen (4‐OHT)‐inducible active FKHRL1–estrogen receptor (FKHRL1‐TM‐ER) system in imatinib‐resistant cell lines. (a) Generation of transfectants expressing FKHRL1‐TM‐ER. The imatinib‐resistant cell lines K562/SR, KCL22/SR, and KU812/SR were transfected with FKHRL1‐TM‐ER and then G418‐resistant clones were isolated. After solubilization, cell extracts were resolved by 7.5% sodium dodecylsulfate–polyacrylamide gel electrophoresis and immunoblotted with the antibodies directed against FKHRL1. (b) Effect of FKHRL1‐TM‐ER expression on 3‐(4.5‐dimethylthiazol‐2‐yl)‐2.5‐diphenyltetrazolium bromide (MTT) incorporation into transfectants. The cells were plated at a density of 10 000 cells/well in IMDM supplemented with 10% fetal calf serum and cultured with various concentrations of 4‐OHT (0.01–1 µM). The MTT reduction assay was carried out after 3 days of culture. The values represent the mean ± SD of triplicate cultures and are expressed as a percentage of the values for untreated transfectants. Each parental imatinib‐resistant cell line was used as a control.
Overexpression of active FKHRL1 induces apoptosis in the K562/SR, KCL22/SR, and KU812/SR cell lines. To elucidate the mechanism by which 4‐OHT inhibited the cell growth of the transfectants, we carried out cell cycle analysis. As shown in Fig. 3a, the ratio of the sub‐G1 population was drastically increased after the addition of 4‐OHT to the transfectants, suggesting that active FKHRL1 induced apoptosis in the transfectant cells. To confirm this notion, we carried out FACS analysis with annexin V‐Cy5. As shown in Fig. 3b, annexin V‐positive cells were significantly increased after 4‐OHT treatment. Taken together, these results indicate that active FKHRL1 induced apoptosis in the imatinib‐resistant transfectants. This was confirmed by the presence of morphological characteristics of apoptosis, such as nuclear fragmentation and chromatin condensation (Fig. 3c). In addition, cleaved bands of caspase 9, caspase 3 and poly(ADP‐ribose) polymerase (PARP), but not of caspase 8, were detected in K562/SR/FKHRL1‐TM‐ER cells after 4‐OHT treatment (Fig. 3d), suggesting that activation of the intrinsic apoptosis pathway is mainly involved in FKHRL1‐induced apoptosis. Taken together, our findings indicate that the downstream pathways of FKHRL1 are still functional in the imatinib‐resistant cell lines.
Figure 3.


Induction of apoptosis by 4‐hydroxytamoxifen (4‐OHT) treatment of the transfectants. (a) Effect of active FKHRL1–estrogen receptor (FKHRL1‐TM‐ER) expression on the cell cycle in the transfectants. The cells were treated with 4‐OHT (0.5 µM), sequentially cultured for the periods indicated, and harvested for cell cycle analysis. (b) Detection of annexin V‐positive cells after treatment with 4‐OHT. The cells were treated with 4‐OHT (0.5 µM) and then cultured for 48 h. The cells were then stained with annexin V‐Cy5 and subjected to flow cytometry. (c) Morphological characteristics of 4‐OHT‐treated transfectants. The cells were treated with 4‐OHT (0.5 µM), cultured for 48 h and then harvested for preparation of cytospin smears. The cytospin preparations were stained with Wright–Giemsa solutions (original magnification ×400). (d) Detection of apoptosis‐associated proteins after the induction of FKHRL1‐TM‐ER by 4‐OHT. K562/SR/FKHRL1‐TM‐ER cells were treated with 4‐OHT (0.5 µM). Twenty‐four and 48 h later, the cells were harvested for analysis by western blotting with antibodies recognizing the cleaved molecules of caspase 3, caspase 9, caspase 8, and poly(ADP‐ribose) polymerase (PARP). The blot was reprobed with β‐actin antibody to confirm equal loading of protein.
Imatinib‐treated CML cell lines produce TRAIL via activation of FKHRL1. To identify potential FKHRL1 target genes in CML cells, we used DNA microarray gene expression data in KU812/SR/FKHRL1‐TM‐ER cells before and after 4‐OHT treatment. We selected 12 genes whose expression level was elevated more than five times in 4‐OHT‐treated cells compared to the control cells (data not shown). Among them, we focused on TRAIL, because TRAIL can induce apoptosis in malignant cells and is reportedly one of the target molecules for FKHRL1. Based on these findings, we examined whether TRAIL is involved in FKHRL1‐induced apoptosis of CML‐derived cell lines. Quantitative real‐time PCR assays revealed that the mRNA levels were elevated drastically after the addition of 4‐OHT in the K562/SR/FKHRL1‐TM‐ER (maximal level, 68‐fold), KCL22/SR/FKHRL1‐TM‐ER (maximal level, 52‐fold), and KU812/SR/FKHRL1‐TM‐ER (maximal level, 42‐fold) cell lines (Fig. 4a). Western blotting analysis revealed that three kinds of TRAIL protein (32, 24, and 13 kDa) were detected after the addition of 4‐OHT in these transfectants: K562/SR, 32‐ and 13‐kDa TRAIL; KCL22/SR, 24‐ and 13‐kDa TRAIL; and KU812, 32‐kDa TRAIL (Fig. 4b). Reverse transcription‐PCR revealed that the 371‐bp product corresponding to the full‐length TRAIL transcript was detectable in 4‐OHT‐treated transfectants (Fig. 4c). These results suggest that the 32‐ and 24‐kDa proteins correspond to membrane‐bound and soluble TRAIL, respectively. In contrast, the 13‐kDa protein appeared to be degenerated TRAIL (see Discussion).
Figure 4.
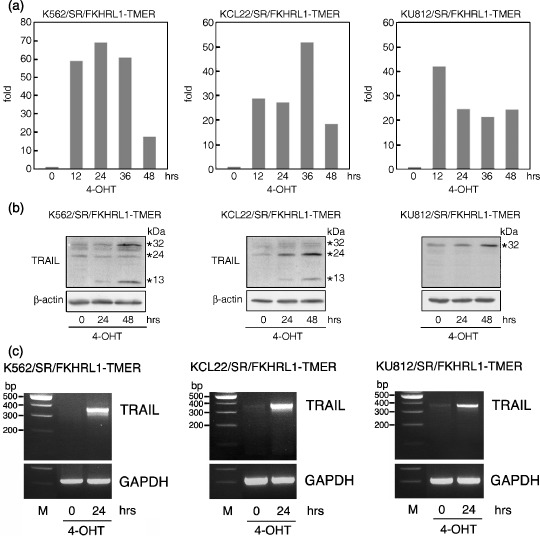
Induction of tumor necrosis factor‐related apoptosis‐inducing ligand (TRAIL) at the mRNA and protein levels by 4‐hydroxytamoxifen (4‐OHT) treatment of the transfectants. (a) Detection of TRAIL mRNA by quantitative real‐time reverse transcription–polymerase chain reaction (RT‐PCR). The cells were treated with 4‐OHT (0.5 µM), cultured for the periods indicated, and harvested for analysis. (b) Detection of TRAIL proteins. The cells were treated with 4‐OHT (0.5 µM), cultured for the periods indicated, and harvested for western blotting analysis with an anti‐TRAIL antibody. The blot was reprobed with β‐actin antibody to confirm equal loading of protein. (c) Detection of TRAIL mRNA by RT‐PCR. The cells were treated with 4‐OHT (0.5 µM), cultured for 24 h and harvested for RT‐PCR.
Next, we examined whether or not imatinib elevated the expression level of TRAIL in the imatinib‐sensitive and imatinib‐resistant cell lines. As shown in Fig. 5a, real‐time PCR revealed that TRAIL was significantly elevated at the mRNA level in the imatinib‐sensitive cell lines K562, KCL22, and KU812 but not in the imatinib‐resistant cell lines K562/SR, KCL22/SR, and KU812/SR. Consistent with these results, western blotting analysis with anti‐TRAIL antibody revealed that TRAIL (32 kDa) was significantly induced at the protein level in the imatinib‐sensitive cell lines but not in the imatinib‐resistant cell lines (Fig. 5b). However, TRAIL protein was not detected in the supernatant from imatinib‐treated cells (data not shown). These results suggest that imatinib induced apoptosis in CML cells in part via the production of TRAIL in the cytoplasm.
Figure 5.

Induction of tumor necrosis factor‐related apoptosis‐inducing ligand (TRAIL) by imatinib treatment of the imatinib‐sensitive and ‐resistant cell lines. The cells were treated with imatinib (1 µM), cultured for the periods indicated, and harvested for (a) real‐time PCR assay of TRAIL and (b) western blotting analysis with an antibody against TRAIL. The blot was reprobed with β‐actin antibody to confirm equal loading of protein.
Sensitivity of imatinib‐sensitive and ‐resistant cell lines to soluble TRAIL. To further elucidate the involvement of TRAIL in imatinib‐induced apoptosis, we examined the sensitivity of the imatinib‐sensitive and ‐resistant cell lines to soluble recombinant human TRAIL (sTRAIL). As shown in Fig. 6, both KCL22/SR and the parental KCL22 cell lines were sensitive to sTRAIL. K562/SR was relatively resistant to sTRAIL, to the same degree as the parental K562 cell line. KU812/SR was more sensitive to sTRAIL than the parental KU812 cell line. Thus, there was a discrepancy in sensitivity to imatinib and sTRAIL among these cell lines. In addition, imatinib did not elevate expression of the cell‐surface TRAIL receptors DR4 and DR5 (data not shown). Considering that TRAIL activity was not detected in conditioned media from the imatinib‐treated cells (data not shown), it is possible that imatinib induced apoptosis in CML cells via a mechanism independent of the interaction of sTRAIL and cell‐surface TRAIL receptors.
Figure 6.

Sensitivity of the cell lines to tumor necrosis factor‐related apoptosis‐inducing ligand (TRAIL; 20–100 ng/mL) and sequentially cultured. 3‐(4,5‐dimethylthiazol‐2‐yl)‐2,5‐diphenyltetrazolium bromide (MTT) reduction assay was performed after 3 days of culture. The values represent the mean ± SD from triplicate cultures and are expressed as a percentage of untreated transfectants.
Overexpression of TRAIL induces apoptosis in imatinib‐ and sTRAIL‐resistant K562/SR cells. To test the above hypothesis, we transfected K562/SR cells with pCDNA3.1 containing human full‐length TRAIL cDNA or the vector alone, because the K562/SR cells had the highest resistance to sTRAIL among the cell lines used in this study. We confirmed by western blotting analysis that TRAIL proteins were indeed expressed in the cells transfected with TRAIL cDNA (Fig. 7a). As shown in Fig. 7b, the ratio of annexin V‐positive cells increased significantly after transfection of K562/SR cells with TRAIL cDNA compared to the K562/SR cells transfected with vector alone (32.6 ± 1.8 vs 12.1 ± 4.7%). In addition, TRAIL‐expressing cells showed morphological characteristics of apoptosis such as nuclear fragmentation and chromatin condensation (Fig. 7c). As shown in Fig. 7a, cleaved bands of caspase 9, caspase 3, and PARP, but not of caspase 8, were detected after transfection of K562/SR cells with TRAIL cDNA. These results were almost consistent with those from the overexpression of FKHRL1‐TM‐ER in these cells (Fig. 3d). Taken together, these data suggest that FKHRL1 mainly activated an intrinsic apoptosis pathway in part via TRAIL production. However, we cannot exclude the possibility that an extrinsic apoptosis pathway involving DR4, DR5, and caspase 8 is disrupted in K562/SR cells, because these cells are resistant to TRAIL (Fig. 6). To test this possibility, we examined whether active FKHRL1 activates an intrinsic apoptosis pathway but not an extrinsic apoptosis pathway using soluble TRAIL‐sensitive KCL22/SR cells. As shown in Fig. 7d, cleaved caspase 8 was detected in sTRAIL‐treated KCL22/SR cells, suggesting that the extrinsic apoptosis pathway is intact in KCL22/SR cells. Nevertheless, almost consistent with the results from K562/SR cells, overexpression of FKHRL1‐TM‐ER in KCL22/SR cells induced cleavage of caspase 9 and, to a much lesser degree, that of caspase 8, suggesting that FKHRL1 mainly activated the intrinsic apoptosis pathway. Thus, our data indicate that active FKHRL1‐induced TRAIL production can induce apoptosis via the activation of an intrinsic apoptosis pathway even if the cell lines are resistant to both imatinib and soluble TRAIL.
Figure 7.

Overexpression of tumor necrosis factor‐related apoptosis‐inducing ligand (TRAIL) induces apoptosis in soluble TRAIL‐resistant cell lines. (a–c) K562/SR cells were transfected with human full‐length TRAIL cDNA using electroporation. After 48 h, the cells were harvested for analysis by (a) western blotting with antibodies recognizing TRAIL, and cleaved molecules of caspase 3, caspase 9, caspase 8, and poly(ADP‐ribose) polymerase (PARP), (b) FACS analysis with anti‐annexin V antibody, and (c) cytospin preparation stained with Wright‐Giemsa staining. (d) KCL22/SR cells were treated with TRAIL (100 ng/mL; 24 h) or ‐hydroxytamoxifen (4‐OHT) (0.5 µM; 48 h). Then, the cells were harvested for western blotting with antibodies recognizing cleaved molecules of caspase 3, caspase 9, caspase 8, and PARP. The blot was reprobed with β‐actin antibody to confirm equal loading of protein.
Discussion
To elucidate the detailed mechanism by which cells acquire resistance to imatinib, we recently isolated several imatinib‐resistant sublines from imatinib‐sensitive parental cell lines after long exposure to imatinib.( 20 , 21 ) We found no bcr–abl gene amplification, point mutations in the bcr–abl gene, or upregulation of P‐glycoprotein in the imatinib‐resistant sublines K562/SR, KCL22/SR, and KU812/SR. Previously, we demonstrated that FKHRL1 lies downstream of Bcr–Abl tyrosine kinase as a phosphorylated inactive form, and functions as an effector in imatinib‐induced cell cycle arrest and subsequent apoptosis via conversion from a phosphorylated inactive form to a dephosphorylated active form in an imatinib‐sensitive CML‐derived cell line, KCL22.( 19 ) Based on these observations, we hypothesized that loss of FKHRL1 function is involved in imatinib resistance. As expected, FKHRL1 remained constitutively phosphorylated even in the presence of imatinib, although imatinib inhibited BCR–ABL tyrosine kinase activity in these cell lines. These results indicate that FKHRL1 does not work as a proapoptotic effector, presumably resulting in imatinib resistance, and that a BCR–ABL‐independent mechanism is involved in imatinib resistance in these cell lines. To examine whether active FKHRL1 can overcome resistance to imatinib, we generated a 4‐OHT‐inducible FKHRL1‐TM‐ER system in K562/SR, KCL22/SR, and KU812/SR cells, and found that 4‐OHT induced apoptosis in all of the cell lines. Taken together, these findings imply that activation of FKHRL1 as a transcription factor is an important event in imatinib‐induced apoptosis in CML cells.
To further elucidate the mechanism by which active FKHRL1 induced apoptosis in CML cells, we focused our attention on the TRAIL molecule. Recently, Modur et al. identified TRAIL as a direct target molecule of FKHRL1,( 25 ) and we also found using DNA microarrays that TRAIL was significantly elevated at the mRNA level after 4‐OHT treatment in KU812/SR/FKHRL1‐TM‐ER cells (data not shown). Considering these findings together with the previously reported facts that TRAIL expression is regulated downstream of the PI3K–Akt pathway,( 26 ) and that the transcription activity of FKHRL1 is also controlled by phosphorylation via the PI3K–Akt pathway,( 27 ) it is reasonable to conclude that TRAIL is regulated directly by FKHRL1. Recently, Ghaffari et al. reported that BCR–ABL suppresses TRAIL gene transcription via the phosphorylation and functional inhibition of FKHRL1.( 28 ) This is consistent with our finding that imatinib induced TRAIL production via the inhibition of BCR–ABL activity and subsequent activation of FKHRL1 in CML‐derived cell lines.
Three kinds of TRAIL proteins (32, 24, and 13 kDa) were detected by forced expression of active FKHRL1 in the nucleus in K562/SR, KCL22/SR, and KU812/SR cells (Fig. 4b). Recently, Krieg et al. reported that in addition to the TRAIL‐α transcript (corresponding to the full‐length TRAIL transcript), which encodes membrane‐bound and soluble TRAIL, two splice variants of the human TRAIL protein, TRAIL‐β (lacking exon 3) and TRAIL‐γ (lacking exons 2 and 3), were identified, and these two variants have no apoptotic potential.( 24 ) To detect the splice variants of TRAIL in 4‐OHT‐treated transfectants, we carried out reverse transcription‐PCR using oligonucleotide primers that can discriminate the full‐length TRAIL‐α, TRAIL‐β, and TRAIL‐γ transcripts. As shown in Fig. 4c, a single band (371 bp) corresponding to TRAIL‐α was detected commonly in K562/SR/FKHRL1‐TM‐ER, KCL22/SR/FKHRL1‐TM‐ER, and KU812/SR/FKHRL1‐TM‐ER cells. These results suggest that these transfectants produced TRAIL‐α alone via the activation of FKHRL1. Therefore, we concluded that the 32‐ and 24‐kDa TRAIL proteins correspond to membrane‐bound TRAIL and soluble TRAIL, respectively. In addition, we speculated that the 13‐kDa protein corresponds to degenerated TRAIL.
FLICE‐like inhibitory protein (FLIP) is a regulator of proximal apoptosis pathways that are activated by tumor necrosis factor (TNF) and Fas‐family death receptors, and functions as a dominant‐negative inhibitor of caspase‐8. Therefore, it is predicted that downregulation of FLIP would enhance sensitivity to TRAIL and Fas ligand. Recently, it was reported that an active mutant of FKHRL1 (FKHRL1‐TM) downregulates FLIP mRNA and protein expression in endothelial cells, resulting in enhancement of apoptosis induced by TRAIL.( 29 ) In the present study, however, we could not demonstrate that the 4‐OHT‐induced activation of FKHRL1 downregulated the expression of FLIP protein in the CML‐derived cell lines (data not shown). Therefore, it is unlikely that FKHRL1 enhanced sensitivity to TRAIL via the downregulation of FLIP levels, leading to apoptosis in these cells.
In contrast, a cleaved caspase 9 band was detectable after overexpression of TRAIL in the K562/SR cells. It was recently reported that TRAIL induces cytochrome c release via caspase 8‐mediated cleavage of a member of the ‘BH3‐domain‐only’ Bcl‐2 family BID, and subsequent activation of caspase 9 and induction of apoptosis.( 30 ) Consistent with this finding, we found that not only a cleaved caspase 8 but also a cleaved caspase 9 band was detected in soluble TRAIL‐sensitive KCL22/SR cells when the cells were treated with TRAIL (Fig. 7d). In addition, Deng et al. reported that Bax‐dependent mitochondrial release of Smac/DIABLO is required for TRAIL‐induced apoptosis.( 31 ) Thus, extrinsic and intrinsic pathways of apoptosis may be interconnected tightly in TRAIL‐induced cell death signaling. Unexpectedly, however, neither overexpression of active FKHRL1 nor TRAIL enhanced the band of cleaved caspase 8 in K562/SR cells. This result suggests that active FKHRL1 or TRAIL‐activated intrinsic apoptosis pathways are mediated by a caspase 8‐independent mechanism, although the detailed mechanism is still unknown.
It is important to elucidate the mechanism by which FKHRL1 is phosphorylated constitutively in the imatinib‐resistant K562/SR, KCL22/SR, and KU812/SR cells because upstream kinases of FKHRL1 would also be targets for therapeutic manipulation. Although FKHRL1 is phosphorylated by Akt and serum‐ and glucocorticoid‐inducible protein kinase (SGK) kinases,( 9 , 32 ) which lie downstream of PI3K activity, we did not detect the phosphorylated Akt kinase in the imatinib‐resistant cell lines used in the present study (data not shown). Therefore, the aberrant activation of SGK, another serine/threonine kinase of FKHRL1, or inactivation of some unidentified tyrosine phosphatase of FKHRL1 may be involved in the constitutive phosphorylation of FKHRL1, although these concepts are speculative at present.
The autocrine system of TRAIL regulation appears not to be limited to CML cells. Altucci et al. reported that all‐trans retinoic acid (ATRA), a vitamin A derivative and a potent therapeutic agent of acute promyelocytic leukemia (APL), induces apoptosis in APL cells via the paracrine action of TRAIL.( 33 ) Although the detailed mechanism by which ATRA induces TRAIL in APL cells is still unknown, it is possible that FKHRL1 is involved in ATRA‐induced TRAIL expression. Indeed, our preliminary data showed that FKHRL1 is also expressed in a human promyelocytic leukemia cell line, NB4.
It is noteworthy that resistance to soluble TRAIL is overcome in K562/SR cells by transfection with full‐length TRAIL cDNA. It was reported that adenoviral‐mediated expression of TRAIL induced apoptosis in several cell lines derived from hepatoma, breast cancer, prostate cancer, bladder cancer, and melanoma, including a soluble TRAIL‐resistant hepatoma and prostate cancer cell lines.( 28 , 34 , 35 , 36 , 37 , 38 ) In addition, administration of the TRAIL gene using adenoviral or herpes simplex virus (HSV) vector suppressed the growth of human tumor xenografts derived from breast cancer, lung cancer, and glioma cell lines.( 28 , 34 , 38 ) Therefore, full‐length TRAIL gene transfer with high transfection efficiency would be a potential application in cancer therapy, even if the cancer cells are resistant to soluble TRAIL.
In summary, we showed that active FKHRL1 overcomes imatinib resistance in CML‐derived cell lines. In addition, we identified TRAIL as a common effector of apoptosis induced by imatinib and FKHRL1. Based on our observations, we propose that FKHRL1 and its downstream molecules, including TRAIL, would be attractive target molecules for therapeutic manipulation at least in imatinib‐resistant CML cells, although we did not examine whether dasatinib and nilotinib, which are second‐generation Bcr‐Abl tyrosine kinase inhibitors,( 39 ) overcome imatinib resistance via TRAIL production in our system.
Acknowledgments
We thank Paul Coffer (University Medical Center Utrecht, the Netherlands) for FKHRL1‐TM‐ER cDNA. We also thank Novartis Pharmaceuticals (Basel, Switzerland) for the generous gift of imatinib. This work was supported by Grants‐in‐Aid for Cancer Research and Scientific Research from the Ministry of Education, Science, and Culture of Japan and by grants from the Novartis Foundation for the promotion of science.
References
- 1. Druker BJ, Tamura S, Buchdunger E et al . Effects of a selective inhibitor of the Abl tyrosine kinase on the growth of Bcr‐Abl positive cells. Nat Med 1996; 2: 561–6. [DOI] [PubMed] [Google Scholar]
- 2. Le Coutre P, Tassi E, Varella‐Garcia M et al . Induction of resistance to the Abelson inhibitor STI571 in human leukemic cells through gene amplification. Blood 2000; 95: 1758–66. [PubMed] [Google Scholar]
- 3. Weisberg E, Griffin JD. Mechanism of resistance to the ABL tyrosine kinase inhibitor STI571 in BCR/ABL‐transformed hematopoietic cell lines. Blood 2000; 95: 3498–505. [PubMed] [Google Scholar]
- 4. Mahon FX, Deininger MW, Schultheis B et al . Selection and characterization of BCR‐ABL positive cell lines with differential sensitivity to the tyrosine kinase inhibitor STI571: diverse mechanisms of resistance. Blood 2000; 96: 1070–9. [PubMed] [Google Scholar]
- 5. Gorre ME, Mohammed M, Ellwood K et al . Clinical resistance to STI‐571 cancer therapy caused by BCR‐ABL gene mutation or amplification. Science 2001; 293: 876–80. [DOI] [PubMed] [Google Scholar]
- 6. Gambacorti‐Passerini C, Barni R, Le Coutre P et al . Role of α1 acid glycoprotein in the in vivo resistance of human BCR‐ABL+ leukemic cells to the abl inhibitor STI571. J Natl Cancer Inst 2000; 92: 1641–50. [DOI] [PubMed] [Google Scholar]
- 7. Anderson MJ, Viars CS, Czekay S, Cavenee WK, Arden KC. Cloning and characterization of three human forkhead genes that comprise an FKHR‐like gene subfamily. Genomics 1998; 47: 187–99. [DOI] [PubMed] [Google Scholar]
- 8. Kaufmann E, Knochel W. Five years on the wings of fork head. Mech Dev 1996; 57: 3–20. [DOI] [PubMed] [Google Scholar]
- 9. Ogg S, Paradis S, Gottlieb S et al . The fork head transcription factor DAF‐16 transduces insulin‐like metabolic and longevity signals in C. elegans . Nature 1997; 389: 994–9. [DOI] [PubMed] [Google Scholar]
- 10. Brunet A, Bonni A, Zigmond MJ et al . Akt promotes cell survival by phosphorylating and inhibiting a forkhead transcription factor. Cell 1999; 96: 857–68. [DOI] [PubMed] [Google Scholar]
- 11. Tang ED, Nunez G, Barr FG, Guan KL. Negative regulation of the forkhead transcription factor FKHR by Akt. J Biol Chem 1999; 274: 16 741–6. [DOI] [PubMed] [Google Scholar]
- 12. Biggs WH 3rd, Meisenhelder J, Hunter T, Cavenee WK, Arden KC. Protein kinase B/Akt‐mediated phosphorylation promotes nuclear exclusion of the winged helix transcription factor FKHR1. Proc Natl Acad Sci USA 1999; 96: 7421–6. [DOI] [PMC free article] [PubMed] [Google Scholar]
- 13. Rena G, Guo S, Cichy SC, Unterman TG, Cohen P. Phosphorylation of the transcription factor forkhead family member FKHR by protein kinase B. J Biol Chem 1999; 274: 17 179–83. [DOI] [PubMed] [Google Scholar]
- 14. Takaishi H, Konishi H, Matsuzaki H et al . Regulation of nuclear translocation of forkhead transcription factor AFX by protein kinase B. Proc Natl Acad Sci USA 1999; 96: 11 836–41. [DOI] [PMC free article] [PubMed] [Google Scholar]
- 15. Kops GJ, De Ruiter ND, De Vries‐Smits AM, Powell DR, Bos JL, Burgering BM. Direct control of the forkhead transcription factor AFX by protein kinase B. Nature 1999; 398: 630–4. [DOI] [PubMed] [Google Scholar]
- 16. Nakae J, Park BC, Accili D. Insulin stimulates phosphorylation of the forkhead transcription factor FKHR on serine 253 through a wortmannin‐sensitive pathway. J Biol Chem 1999; 274: 15 982–5. [DOI] [PubMed] [Google Scholar]
- 17. Kashii Y, Uchida M, Kirito K et al . A member of forkhead family transcription factor, FKHRL1, is one of the downstream molecules of phosphatidylinositol 3‐kinase‐Akt activation pathway in erythropoietin signal transduction. Blood 2000; 96: 941–9. [PubMed] [Google Scholar]
- 18. Tanaka M, Kirito K, Kashii Y et al . Forkhead family transcription factor FKHRL1 is expressed in human megakaryocytes: Regulation of cell cycling as a downstream molecule of thrombopoietin signaling. J Biol Chem 2001; 276: 15 082–9. [DOI] [PubMed] [Google Scholar]
- 19. Komatsu N, Watanabe T, Uchida M et al . A member of Forkhead transcription factor FKHRL1 is a downstream effector of STI571‐induced cell cycle arrest in BCR‐ABL‐expressing cells. J Biol Chem 2003; 278: 6411–19. [DOI] [PubMed] [Google Scholar]
- 20. Ohmine K, Nagai T, Tarumoto T et al . Analysis of gene expression profiles in an imatinib‐resistant cell line, KCL22/SR. Stem Cells 2003; 21: 315–21. [DOI] [PubMed] [Google Scholar]
- 21. Miyoshi T, Nagai T, Ohmine K et al . Relative importance of apoptosis and cell cycle blockage in the synergistic effect of combined R115777 and imatinib treatment in BCR‐ABL‐positive cell lines. Biochem Phamacol 2005; 69: 1585–94. [DOI] [PubMed] [Google Scholar]
- 22. Medema RH, Kops GJ, Bos JL, Burgering BM. AFX‐like forkhead transcription factors mediate cell‐cycle regulation by Ras and PKB through p27kip1. Nature 2000; 404: 782–7. [DOI] [PubMed] [Google Scholar]
- 23. Mosmann T. Rapid colorimetric assay for cellular growth and survival: application to proliferation and cytotoxicity assays. J Immunol Meth 1983; 65: 55–63. [DOI] [PubMed] [Google Scholar]
- 24. Krieg A, Krieg T, Wenzel M et al . TRAIL‐β and TRAIL‐γ: two novel splice variants of the human TNF‐related apoptosis‐inducing ligand (TRAIL) without apoptotic potential. Br J Cancer 2003; 88: 918–27. [DOI] [PMC free article] [PubMed] [Google Scholar]
- 25. Modur V, Nagarajan R, Evers BM, Milbrandt J. FOXO proteins regulate tumor necrosis factor‐related apoptosis inducing ligand expression: Implications for PTEN mutation in prostate cancer. J Biol Chem 2002; 277: 47 928–37. [DOI] [PubMed] [Google Scholar]
- 26. Wang Q, Wang X, Hernandez A, Hellmich MR, Gatalica Z, Evers BM. Regulation of TRAIL expression by the phosphatidylinositol 3‐kinase/Akt/GSK‐3 pathway in human colon cancer cells. J Biol Chem 2002; 277: 36 602–10. [DOI] [PubMed] [Google Scholar]
- 27. Zheng WH, Kar S, Quirion R. Insulin‐like growth factor‐1‐induced phosphorylation of the forkhead family transcription factor FKHRL1 is mediated by Akt kinase in PC12 cells. J Biol Chem 2000; 275: 39 152–8. [DOI] [PubMed] [Google Scholar]
- 28. Ghaffari S, Jagani Z, Kitidis C, Lodish HF, Khosravi‐Far R. Cytokines and BCR‐ABL mediate suppression of TRAIL‐induced apoptosis through inhibition of forkhead FOXO3a transcription factor. Proc Natl Acad Sci USA 2003; 100: 6523–8. [DOI] [PMC free article] [PubMed] [Google Scholar]
- 29. Skurk C, Maatz H, Kim HS et al . The Akt‐regulated forkhead transcription factor FOXO3a controls endothelial cell viability through modulation of the caspase‐8 inhibitor FLIP. J Biol Chem 2004; 279: 1513–25. [DOI] [PubMed] [Google Scholar]
- 30. MacFarlane M, Merrison W, Dinsdale D, Cohen GM. Active caspases and cleaved cytokeratins are sequestered into cytoplasmic inclusions in TRAIL‐induced apoptosis. J Cell Biol 2000; 20: 1239–54. [DOI] [PMC free article] [PubMed] [Google Scholar]
- 31. Deng Y, Lin Y, Wu X. TRAIL‐induced apoptosis requires Bax‐dependent mitochondrial release of Smac/DIABLO. Genes Dev 2002; 16: 33–45. [DOI] [PMC free article] [PubMed] [Google Scholar]
- 32. Brunet A, Park J, Tran H, Hu LS, Hemmings BA, Greenberg ME. Protein kinase SGK mediates survival signals by phosphorylating the forkhead transcription factor FKHRL1 (FOXO3a). Mol Cell Biol 2001; 21: 952–65. [DOI] [PMC free article] [PubMed] [Google Scholar]
- 33. Altucci L, Rossin A, Raffelsberger W, Reitmair A, Chomienne C, Gronemeyer H. Retinoic acid‐induced apoptosis in leukemia cells is mediated by paracrine action of tumor‐selective death ligand TRAIL. Nat Med 2001; 7: 680–6. [DOI] [PubMed] [Google Scholar]
- 34. Lin T, Huang X, Gu J et al . Long‐term tumor‐free survival from treatment with the GFP‐TRAIL fusion gene expressed from the hTERT promoter in breast cancer cells. Oncogene 2002; 21: 8020–8. [DOI] [PubMed] [Google Scholar]
- 35. Armeanu S, Lauer UM, Smirnow I et al . Adenoviral gene transfer of tumor necrosis factor‐related apoptosis‐inducing ligand overcomes an impaired response of hepatoma cells but causes severe apoptosis in primary human hepatocytes. Cancer Res 2003; 63: 2369–72. [PubMed] [Google Scholar]
- 36. Voelkel‐Johnson C, King DL, Norris JS. Resistance of prostate cancer cells to soluble TNF‐related apoptosis‐inducing ligand (TRAIL/Apo2L) can be overcome by doxorubicin or adenoviral delivery of full‐length TRAIL. Cancer Gene Ther 2002; 9: 164–72. [DOI] [PubMed] [Google Scholar]
- 37. Shah K, Tang Y, Breakefield X, Weissleder R. Real‐time imaging of TRAIL‐induced apoptosis of glioma tumors in vivo . Oncogene 2003; 22: 6865–72. [DOI] [PubMed] [Google Scholar]
- 38. Griffith TS, Anderson RD, Davidson BL, Williams RD, Ratliff TL. Adenoviral‐mediated transfer of the TNF‐related apoptosis‐inducing ligand/Apo‐2 ligand gene induces tumor cell apoptosis. J Immunol 2000; 165: 2886–94. [DOI] [PubMed] [Google Scholar]
- 39. Jabbour E, Cortes J, Kantarjian H. Novel tyrosine kinase inhibitiors in chronic myelogenous leukemia. Curr Opin Oncol 2006; 18: 578–83. [DOI] [PubMed] [Google Scholar]