
Figure 2.
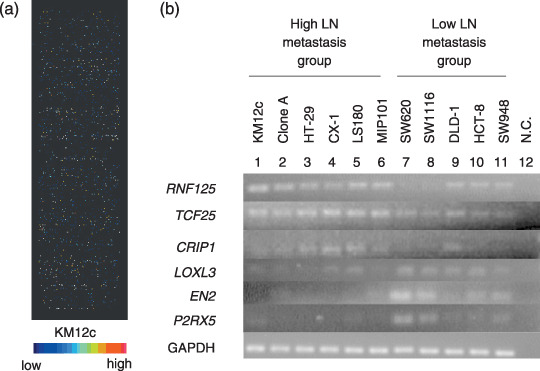
cDNA microarray and reverse transcription–polymerase chain reaction (RT‐PCR) analyses with colorectal cancer cell lines. (a) cDNA microarray using the KM12c cell line. (b) RT‐PCR with cell lines. 1–6, high lymph node (LN) metastasis group; 7–11, low LN metastasis group; N.C., negative control. Internal control is glyceraldehyde‐3‐phosphate dehydrogenase (GAPDH) mRNA.