

Abstract
In colorectal cancer (CRC) patients, metastasis to the regional lymph node (LN) is an important first step in the dissemination of cancers. To identify the genes possibly involved in LN metastasis of CRC, we analyzed LN metastases in an orthotopic implantation mouse model with 22 CRC cell lines using Matrigel, an extracellular matrix protein derived from mice sarcoma, and combined the data with gene expression profiles of cDNA microarray of those cell lines. With this implantation analysis, the incidence of LN metastasis was 60% in 228 orthotopically implanted mice and varied from 100% to 0% among the cell lines. KM12c and Clone A showed LN metastasis in all orthotopically implanted mice, but DLD‐1, HCT‐8, and SW948 did not show LN metastases at all. In contrast, the incidence of liver and lung metastasis in 22 CRC cell lines was 13% and 1%, respectively. Combining those data with cDNA microarray in vitro, we isolated 636 genes that were differentially expressed depending on the incidence of LN metastasis. Among those genes, the expression level of ring finger protein 125 (RNF125), previously known as an E3 ubiquitin ligase in T cell activation, was significantly different between primary tumors in Stage III CRC patients with LN metastasis and Stage II patients without LN metastasis. In conclusion, the orthotopic implantation mice model with Matrigel was useful, and we isolated candidate genes such as RNF125 that possibly play an important role in LN metastasis of CRC cells. (Cancer Sci 2008; 99: 711–719)
Abbreviations:
- AU
arbitrary unit
- CRC
colorectal cancer
- CRIP1
cysteine‐rich intestinal protein 1
- GAPDH
glyceraldehyde‐3‐phosphate dehydrogenase
- LN
lymph node
- RIG‐I
retinoic acid‐inducible gene I
- RNF125
ring finger protein 125
- RT‐PCR
reverse transcription–polymerase chain reaction
The incidence of CRC has been increasing in Japan. Approximately 94 000 CRC patients were diagnosed in 1999,( 1 ) and approximately 40 000 patients died of CRC in 2004.( 2 ) Metastasis to regional LN is an important first step in the dissemination of CRC, and LN metastasis and liver metastasis affect the prognoses of CRC patients. The recurrence rate of CRC is directly associated with the extent of LN metastasis.( 3 ) Therefore, elucidating the mechanism of LN metastasis of CRC is considered to be crucial for developing an eventual solution to this problem. It is important to establish a spontaneous LN metastasis model for analyzing the mechanisms of LN metastasis in CRC. An orthotopic animal tumor model for CRC is a complementary tool for the study of tumors in vivo.
Matrigel basement membrane matrix (Becton Dickinson, Franklin Lakes, NJ, USA) is a solubilized basement membrane preparation extracted from Engelbreth–Holm–Swarm mouse sarcoma. Its major component is laminin, followed by collagen IV, heparan sulfate proteoglycans, entactin, and nidogen.( 4 , 5 , 6 , 7 , 8 , 9 ) At room temperature, Matrigel polymerizes and forms a “basement membrane” gel. The usefulness of Matrigel has been reported as an orthotopic implantation animal model of various kinds of cancers.( 5 , 10 , 11 , 12 , 13 ) Tsutsumi et al. advocated an experimental animal model of LN metastasis using an orthotopic implantation method by intrarectal injection of human cancer cell–Matrigel solution in nude mice, but liver metastasis did not occur.( 14 ) Takahashi et al. proposed a mouse model of rectal cancer established by intrarectal instillation of colon cancer cells following short‐term induction of colitis using an irritant agent, but the metastasis to other organs such as liver and lung was not induced at significant levels.( 15 ) Although some of the experimental models for metastasis of CRC have been developed, there is no report that addresses the relation between the metastasis of CRC and the change of gene expressions involved in the metastasis.
Molecular studies have so far been largely focused on individual candidate genes. cDNA microarray technology allows the measurement of mRNA expression levels of thousands of genes simultaneously in a single assay, providing a molecular definition of samples adapted to tackle the combinatory and complex natures of cancers.( 16 , 17 , 18 ) In the present study, we orthotopically implanted 22 human CRC cell lines onto the cecal walls of nude mice with Matrigel solution. To identify the genes possibly involved in LN metastasis of CRC, we analyzed the data of LN metastasis with the orthotopic implantation method in vivo in combination with that of gene expression profiles using a cDNA microarray in vitro.
Materials and Methods
Experimental animals. We used male BALB/c nu/nu mice at the age of 6 weeks (CLEA Japan, Tokyo, Japan). The mice were acclimatized for 1 week until the start of experiments and were kept in plastic cages. The mice were maintained under specific pathogen‐free conditions, and food and water were supplied ad libitum. Cages and bedding were sterilized by autoclaving, and food was sterilized by irradiation. All animal studies were conducted under the strict ethical considerations for use of experimental animals, according to the procedure of the ‘Guidelines for the Care and Use of Laboratory Animals of Tohoku University’. All animal care procedures were pre‐approved by the Animal Care and Use Committee of Tohoku University Graduate School of Medicine.
Cell lines and cell cultures. A total of 22 human CRC cell lines were either provided from the Cell Resource Center for Biomedical Research, Institute of Development, Aging and Cancer, Tohoku University (Sendai, Japan), or purchased from RIKEN BioResource Center (Tsukuba, Japan) and American Type Culture Collection (Manassas, VA, USA) (Table 1). The cells were cultured in either the recommended medium, RPMI‐1640 (Sigma‐Aldrich, St. Louis, MO, USA), L‐15 (Leibovitz) Medium (Sigma‐Aldrich), 1 × McCoy 5A (MP Biomedicals, Solon, OH, USA), or D‐MEM/F‐12 (Invitrogen, Carlsbad, CA, USA). The media was supplemented with 10% fetal bovine serum (JRH Biosciences, Lenexa, KS, USA) and 1% penicillin–streptomycin (Invitrogen). The cell lines were cultured at 37°C in a humidified atmosphere of 5% CO2 and 95% air in a plastic flask. The medium was replaced twice a week. The cells were subcultured every 1 or 2 weeks using 0.25% Trypsin–ethylenediaminetetraacetic acid (Invitrogen).
Table 1.
Human colorectal cancer cell lines used in this study for orthotopic implantation
| Cell line | Derived from | Dukes’ stage | Patient (sex/age in years) |
|---|---|---|---|
| Clone A | A subclone from DLD‐1 by Boyden chamber method | — | — |
| COLO205 | Colon adenocarcinoma, metastatic site, ascites | D | M/70 |
| COLO320 | Primary colon adenocarcinoma | — | F/55 |
| CX‐1 | A subclone from liver metastasis of nude mice after intrasplenic injection of HT‐29 | — | — |
| DLD‐1 | Primary colon adenocarcinoma | C | M/adult |
| HCT‐8 | Primary colon adenocarcinoma | — | M/67 |
| HCT‐15 | Primary colon adenocarcinoma | C | — |
| HCT116 | Primary colon adenocarcinoma | — | M/adult |
| HT‐29 | Primary colon adenocarcinoma | — | F/44 |
| KM12c | Primary colon adenocarcinoma | B | — |
| LoVo | Colon adenocarcinoma, left supraclavicular metastasis | C | M/56 |
| LS174T | Primary colon adenocarcinoma | B | F/58 |
| LS180 | Primary colon adenocarcinoma | B | F/58 |
| MIP101 | Colon adenocarcinoma, liver metastasis | D | M/54 |
| RKO | Primary colon adenocarcinoma | — | — |
| SW48 | Primary colon adenocarcinoma | C | F/82 |
| SW480 | Primary colon adenocarcinoma | B | M/50 |
| SW620 | Colon adenocarcinoma, lymph node recurrence | — | M/51 |
| SW948 | Primary colon adenocarcinoma | — | F/81 |
| SW1116 | Primary colon adenocarcinoma | — | M/73 |
| T84 | Colon adenocarcinoma, lung metastasis | — | M/72 |
| WiDr‐TC | Primary colon adenocarcinoma | — | F/78 |
—, data not available; F, female; M, male.
Clinical tumor samples. From January 2004 to April 2006, we collected primary CRC tissues from 26 CRC patients who underwent surgical resections at the Department of Surgery, Tohoku University Hospital. The specimens were immediately frozen and stored in liquid nitrogen until use. Written informed consent was obtained from all patients. The clinical and histopathological characteristics of the CRC patients are summarized in Table 2. Staging of CRC followed the Rules of the Japanese Society for Cancer of the Colon and Rectum (6th edition).( 19 ) Fourteen CRC patients were at Stage IIIa or Stage IIIb, which include LN metastasis, and 12 CRC patients were at Stage II, which does not include LN metastasis.
Table 2.
Clinical characteristics of colorectal cancer patients
| Patient | Age (years) | Sex | Tumor location | Type | Depth | LN metastasis | Stage |
|---|---|---|---|---|---|---|---|
| 1 | 77 | M | Sigmoid colon | Well | ss | – | II |
| 2 | 72 | F | Descending colon | Well | ss | – | II |
| 3 | 49 | F | Rectum | Mod | ss | – | II |
| 4 | 76 | F | Rectum | Mod | ss | – | II |
| 5 | 76 | M | Rectum | Well | ss | – | II |
| 6 | 70 | F | Rectum | Mod | ss | – | II |
| 7 | 84 | M | Ascending colon | Mod | ss | – | II |
| 8 | 72 | F | Cecum | Mod | ss | – | II |
| 9 | 77 | M | Sigmoid colon | Mod | ss | – | II |
| 10 | 79 | M | Transverse colon | Mod | ss | – | II |
| 11 | 85 | F | Sigmoid colon | Mod | ss | – | II |
| 12 | 73 | F | Cecum | Mod | ss | – | II |
| 13 | 80 | F | Ascending colon | Muc | si | + | IIIa |
| 14 | 67 | M | Ascending colon | Mod | ss | + | IIIa |
| 15 | 63 | F | Rectum | Mod | ss | + | IIIa |
| 16 | 68 | M | Rectum | Mod | ss | + | IIIa |
| 17 | 80 | F | Cecum | Well | ss | + | IIIa |
| 18 | 62 | F | Sigmoid colon | Mod | ss | + | IIIa |
| 19 | 45 | M | Rectum | Mod | ss | + | IIIa |
| 20 | 49 | M | Rectum | Mod | a2 | + | IIIb |
| 21 | 48 | M | Rectum | Mod | a2 | + | IIIb |
| 22 | 73 | F | Rectum | Mod | a2 | + | IIIb |
| 23 | 67 | F | Rectum | Mod | ss | + | IIIb |
| 24 | 81 | M | Rectum | Mod | a2 | + | IIIb |
| 25 | 65 | F | Cecum | Poor | mp | + | IIIb |
| 26 | 76 | F | Rectum | Mod | ai | + | IIIb |
+, positive of lymph node metastasis; –, negative of lymph node metastastis; a2, cancer exceeds the muscular layer and invades more deeply, but does not invade to other organs; ai, a rectal cancer invades directly to the other organs; M, male; F, female; Mod, moderately‐differentiated adenocarcinoma; Muc, mucinous adenocarcinoma; Poor, poorly‐differentiated adenocarcinoma; si, a colon cancer invades directly to the other organs; ss, subserosa; Well, well‐differentiated adenocarcinoma. Histological type, depth, and stage defined according to the rules of the Japanese Society for Cancer of the Colon and Rectum (6th edn).( 19 )
Total RNA isolation and reverse transcription. Total RNA was extracted from cell lines using the RNeasy Mini Kit (Qiagen, Valencia, CA, USA). Total RNA from clinical samples was extracted using the RNeasy Midi Kit (Qiagen). The RNA was treated with DNase I (Qiagen) in order to eliminate genomic DNA. The quality of the extracted total RNA was confirmed by electrophoresis on 1.2% denaturing agarose gels. cDNA was synthesized using a SuperScript III First‐Strand Synthesis System for RT‐PCR Kit (Invitrogen) from 5 µg total RNA. All the processes were carried out according to the manufacturer's instructions.
Orthotopic implantation of CRC cells using Matrigel. For orthotopic implantation, human CRC cell lines were harvested from culture flasks after a brief trypsinization and transferred to serum‐free medium. Nude mice were anesthetized by an intraperitoneal injection of pentobarbital sodium (1.5 mg per 20 g body weight). The abdomen was sterilized with alcohol swabs. A small median abdominal incision was made, and the cecum was exteriorized (Fig. 1a). CRC cells (2.0 × 10⁶) in 100 µL serum‐ free medium containing 10 µg/µL Matrigel were inoculated onto the cecal walls using 30‐gauge needles (Becton Dickinson) (Fig. 1a). To avoid leakage, a cotton swab was held over the injection site for 1 min. The cecum was then returned to the peritoneal cavity, and the abdominal wound was closed in one layer suture with 7‐0 PDS (Ethicon, Somerville, NJ, USA). Each cell line was implanted orthotopically in a series of 10 mice. For some cell lines, the same experiments were repeated with 10 additional mice.
Figure 1.
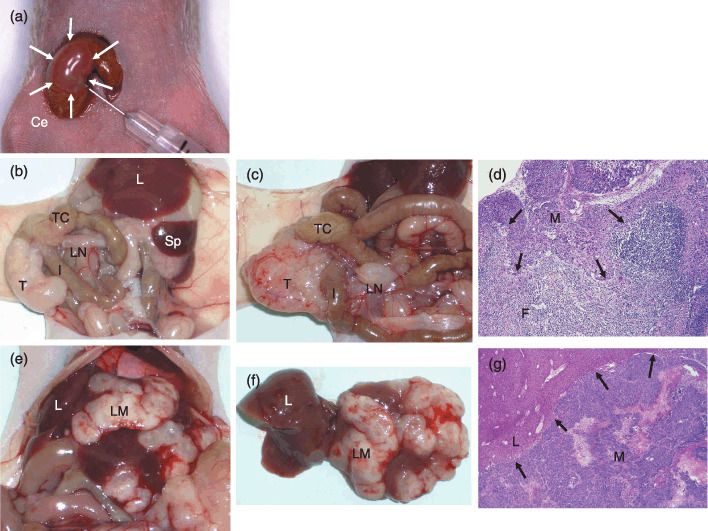
Orthotopic implantation of colorectal cancer (CRC) cells using Matrigel (a), and their macroscopic (b, c, e, f) and histological (d, g) characteristics. (a) The cecal wall bulges slightly after 100 µL injection of Matrigel solution containing 2.0 × 10⁶ CRC cells (white arrows). (b) Eight weeks after implantation of the LoVo cell line. The local tumor growth was recognized at the cecum. The mesenteric LN was not swollen. (c) Eight weeks after implantation of Clone A. The local tumor and a swollen LN were recognized. (d) Pathohistology of LN metastasis shown in (c) (hematoxylin–eosin [HE] staining, 400×). (e) Liver metastasis after implantation of HCT‐15 cells. (f) Liver translocated outside the body. The number of suspicious metastatic nodules was counted and the tissue was prepared with standard HE staining to confirm metastatic cancer cells. (g) Pathohistology of liver metastasis as shown in (f) (HE, 400×). Black arrows in (d) and (g) indicate invasive fronts of cancer cells. Ce, cecum; F, lymphoid follicle; I, ileum; L, liver; LM, liver metastasis; LN, lymph node; M, lymph node or liver metastasis; Sp, spleen; T, orthotopically implanted tumor onto cecal walls; TC, transverse colon.
Histological examination. At 6–8 weeks after inoculation, the mice were euthanized by an overdose of ether anesthesia followed by cervical dislocation. Mice were killed earlier if they showed signs of cachexia, bowel obstruction due to tumor, or significant physical deterioration. The presence of primary tumors, mesenteric LN metastasis, and distant metastasis were macroscopically assessed (Fig. 1b,c,e,f). All of the macroscopic findings were recorded, then all of the tumors were microscopically examined for LN, liver, or lung metastasis because microscopic metastasis could not be confirmed based on the macroscopic findings alone. The tumor weight, long and short diameters, and width were measured. The tumor volume was calculated using the following formula: tumor volume (mm3) = 1/2 × (long diameter) × (short diameter)2.( 14 ) They were fixed in IHC Zinc Fixative (Becton Dickinson) and embedded in paraffin. They were prepared through standard hematoxylin–eosin staining and evaluated for the presence of tumor cells or LN metastasis by microscopic examination (Fig. 1d,g). The number of mice in which CRC cells were orthotopically implanted was defined as A, the number of mice that successfully formed the local tumors in cecal walls as B, the number of mice with LN metastasis as C, the number of mice with liver metastasis as D, and the number of mice with peritoneal dissemination as E (Table 3). The rate of primary tumor formation on cecum was calculated with the formula B/A, the rate of mesenteric LN metastasis with C/B, the rate of liver metastasis with D/B, and the rate of peritoneal dissemination with E/B.
Table 3.
Detailed results of orthotopic implantation experiments in which colorectal cancer cell lines were inoculated onto the cecal walls of mice using Matrigel
| Cell line | Local tumor formation | Median tumor volume (range) (mm3) | Metastatic tumor formation | ||||
|---|---|---|---|---|---|---|---|
| Cecum B/A (%) | Median tumor weight (range) (g) | LN C/B (%) | Liver D/B (%) | Peritoneum E/B (%) | |||
| KM12c | 7/10 (70) | 0.78 (0.26–1.47) | 480 (417–544) | 7/7 (100) | High LN metastasis group | 0/7 (0) | 0/7 (0) |
| Clone A | 9/9 (100) | 1.47 (0.65–2.14) | 576 (200–1296) | 9/9 (100) | 0/9 (0) | 0/9 (0) | |
| HT‐29 | 18/18 (100) | 0.49 (0.31–0.85) | 180 (80–384) | 17/18 (94) | 2/18 (11) | 0/18 (0) | |
| CX‐1 | 13/13 (100) | 0.56 (0.31–0.72) | 165 (59–416) | 12/13 (92) | 4/13 (31) | 1/13 (8) | |
| LS180 | 12/12 (100) | 1.49 (0.74–8.09) | 925 (136–7142) | 11/12 (92) | 0/12 (0) | 3/12 (25) | |
| MIP101 | 14/15 (93) | 1.53 (0.14–4.95) | 1054 (175–4050) | 12/14 (86) | 0/14 (0) | 7/14 (50) | |
| RKO | 8/8 (100) | 0.85 (0.16–1.79) | 524 (4–1292) | 6/8 (75) | Intermediate LN metastasis group | 0/8 (0) | 0/8 (0) |
| T84 | 8/9 (89) | 0.49 (0.38–0.68) | 141 (63–270) | 6/8 (75) | 1/8 (13) | 0/8 (0) | |
| HCT116 | 14/14 (100) | 1.19 (0.61–3.02) | 704 (352–1521) | 10/14 (71) | 10/14 (71) | 4/14 (29) | |
| LS174T | 7/7 (100) | 1.41 (0.66–2.84) | 800 (306–2450) | 5/7 (71) | 1/7 (14) | 0/7 (0) | |
| WiDr‐TC | 10/10 (100) | 0.87 (0.26–2.76) | 416 (27–1224) | 7/10 (70) | 2/10 (20) | 3/10 (30) | |
| COLO205 | 9/9 (100) | 0.74 (0.54–1.36) | 294 (96–810) | 6/9 (67) | 0/9 (0) | 0/9 (0) | |
| LoVo | 8/8 (100) | 0.70 (0.41–1.81) | 288 (88–1008) | 5/8 (63) | 1/8 (13) | 0/8 (0) | |
| SW480 | 8/8 (100) | 1.08 (0.42–1.27) | 486 (180–1296) | 5/8 (63) | 1/8 (13) | 0/8 (0) | |
| SW48 | 10/10 (100) | 0.60 (0.31–1.47) | 189 (50–650) | 5/10 (50) | 0/10 (0) | 0/10 (0) | |
| COLO320 | 15/15 (100) | 4.13 (0.28–13.6) | 3136 (54–12 500) | 7/15 (47) | 4/15 (27) | 3/15 (20) | |
| HCT‐15 | 9/9 (100) | 1.06 (0.37–1.85) | 448 (50–950) | 3/9 (33) | 1/9 (11) | 1/9 (11) | |
| SW620 | 8/8 (100) | 0.91 (0.62–1.31) | 496 (319–729) | 2/8 (25) | Low LN metastasis group | 1/8 (13) | 0/8 (0) |
| SW1116 | 8/9 (89) | 1.29 (0.52–1.65) | 509 (138–850) | 2/8 (25) | 0/8 (0) | 0/8 (0) | |
| DLD‐1 | 13/17 (76) | 0.41 (0.21–1.43) | 294 (72–850) | 0/13 (0) | 0/13 (0) | 1/13 (8) | |
| HCT‐8 | 9/9 (100) | 0.96 (0.54–1.63) | 607 (245–1224) | 0/9 (0) | 1/9 (11) | 4/9 (44) | |
| SW948 | 11/11 (100) | 1.19 (0.32–5.62) | 544 (64–3613) | 0/11 (0) | 0/11 (0) | 0/11 (0) | |
| Total | 228/238 (96) | NA | NA | 137/228 (60) | 29/228 (13) | 27/228 (12) | |
Twenty‐two of the studied cell lines were divided into three groups, according to the rate of their LN metastasis: high LN metastis group, incidence higher than 80%; intermediate LN metastasis group, 26%≤ 80%; low LN metastasis group, ≤25%. A, the number of mice in which CRC cells were orthotopically implanted, B, the number of mice that successfully formed local tumors in cecum; C, the number of mice with LN metastasis; D, the number of mice with liver metastasis; E, the number of mice with peritoneal dissemination; NA, not applicable.
cDNA microarray analysis. The CodeLink Uniset Human 20KI Expression Bioarray (GE Healthcare Bio‐Sciences, Piscataway, NJ, USA) was used for cDNA microarray analysis. cRNA synthesis was carried out following the manufacturer's instructions. All of the following reagents were included in the CodeLink Expression Assay Reagent Kit (GE Healthcare Bio‐Sciences). First‐strand cDNA was generated from 2 µg of total RNA using reverse transcriptase and a T7 oligo(dT) primer. Subsequently, second‐strand cDNA was produced using the Escherichia coli DNA polymerase mix and RNase H. The resultant double‐stranded cDNA was purified using the QIAquick PCR Purification Kit (Qiagen), and cRNA was generated by an in vitro transcription reaction using T7 RNA polymerase and biotin‐11‐UTP (Perkin Elmer, Boston, MA, USA). cRNA was purified on an RNeasy Mini Kit (Qiagen), quantified by spectrophotometry, and 10 µg was then fragmented by heating at 94°C for 20 min in the presence of magnesium ion. The fragmented cRNA was hybridized overnight at 37°C in hybridization buffer to each array in an Innova 4080 Shaking Incubator (New Brunswick Scientific, Edison, NJ, USA) at 300 r.p.m. for 18 h. After hybridization, the arrays were washed in 0.75 × TNT buffer (1 × TNT: 0.10 M Tris‐HCl [pH 7.6], 0.15 M NaCl, 0.05% Tween‐20) at 46°C for 1 h followed by incubation with streptavidin–Cy5 at room temperature for 30 min in the dark. The arrays were then washed in 1 × TNT twice for 5 min each followed by a rinse in 0.05% Tween‐20 in water and then dried. Glass slides were scanned using a GenePix 4000 A scanner (Axon Instruments, Union City, CA, USA) (Fig. 2a). The grids of the image spots were adjusted and their signals were analyzed using the CodeLink System Software (GE Healthcare Bio‐Sciences). For each cell line, the experiments were carried out twice, independently for all of the steps through cell culture to microarray experiment, to confirm the reproducibility of experiments. To compare the gene expression values from the various experiments, the following array‐based normalization was applied. In each array experiment, a set of values was log‐transformed and Z‐normalized by the mean and the standard deviation calculated from the 5th to 95th percentiles of all non‐marker genes. All of our cDNA microarray data were registered to the Gene Expression Omnibus site, National Center for Biotechnology Information (http://www.ncbi.nlm.nih.gov.geo).
Figure 2.
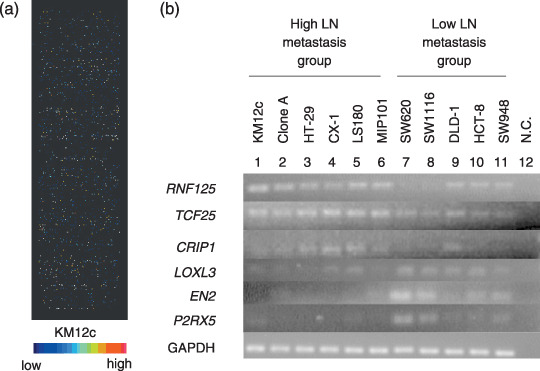
cDNA microarray and reverse transcription–polymerase chain reaction (RT‐PCR) analyses with colorectal cancer cell lines. (a) cDNA microarray using the KM12c cell line. (b) RT‐PCR with cell lines. 1–6, high lymph node (LN) metastasis group; 7–11, low LN metastasis group; N.C., negative control. Internal control is glyceraldehyde‐3‐phosphate dehydrogenase (GAPDH) mRNA.
Selection of the genes related to LN metastasis. Twenty‐two of the studied cell lines were divided, according to the rate of their LN metastasis, into three groups, the ‘high LN metastasis group’, ‘intermediate LN metastasis group’, and ‘low LN metastasis group’ as shown in Table 3. To identify the genes possibly involved in LN metastasis, the following strategy was used. The genes whose expression levels gradually increased or decreased from the low LN metastasis group to the high LN metastasis group were selected by comparing the mean expression levels among the three groups. Then an individual two‐sample t‐test was carried out on the expression values using P < 0.05 as a threshold, and the high LN metastasis and low LN metastasis groups were compared to select genes differentially expressed between the two groups (4, 5).
Table 4.
Genes highly expressed in high lymph node metastasis group (incidence > 80%) after orthotopic implantation of colorectal cancer cells onto the cecal walls of mice using Matrigel
| NCBI Acc. No. | OGS | Name | t‐value | P‐value |
|---|---|---|---|---|
| NM_017831.2 | RNF125 | Ring finger protein 125 | –5.97 | 9.34E‐05 |
| INCYTE UNIQUE | null | Null | –5.51 | 1.83E‐04 |
| NM_017976.1 | GABPB2 | GA binding protein transcription factor, beta subunit 2 | –4.92 | 4.56E‐04 |
| NM_001080496.1 | KIAA0258 | KIAA0258 | –4.82 | 5.36E‐04 |
| AF190164.1 | PRELP | Proline/arginine‐rich end leucine‐rich repeat protein | –4.80 | 5.53E‐04 |
| NM_153758.1 | IL19 | Interleukin 19 | –4.73 | 6.22E‐04 |
| NM_016535.3 | ZNF581 | Zinc finger protein 581 | –4.72 | 6.33E‐04 |
| AF132599.1 | KLF13 | Kruppel‐like factor 13 | –4.69 | 6.62E‐04 |
| NM_014972.1 | TCF25 | Transcription factor 25 (basic helix‐loop‐helix) | –4.61 | 7.58E‐04 |
| U90918.1 | NPAL3 | NIPA‐like domain containing 3 | –4.51 | 8.82E‐04 |
| AK092741.1 | CRIP1 | Cysteine‐rich protein 1 (intestinal) | –4.48 | 9.25E‐04 |
| NM_024594.2 | PANK3 | Pantothenate kinase 3 | –4.46 | 9.55E‐04 |
| N28878.1 | TMED5 | Transmembrane emp24 protein transport domain containing 5 | –4.36 | 1.14E‐03 |
| NM_001001973.1 | ATP5C1 | ATP synthase, H + transporting, mitochondrial F1 complex, gamma polypeptide 1 | –4.34 | 1.17E‐03 |
| AW665284.1 | DIAPH3 | Diaphanous homolog 3 (Drosophila) | –4.24 | 1.38E‐03 |
| NM_001398.2 | ECH1 | Enoyl Coenzyme A hydratase 1, peroxisomal | –4.12 | 1.71E‐03 |
| NM_024578.1 | OCEL1 | Occludin/ELL domain containing 1 | –4.01 | 2.05E‐03 |
| NM_139015.3 | UNQ1887 | Signal peptide peptidase 3 | –3.97 | 2.18E‐03 |
| NM_004176.3 | SREBF1 | Sterol regulatory element binding transcription factor 1 | –3.92 | 2.38E‐03 |
| NM_032376.2 | RASA4 | RAS p21 protein activator 4 | –3.83 | 2.81E‐03 |
| NM_014918.3 | CHSY1 | Carbohydrate (chondroitin) synthase 1 | –3.82 | 2.83E‐03 |
| NM_019021.1 | C11orf71 | Chromosome 11 open reading frame 71 | –3.81 | 2.87E‐03 |
| XM_042698.8 | USP22 | Ubiquitin‐specific peptidase 22 | –3.71 | 3.43E‐03 |
| NM_001706.2 | BCL6 | B‐cell CLL/lymphoma 6 (zinc finger protein 51) | –3.71 | 3.47E‐03 |
| NM_005198.3 | CHKB | Choline kinase beta | –3.67 | 3.66E‐03 |
| NM_001677.3 | ATP1B1 | ATPase, Na+/K+ transporting, beta 1 polypeptide | –3.65 | 3.80E‐03 |
| NM_017747.1 | ANKHD1 | Ankyrin repeat and KH domain containing 1 | –3.63 | 3.92E‐03 |
| NM_003826.1 | NAPG | N‐ethylmaleimide‐sensitive factor attachment protein, gamma | –3.63 | 3.97E‐03 |
| NM_032528.1 | ST6GAL2 | ST6 beta‐galactosamide alpha‐2,6‐sialyltranferase 2 | –3.54 | 4.60E‐03 |
| NM_002202.2 | ISL1 | ISL1 transcription factor, LIM/homeodomain (islet‐1) | –3.50 | 4.97E‐03 |
t‐values and P‐values were indicated with an individual two‐sample t‐test. E‐05, E‐04 and E‐03 represent 10−5, 10−4 and 10−3, respectively. NCBI Acc. No., National Center for Biotechnology Information accession number; OGS, official gene symbol.
Table 5.
Genes expressed at a low rate in high lymph node metastasis group (incidence > 80%) after orthotopic implantation of colorectal cancer cells onto the cecal walls of mice using Matrigel
| NCBI Acc. No. | OGS | Name | t‐value | P‐value |
|---|---|---|---|---|
| NM_032024.2 | C10orf11 | Chromosome 10 open reading frame 11 | 6.06 | 8.14E‐05 |
| NM_003898.2 | SYNJ2 | Synaptojanin 2 | 5.77 | 1.25E‐04 |
| NM_007375.3 | TARDBP | TAR DNA binding protein | 5.65 | 1.50E‐04 |
| NM_015481.1 | ZNF385 | Zinc finger protein 385 | 5.61 | 1.58E‐04 |
| NM_032603.2 | LOXL3 | Lysyl oxidase‐like 3 | 5.03 | 3.84E‐04 |
| NM_139344.1 | BIN1 | Bridging integrator 1 | 4.41 | 1.05E‐03 |
| NM_001427.2 | EN2 | Engrailed homolog 2 | 4.38 | 1.09E‐03 |
| NM_199160.1 | LHX6 | LIM homeobox 6 | 4.38 | 1.10E‐03 |
| NM_175080.1 | P2RX5 | Purinergic receptor P2X, ligand‐gated ion channel, 5 | 4.33 | 1.19E‐03 |
| NM_030758.2 | OSBP2 | Oxysterol binding protein 2 | 4.27 | 1.31E‐03 |
| NM_016429.1 | COPZ2 | Coatomer protein complex, subunit zeta 2 | 4.23 | 1.40E‐03 |
| NM_003670.1 | BHLHB2 | Basic helix–loop–helix domain containing, class B, 2 | 4.22 | 1.43E‐03 |
| NM_014381.1 | MLH3 | MutL homolog 3 | 4.15 | 1.62E‐03 |
| NM_002355.2 | M6PR | Mannose‐6‐phosphate receptor (cation dependent) | 4.07 | 1.85E‐03 |
| NM_003304.4 | TRPC1 | Transient receptor potential cation channel, subfamily C, member 1 | 4.07 | 1.86E‐03 |
| NM_018647.2 | TNFRSF19 | Tumor necrosis factor receptor superfamily, member 19 | 3.97 | 2.19E‐03 |
| NM_006000.1 | TUBA4A | Tubulin, alpha 4a | 3.97 | 2.20E‐03 |
| NM_001979.4 | EPHX2 | Epoxide hydrolase 2, cytoplasmic | 3.91 | 2.42E‐03 |
| NM_001755.2 | CBFB | Core‐binding factor, beta subunit | 3.91 | 2.44E‐03 |
| NM_001044385.1 | ALS2CR4 | Amyotrophic lateral sclerosis 2 (juvenile) chromosome region, candidate 4 | 3.87 | 2.59E‐03 |
| NM_004086.1 | COCH | Coagulation factor C homolog, cochlin (Limulus polyphemus) | 3.82 | 2.86E‐03 |
| NM_005899.3 | NBR1 | Neighbor of BRCA1 gene 1 | 3.78 | 3.05E‐03 |
| NM_001077445.1 | PHF16 | PHD finger protein 16 | 3.70 | 3.48E‐03 |
| NM_018330.3 | KIAA1598 | KIAA1598 | 3.61 | 4.12E‐03 |
| NM_003656.3 | CAMK1 | Calcium/calmodulin‐dependent protein kinase I | 3.59 | 4.26E‐03 |
| NM_018950.1 | HLA‐F | Major histocompatibility complex, class I, F | 3.58 | 4.29E‐03 |
| NM_145177.1 | DHRSX | Dehydrogenase/reductase (SDR family) X‐linked | 3.57 | 4.38E‐03 |
t‐values and P‐values were indicated with an individual two‐sample t‐test. E‐05, E‐04 and E‐03 represent 10−5, 10−4 and 10−3, respectively. NCBI Acc. No., National Center for Biotechnology Information accession number; OGS, official gene symbol.
RT‐PCR method and semiquantitative RT‐PCR of selected genes. Gene‐specific primer sets were designed for the selected genes, using Primer Express software version 1.5 (Applied Biosystems, Foster City, CA, USA). RT‐PCR was carried out using a TaqMan PCR Core Reagent Kit (Applied Biosystems) in a total volume of 25 µL containing 2 µL cDNA, 0.125 µL AmpliTaq Gold DNA Polymerase (5.0 U/µL; Applied Biosystems), and 200 nM of each forward and reverse primer. RT‐PCR was then carried out with the following steps: one cycle of 50°C for 2 min; one cycle of 95°C for 10 min; then 30 cycles of 95°C for 15 s, 60°C for 1 min. The amplification of the right target DNA was confirmed by 3% agarose gel electrophoresis (Fig. 2b).
Semiquantitative RT‐PCR using cDNA of cell lines or clinical samples was carried out using the Power SYBR Green PCR Master Mix (Applied Biosystems) following the manufacturer's instructions. Triplicate cDNA of each cell line or duplicate cDNA of each clinical sample was applied to 96‐well reaction plates. Thermal cycling was carried out in the following steps: one cycle of 95°C for 10 min; then 40 cycles of 95°C for 15 s, 60°C for 1 min. GAPDH was used as an endogenous control. The mRNA expression level of each gene was normalized to that of the GAPDH expression level of the corresponding sample. The relative expression level of each gene was defined by the mRNA expression level of each gene/mRNA expression level of the GAPDH ratio, and the value was represented as an AU (Fig. 3).
Figure 3.
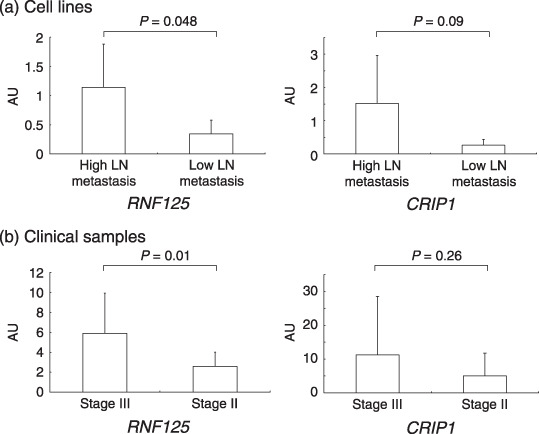
Semiquantitative reverse transcription–polymerase chain reaction analysis of RNF125 and CRIP1 mRNA expression levels in cell lines (a) and clinical samples (b) obtained from stage II and stage III patients. The relative expression levels of RNF125 or CRIP1 were defined by mRNA expression levels of ring finger protein 125 (RNF125) or cysteine‐rich intestinal protein 1 (CRIP1)/mRNA expression level of glyceraldehyde‐3‐phosphate dehydrogenase (GAPDH) ratio, represented as arbitrary units (AU). All data are the mean ± SD of values analyzed in triplicate using cDNA of cell lines or duplicate using cDNA of clinical samples.
Statistical analysis. The statistical significance of the mean AU on semiquantitative RT‐PCR between the high LN metastasis and low LN metastasis groups, or that between the patients at Stage III and Stage II, was determined with Student's t‐test. The computer program Statcel2 Software (OMS Publishing, Saitama, Japan) was used for statistical analysis. Values of P < 0.05 were considered to be statistically significant.
Results
Local tumor formation and their histological findings. Cancer cells were orthotopically implanted with Matrigel onto the cecal walls of 10–20 mice using 22 types of CRC cell lines (Table 1; Fig. 1a). A total of 294 mice were orthotopically implanted with CRC cell lines (Table 3) and 56 out of 294 mice (19%) died within 6 weeks after implantation possibly due to infection, bowel adhesion, or other reasons. The local tumor formation was accomplished in 228 out of 238 mice (96%) (Table 3). With most cell lines, local tumor formation was established in all of the orthotopically implanted mice. The median tumor weight and volume differed among the 22 cell lines (Table 3). Within the COLO320, which has been reported to produce serotonin and epinephrine,( 20 ) formed the largest tumors among all cell lines, and the median tumor weight was 4.13 g (range, 0.28–13.6 g) and the median tumor volume was 3136 mm3 (range, 54–12 500 mm3).
Mesenteric LN metastasis draining the cecal area. The incidence of LN metastasis differed among the 22 cell lines, as shown in Table 3. Two of the 22 cell lines, KM12c and Clone A, showed LN metastasis in all mice with orthotopic implantation and the rate of LN metastasis was high in HT‐29 (17/18, 94%), CX‐1 (12/13, 92%), and LS180 (11/12, 92%). In contrast, DLD‐1 (0/13), HCT‐8 (0/9), and SW948 (0/11) did not show any LN metastases. The rate of LN metastasis did not correlate with the tumor weight or volume of orthotopically implanted tumors.
Liver metastasis. Liver metastasis was first assessed macroscopically and then microscopically (Fig. 1e,f). Several cell lines including HCT116 (10/14, 71%) and CX‐1 (4/13, 31%) frequently formed liver metastasis. However, most of the cell lines tested rarely or never metastasized to liver (Table 3).
Lung metastasis and peritoneal dissemination. Lung metastasis was also assessed microscopically following the macroscopic observations. Lung metastasis was only observed in HCT116 (4/14, 29%). Peritoneal dissemination was detected in 27 out of 228 mice (12%), with a particularly high incidence in MIP101 (7/14, 50%) and HCT‐8 (4/9, 44%) (Table 3).
cDNA microarray analysis and isolation of genes involved in LN metastasis. On average, 13 093 (65.5%) out of the 19 982 probes in 44 microarray experiments were ‘expressed genes’ that gave larger expression values than the ‘raw threshold’ calculated from a set of bacterial marker genes (Fig. 2a).
To isolate the genes possibly involved in LN metastasis, the cell lines were divided into three groups according to the rate of LN metastasis: high LN metastasis group, with the incidence higher than 80% (KM12c, Clone A, HT‐29, CX‐1, LS180, and MIP101); intermediate LN metastasis group, 26%≤ 80% (RKO, T84, HCT116, LS174T, WiDr‐Tc, COLO205, LoVo, SW480, SW48, COLO320, and HCT‐15), and low LN metastasis group, ≤25% (SW620, SW1116, DLD1, HCT‐8, and SW948) (Table 3). Among the three groups, the expression levels of 6636 genes gradually increased from the low LN metastasis group to the high LN metastasis group, and expression levels of 2312 genes gradually decreased. Comparing the high LN metastasis and low LN metastasis groups, 422 genes were highly expressed in the high LN metastasis group (P < 0.05) and 214 genes were low (P < 0.05). Genes that were differentially expressed with P < 0.005 are listed in 4, 5.
Gene expression levels using RT‐PCR and semiquantitative RT‐PCR. Among the genes listed in 4, 5, we focused on those genes whose official gene symbols could be found and whose descriptions were clearly identified in the National Center for Biotechnology Information database. Primers were designed and RT‐PCR was carried out for the 15 genes that were top‐ranked in Table 4 or Table 5. Among those genes, RNF125, TCF25, CRIP1, LOXL3, EN2, and P2RX5 showed differential expressions with RT‐PCR between the high LN metastasis group and low LN metastasis group (Fig. 2b). We also examined the expression levels of those six genes with semiquantitative RT‐PCR in both cell lines and clinical samples from CRC patients. The relative expression level of RNF125 in the high LN metastasis group (six cell lines) was 1.1 ± 0.7 AU, and that in low LN metastasis group (five cell lines) was 0.3 ± 0.2 AU (Fig. 3a). The relative expression level of CRIP1 in the high LN metastasis group was 1.5 ± 1.4 AU, and that in the low LN metastasis group was 0.3 ± 0.2 AU (Fig. 3a). The relative expression level of the RNF125 gene in clinical samples was significantly different between the CRC patients at Stage III (n = 14, 5.9 ± 4.0 AU) and those at Stage II (n = 12, 2.6 ± 1.4 AU) (P = 0.01) (Fig. 3b). The relative expression of the CRIP1 gene in clinical samples was different between Stage III (11.3 ± 17.3 AU) and Stage II (5.1 ± 6.7 AU), although the difference was not statistically significant (Fig. 3b). For the other four genes, no difference was evident between Stage III and Stage II (data not shown).
Discussion
In the present study, genes that could play important roles in LN metastasis of CRC were isolated by combining the data of the orthotopic implantation mice model, using 22 CRC cell lines with Matrigel in vivo, and the gene expression profiles of cDNA microarray with corresponding CRC cell lines in vitro. Concerning the orthotopic implantation animal model, Cespedes et al. used orthotopic cell microinjection without Matrigel,( 21 ) and the incidence of implanted tumor formation using three human CRC cells was 75–88%. In our study, most of the cell lines showed a higher incidence of orthotopic tumor formation than that reported by Cespedes, with over 95% tumor formation on the whole, and the incidence of LN metastasis varied from 0 to 100% among the cell lines. Bao et al. reported that Matrigel facilitated not only the growth but also the metastasis of tumors formed by the orthotopic implantation of human breast carcinoma cell lines in nude mice.( 10 )
In the orthotopic implantation analysis, CRC cell lines showed different incidences of metastasis to LN, liver, or lung, as were observed clinicopathologically in CRC patients. The mice that had CRC cells orthotopically implanted showed LN metastasis in 60% (137/228) (Table 3), liver metastasis in 13% (29/228), and lung metastasis in 1.7% (4/228). Although the incidence of liver or lung metastasis was lower than that in the report by Cespedes et al.,( 21 ) these data were consistent with the frequency of synchronous distant metastasis of CRC patients in Japan (liver metastasis 10.7%, lung metastasis 1.6%).( 3 ) The incidence of peritoneal dissemination was 12% (Table 3) in this experiment, higher than that observed in human CRC patients. Peritoneal dissemination was observed in some cell lines originating from poorly differentiated adenocarcinomas such as MIP101, and the dissemination might depend on characteristics of those cells themselves.
Comparing the rates of LN metastasis in each cell line to their gene expression profiles on cDNA microarray in vitro, 636 candidate genes were isolated (P < 0.05) whose expression levels were correlated with the rates of LN metastasis, and highly ranked genes are listed in 4, 5 (P < 0.005). Semiquantitative RT‐PCR showed that the relative expression level of the RNF125 gene was significantly different between the high and low LN metastasis groups, and also between clinical samples of CRC patients at Stage III and those at Stage II (P = 0.01) (Fig. 3a,b). A recent study showed that RNF125, previously known as an E3 ubiquitin ligase serving a positive regulatory role in T cell activation,( 22 ) functions as an E3 ligase for RIG‐I ubiquitin conjugation.( 23 ) RIG‐I plays an important role in viral infection, by detecting viral components or dsRNA and inducing the production of cytokines necessary to activate innate and adaptive immune responses. Recently, Su et al. reported that RIG‐I might also possess tumor suppressor activities.( 24 ) Ubiquitin‐conjugated RIG‐I is degraded in a proteasome‐dependent manner. It has recently become clear that the ubiquitin–proteasome system is directly involved in cell proliferation and differentiation, regulating cell cycle genes, signaling factors, and transcription factors.( 25 ) In the present study, RNF125 was highly expressed in the high LN metastasis group rather than the low LN metastasis group, and also highly expressed in CRC patients at Stage III rather than those at Stage II. Considering this background, we also carried out semiquantitative RT‐PCR for RIG‐I using CRC cell lines and clinical samples and a Western blot analysis using CRC cell lines. With RT‐PCR, the relative expression level of RIG‐I in the high LN metastasis group was 0.8 ± 0.5 AU, and that in the low LN metastasis group was 0.5 ± 0.3 AU, but no significant difference was observed between the two groups. Western blot analysis using rabbit anti‐RIG‐I polyclonal antibody (Cat. No.: 54285; AnaSpec, San Jose, CA, USA) did not show any evidence of difference either (data not shown). RNF125 might be working on LN metastasis in CRC cells in a different pathway to the RIG‐I‐regulated pathway. To clarify the mechanisms, it will be necessary to examine the effects of knockdown of RNF125 on capabilities of proliferation or invasion in CRC cell lines in the next study.
In addition to RNF125, the relative expression level of CRIP1 was high in the high LN metastasis group and CRC patients at Stage III, although the difference was not significant (Fig. 3a,b). It was reported that CRIP1 might be involved in intestinal zinc transport,( 26 ) but it is unclear why CRIP1 was extracted in this analysis and how CRIP1 is involved in LN metastasis. Although it is still not clear how CRIP1 is involved in the roles of LN metastasis, it is necessary to analyze its function concomitant with other genes relating to LN metastasis, and it might also be useful in predicting LN metastasis using genes as a set of biomarkers.
We repeated the expression analysis for the genes extracted in this study (4, 5) using semiquantitative RT‐PCR to re‐confirm the expected results observed in the cDNA microarray. However, the results of semiquantitative RT‐PCR with the clinical samples did not necessarily correlate with the results of RT‐PCR of CRC cell lines. The discrepancy of the results must be addressed, possibly by accounting for the coexistence of both cancer cells and stromal cells that might be affecting each other in tumor tissues.
The role of systemic adjuvant chemotherapy in CRC patients with LN metastasis has been established in a large number of clinical trials. However, its role for CRC patients at Stage II has not been well established yet.( 27 , 28 , 29 ) A recent meta‐analysis of prospective randomized clinical trials of adjuvant chemotherapy in patient with Dukes’ B tumors, which do not have LN metastasis, has not shown a survival benefit of chemotherapy,( 30 ) but a significant proportion of Dukes’ B patients (25–30%) develop recurrence and metastasis, resulting in cancer death.( 31 ) Recently, molecular and biological approaches to CRC patients at Stage II have been reported. Wang et al. suggested an algorithm of microarray gene expression data that identifies CRC patients at Stage II at high risk for disease recurrence.( 31 ) Al‐Mulla et al. attempted to identify the subset of CRC patients at Stage I and II who might relapse with metastatic disease using genome‐wide scanning DNA methodologies such as microarray comparative genomic hybridization.( 32 ) The classification of CRC patients with Dukes’ B and C using gene expression arrays has been reported as well.( 33 , 34 ) It is of utmost importance to develop crucial molecular markers that could predict which patients are at high risk for disease recurrence.
In conclusion, this study confirmed that the orthotopic implantation of human CRC cell lines with Matrigel was useful as a model mimicking the behavior of human CRC. In addition, candidate genes involved in LN metastasis of CRC were identified by combining the data of LN metastasis with an orthotopic implantation mouse model with that of gene expression profiles of cDNA microarray. If CRC patients at Stage II at high risk for LN metastasis could be identified with the analysis of genes isolated in the current research, it will be advantageous. To better tailor the therapy to each patient, molecular markers therefore need to be identified that will accurately predict both the prognosis and the response to chemotherapy.
Acknowledgments
Grant No. 15659304 for cancer research from the Ministry of Education, Culture, Sports, Science, and Technology of Japan (T. Mizoi). We are grateful to Drs K. Hoshi, A. Oyama, Y. Hasegawa, N. Tanaka, K. Takami (Tohoku University) for helpful discussions and technical advice, Ms E. Shibuya, H. Fujimura, and K. Inabe for technical assistance, and Dr A. Itoh for animal care.
References
- 1. Ajiki W, Tsukuma H, Oshima A. Cancer incidence and incidence rates in Japan in 1999: estimates based on data from 11 population‐based cancer registries. Jpn J Clin Oncol 2004; 34: 352–6. [DOI] [PubMed] [Google Scholar]
- 2. Statistics and Information Department Minister's Secretariat, Ministry of Health Labour and Welfare . Vital Statistics in Japan, Trends Up to 2004. Tokyo, Japan: Health and Welfere Statistics Association Publisher, 2006. (in Japanese). [Google Scholar]
- 3. Japanese Society for Cancer of the Colon and Rectum . Treatment Guidelines on Cancer of the Colon, Rectum and Anus. Tokyo, Japan: Kanehara Publishers, 2005. (in Japanese). [Google Scholar]
- 4. Kleinman HK, McGarvey ML, Liotta LA, Robey PG, Tryggvason K, Martin GR. Isolation and characterization of type IV procollagen, laminin, and heparan sulfate proteoglycan from the EHS sarcoma. Biochemistry 1982; 21: 6188–93. [DOI] [PubMed] [Google Scholar]
- 5. Yoshida Y, Kamitani N, Sasaki H, Kusumi K, Tominaga T, Kotsuji F. Establishment of a liver metastatic model of human ovarian cancer. Anticancer Res 1998; 18: 327–31. [PubMed] [Google Scholar]
- 6. Fridman R, Giaccone G, Kanemoto T, Martin GR, Gazdar AF, Mulshine JL. Reconstituted basement membrane (Matrigel) and laminin can enhance the tumorigenicity and the drug resistance of small cell lung cancer cell lines. Proc Natl Acad Sci USA 1990; 87: 6698–702. [DOI] [PMC free article] [PubMed] [Google Scholar]
- 7. Fridman R, Kibbey MC, Royce LS et al . Enhanced tumor growth of both primary and established human and murine tumor cells in athymic mice after coinjection with Matrigel. J Natl Cancer Inst 1991; 83: 769–74. [DOI] [PubMed] [Google Scholar]
- 8. Noel A, Simon N, Raus J, Foidart JM. Basement membrane components (Matrigel) promote the tumorigenicity of human breast adenocarcinoma MCF7 cells and provide an in vivo model to assess the responsiveness of cells to estrogen. Biochem Pharmacol 1992; 43: 1263–7. [DOI] [PubMed] [Google Scholar]
- 9. Topley P, Jenkins DC, Jessup EA, Stables JN. Effect of reconstituted basement membrane components on the growth of a panel of human tumour cell lines in nude mice. Br J Cancer 1993; 67: 953–8. [DOI] [PMC free article] [PubMed] [Google Scholar]
- 10. Bao L, Matsumura Y, Baban D, Sun Y, Tarin D. Effects of inoculation site and Matrigel on growth and metastasis of human breast cancer cells. Br J Cancer 1994; 70: 228–32. [DOI] [PMC free article] [PubMed] [Google Scholar]
- 11. Yue W, Brodie A. MCF‐7 human breast carcinomas in nude mice as a model for evaluating aromatase inhibitors. J Steroid Biochem Mol Biol 1993; 44: 671–3. [DOI] [PubMed] [Google Scholar]
- 12. Wilson MJ, Sinha AA. Human prostate tumor angiogenesis in nude mice: metalloprotease and plasminogen activator activities during tumor growth and neovascularization of subcutaneously injected Matrigel impregnated with human prostate tumor cells. Anat Rec 1997; 249: 63–73. [DOI] [PubMed] [Google Scholar]
- 13. Pretlow TG, Delmoro CM, Dilley GG, Spadafora CG, Pretlow TP. Transplantation of human prostatic carcinoma into nude mice in Matrigel. Cancer Res 1991; 51: 3814–17. [PubMed] [Google Scholar]
- 14. Tsutsumi S, Kuwano H, Morinaga N, Shimura T, Asao T. Animal model of para‐aortic lymph node metastasis. Cancer Lett 2001; 169: 77–85. [DOI] [PubMed] [Google Scholar]
- 15. Takahashi T, Morotomi M, Nomoto K. A novel mouse model of rectal cancer established by orthotopic implantation of colon cancer cells. Cancer Sci 2004; 95: 514–9. [DOI] [PMC free article] [PubMed] [Google Scholar]
- 16. Nguyen ST, Hasegawa S, Tsuda H et al . Identification of a predictive gene expression signature of cervical lymph node metastasis in oral squamous cell carcinoma. Cancer Sci 2007; 98: 740–6. [DOI] [PMC free article] [PubMed] [Google Scholar]
- 17. Fujiwara K, Ochiai M, Ubagai T et al . Differential gene expression profiles in colon epithelium of two rat strains with distinct susceptibility to colon carcinogenesis after exposure to PhIP in combination with dietary high fat. Cancer Sci 2003; 94: 672–8. [DOI] [PMC free article] [PubMed] [Google Scholar]
- 18. Bertucci F, Salas S, Eysteries S et al . Gene expression profiling of colon cancer by DNA microarrays and correlation with histoclinical parameters. Oncogene 2004; 23: 1377–91. [DOI] [PubMed] [Google Scholar]
- 19. Japanese Society for Cancer of the Colon and Rectum . General Rules for Clinical and Pathological Studies on Cancer of the Colon, Rectum and Anus, 6th edn. Tokyo, Japan: Kanehara Publishers, 1998. (in Japanese). [Google Scholar]
- 20. Quinn LA, Moore GE, Morgan RT, Woods LK. Cell lines from human colon carcinoma with unusual cell products, double minutes, and homogeneously staining regions. Cancer Res 1979; 39: 4914–24. [PubMed] [Google Scholar]
- 21. Cespedes MV, Espina C, Garcia‐Cabezas MA et al . Orthotopic microinjection of human colon cancer cells in nude mice induces tumor foci in all clinically relevant metastatic sites. Am J Pathol 2007; 170: 1077–85. [DOI] [PMC free article] [PubMed] [Google Scholar]
- 22. Zhao H, Li CC, Pardo J et al . A novel E3 ubiquitin ligase TRAC‐1 positively regulates T cell activation. J Immunol 2005; 174: 5288–97. [DOI] [PubMed] [Google Scholar]
- 23. Arimoto K, Takahashi H, Hishiki T, Konishi H, Fujita T, Shimotohno K. Negative regulation of the RIG‐I signaling by the ubiquitin ligase RNF125. Proc Natl Acad Sci USA 2007; 104: 7500–5. [DOI] [PMC free article] [PubMed] [Google Scholar]
- 24. Su ZZ, Sarkar D, Emdad L, Barral PM, Fisher PB. Central role of interferon regulatory factor‐1 (IRF‐1) in controlling retinoic acid inducible gene‐I (RIG‐I) expression. J Cell Physiol 2007; 213: 502–10. [DOI] [PubMed] [Google Scholar]
- 25. Voutsadakis IA. Pathogenesis of colorectal carcinoma and therapeutic implications: the roles of the ubiquitin–proteasome system and Cox‐2. J Cell Mol Med 2007; 11: 252–85. [DOI] [PMC free article] [PubMed] [Google Scholar]
- 26. Hempe JM, Cousins RJ. Cysteine‐rich intestinal protein binds zinc during transmucosal zinc transport. Proc Natl Acad Sci USA 1991; 88: 9671–4. [DOI] [PMC free article] [PubMed] [Google Scholar]
- 27. Monga DK, O’Connell MJ. Surgical adjuvant therapy for colorectal cancer: current approaches and future directions. Ann Surg Oncol 2006; 13: 1021–34. [DOI] [PubMed] [Google Scholar]
- 28. Wolpin BM, Meyerhardt JA, Mamon HJ, Mayer RJ. Adjuvant treatment of colorectal cancer. CA Cancer J Clin 2007; 57: 168–85. [DOI] [PubMed] [Google Scholar]
- 29. Benson AB 3rd, Schrag D, Somerfield MR et al . American Society of Clinical Oncology recommendations on adjuvant chemotherapy for stage II colon cancer. J Clin Oncol 2004; 22: 3408–19. [DOI] [PubMed] [Google Scholar]
- 30. International Multicentre Pooled Analysis of B2 Colon Cancer Trials (IMPACT B2 ) Investigators . Efficacy of adjuvant fluorouracil and folinic acid in B2 colon cancer. J Clin Oncol 1999; 17: 1356–63. [PubMed] [Google Scholar]
- 31. Wang Y, Jatkoe T, Zhang Y et al . Gene expression profiles and molecular markers to predict recurrence of Dukes’ B colon cancer. J Clin Oncol 2004; 22: 1564–71. [DOI] [PubMed] [Google Scholar]
- 32. Al‐Mulla F, Behbehani AI, Bitar MS, Varadharaj G, Going JJ. Genetic profiling of stage I and II colorectal cancer may predict metastatic relapse. Mod Pathol 2006; 19: 648–58. [DOI] [PubMed] [Google Scholar]
- 33. Kwon HC, Kim SH, Roh MS et al . Gene expression profiling in lymph node‐positive and lymph node‐negative colorectal cancer. Dis Colon Rectum 2004; 47: 141–52. [DOI] [PubMed] [Google Scholar]
- 34. Frederiksen CM, Knudsen S, Laurberg S, Orntoft TF. Classification of Dukes’ B and C colorectal cancers using expression arrays. J Cancer Res Clin Oncol 2003; 129: 263–71. [DOI] [PMC free article] [PubMed] [Google Scholar]