

Abstract
Cantharidin is an active constituent of mylabris, a traditional Chinese medicine. It is a potent and selective inhibitor of protein phosphatase 2A (PP2A) that plays an important role in control of cell cycle, apoptosis, and cell‐fate determination. Owing to its antitumor activity, cantharidin has been frequently used in clinical practice. In the present study, we investigated the therapeutic potential of cantharidin in pancreatic cancer. Cantharidin efficiently inhibited the growth of pancreatic cancer cells, but presented a much lighter toxicity effect against normal pancreatic duct cells. It caused G2/M cell‐cycle arrest that was accompanied by the down‐regulation of cyclin‐dependent kinase 1 (CDK1) and up‐regulation of p21 expression. It induced apoptosis and elevated the expressions of pro‐apoptotic factors tumor necrosis factor‐α (TNF‐α), TNF‐related apoptosis inducing receptor 1 (TRAILR1), TRAILR2, Bad, Bak, and Bid, and decreased the expression of anti‐apoptotic Bcl‐2. Activation of caspase‐8 and caspase‐9 suggested that both extrinsic and intrinsic pathways are involved in the induction of apoptosis. Interestingly, unlike previous studies on other cancer cells, we found that the inhibitory role of cantharidin is independent of oxidative stress in pancreatic cancer cells. Mitogen‐activated protein kinases (MAPKs), including ERK, JNK, and p38, were activated after treatment with cantharidin. Inhibition of JNK, but not ERK or p38, alleviated the cytotoxity effect of cantharidin, suggesting cantharidin exerted its anticancer effect through the JNK‐dependent way. Hence, in addition to being an attractive candidate compound with therapeutic potential, cantharidin also highlighted the possibility of using PP2A as a therapeutic target for pancreatic cancer treatment.
(Cancer Sci 2010; 101: 1226–1233)
Pancreatic cancer is one of the most lethal human cancers with average 4‐ to 6‐month survival time after diagnosis. It causes about 30 000 and 40 000 annual deaths in the USA and Europe, respectively, and is currently the sixth leading cause of death due to malignant diseases in China.( 1 , 2 ) These poor outcomes can be attributed to obscure and nonspecific symptoms and clinical manifestations that complicate the early diagnosis of pancreatic cancer. At the time of diagnosis, 80% of the patients could not be administered an effective curative surgical treatment.( 1 , 2 ) Only palliative therapy was administered to these patients, which actually does not provide significant improvement in terms of the long‐term survival rate.( 3 ) Therefore, new treatments against this aggressive neoplasm are urgently needed.
Natural products and their derivatives have been used in cancer treatment. For instance, vinca alkaloids, taxanes, and camptothecins have been used commonly in cancer chemotherapy.( 4 ) The dried body of mylabris, which is a Chinese blister beetle, has been used as a traditional Chinese medicine for more than 2000 years and is still being used as a folk medicine.( 5 ) The active constituent of mylabris is cantharidin – a potent and selective inhibitor of PP2A.( 6 ) PP2A plays an important role in the regulation of cell cycle, apoptosis, growth, and cell‐fate determination.( 7 ) In recent studies, cantharidin and its derivatives have shown strong in vitro antitumor activity against the cells of various cancers such as leukemia,( 8 ) colorectal carcinoma,( 9 ) hepatoma,( 10 ) bladder carcinoma,( 11 ) and breast cancer.( 12 ) In clinical trials, cantharidin and its analogs have shown therapeutic effects against primary hepatoma, including cases at the advanced stage without the suppression of the bone marrow,( 5 , 13 ) suggesting the potential for applying cantharidin to the treatment of pancreatic cancer which nearly always has a late diagnosis.( 1 , 2 , 3 ) In the present study, we have investigated the possible antitumor function of cantharidin in pancreatic cancer cells and the underlying mechanisms associated with this activity.
Materials and Methods
Cell lines and cultures.
Human pancreatic cancer cell lines, namely, PANC‐1, CFPAC‐1, BxPC‐3, and Capan‐1, were purchased from the American Type Culture Collection (Manassas, VA, USA) and maintained in DMEM (Gibco, Grand Island, NY, USA) supplemented with 10% FCS (Hyclone, Logan, UT, USA), 100 units/mL penicillin, and 100 mg/mL streptomycin. The cultures were incubated at 37°C in a humidified atmosphere with 5% CO2. Cells were passaged every 2–3 days to obtain an exponential growth.
Isolation and culture of normal pancreatic duct cells.
Human and rat pancreatic duct cells were isolated with the help of Dr Tao Yang (Department of Endocrinology, The First Affiliated Hospital of Nanjing Medical University). The protocol on human pancreatic duct cells of surgical samples was approved by the Jiangsu Province Hospital Ethics Committee (The First Affiliated Hospital of Nanjing Medical University). Animal studies were performed according to guidelines established by the Research Animal Care Committee of Nanjing Medical University. Human and rat pancreatic duct cells and islets isolation and culture techniques have been described previously.( 14 , 15 ) Briefly, pancreata of surgical human samples and male Sprague–Dawley rats (Shanghai Laboratory Animal Centre, Chinese Academy of Sciences, Shanghai, China) were digested with 1.5 mg/mL collagenase P (Roche, Indianapolis, IN, USA), and 0.5 mg/mL collagenase V (Roche) respectively. After purification on continuous Ficoll gradients (Sigma, St. Louis, MO, USA), cells from the top (1.062 density) and middle (1.096 density) layers were harvested. Human pancreatic duct cells were cultured in CMRL 1066 medium (Invitrogen, Carlsbad, CA, USA) containing 5.6 mm glucose and 10% FCS (Hyclone). Rat pancreatic duct cells were cultured in RPMI‐1640 medium (Invitrogen) supplemented with 20 ng/mL EGF (Sigma), 20 ng/mL bFGF (Sigma), 71.5 μmβ‐mercaptoethanol, and 10% FCS (Hyclone).
Reagents.
Cantharidin, okadaic acid (OA), PD98059, SP600125 and SB203580 were purchased from Biomol International (Plymouth Meeting, PA, USA). Further, NAC was purchased from Sigma. Rabbit anti‐cyclin A and rabbit anti‐cyclin B2 were purchased from Biosynthesis Biotechnology (Beijing, China). Rabbit anti‐CDK1, rabbit anti‐Bcl‐2, rabbit anti‐phospho‐ERK (Thr202/Tyr204), rabbit anti‐ERK, rabbit anti‐phospho‐JNK (Thr183/Tyr185), rabbit anti‐JNK, rabbit anti‐phospho‐p38 (Thr180/Tyr182), and rabbit anti‐p38, antibodies were purchased from Cell Signaling Technology (Beverly, MA, USA). Mouse anti‐p21, mouse anti‐Bad, goat anti‐Bak, goat anti‐TNF‐α, goat anti‐TRAILR1, mouse anti‐TRAILR2, and mouse anti‐β‐actin antibodies were purchased from Santa Cruz Biotechnologies (Santa Cruz, CA, USA).
MTT assay.
Cellular growth was evaluated by MTT assay.( 16 ) Cells were seeded at a concentration of 5 × 10³/well in 96‐well plates. After treatment for 24, 48, and 72 h, MTT (Sigma) was added to each well at a final concentration of 0.5 mg/mL, followed by incubation at 37°C for 4 h. Then, the medium was removed and 200 μL of DMSO was added to each well. The absorbance of the mixture was measured at 490 nm using a microplate ELISA reader (Bio‐Rad Laboratories, Hercules, CA, USA). The inhibition rate was calculated as follows: inhibition rate = [(mean control absorbance − mean experimental absorbance)/mean control absorbance] × 100 (%). To evaluate the effect of cantharidin on celluar growth, the concentration that caused 50% growth inhibition (IC50) was calculated by the modified Kärbers method( 17 ) according to the formula: IC50 = log−1[X k‐i (ΣP − 0.5)], in which X k represents the logarithm of the highest drug concentration; i is that of ratio of adjacent concentration; and ΣP is the sum of the percentage of growth inhibition at various concentrations.
Serine/threonine phosphatase assay.
The activity of PP2A was analyzed by using the nonradioactive serine/threonine‐phosphatase assay kit (Promega, Madison, WI, USA) according to the manufacturer’s protocol. In brief, the supernatant of the cell lysate was passed twice through a Sephadex G‐25 spin column to remove the free phosphate. The eluant was added into 96‐well plates, and the assay was performed in the presence of a PP2A‐specific serine/threonine phosphopeptide substrate (RRApTVA, in which pT represents phosphothreonine). Molybdate dye solution was then added to the wells and color development was observed after incubation for 30 min at room temperature. The absorbance was measured at 630 nm on a microplate ELISA reader (Bio‐Rad Laboratories), and the amount of phosphate released was calculated using the standard curve. The relative activity of PP2A was calculated according to the following equation: PP2A activity = (mean experimental phosphate amount/mean control phosphate amount) × 100 (%).
Clone‐formation assay.
Plate clone‐formation assay was performed to evaluate the effect of cantharidin on cellular growth. In brief, cells were seeded at a density of 100 cells/well in six‐well plates, and were cultured in media containing 1 μm or 3 μm cantharidin. After 10 days, the cells were washed with PBS and stained with 1% methylrosanilinium chloride solution. The number of visible colonies was counted and the clone‐formation rate was calculated according to the following equation: clone formation rate = (the number of colonies) × 100 (%).
Cell cycle analysis.
Cell cycle was analyzed as described by Nicoletti et al. ( 18 ) Before treatment, serum was deprived for 24 h to synchronize cell cycle.( 19 ) Then, serum was added back, and meanwhile various concentrations of cantharidin were added. After treatment with cantharidin for 24 and 48 h, the cells were fixed with 80% cooled ethanol, and incubated with 0.5% Triton X‐100 solution containing 1 mg/mL RNase A at 37°C for 30 min. Next, PI (Sigma) was added into the wells at a final concentration of 50 μg/mL, followed by 30‐min incubation in the dark. Cellular DNA content was analyzed by a FACS (Becton Dickinson, Franklin Lakes, NJ, USA). Data were processed using WinMDI29 software (Becton Dickinson).
Apoptosis assays.
Apoptosis was studied by using an Annexin V‐EGFP/PI Apoptosis Detection Kit (KeyGen, Nanjing, China) according to the manufacturer’s instructions. This assay is based on the translocation of phosphatidylserine from the inner leaflet of the plasma membrane to the cell surface in early apoptotic cells.( 20 ) Briefly, after treatment with cantharidin for 24 h, cells were resuspended in a binding buffer. Next, annexin V‐EGFP and PI were added and the solution was incubated at room temperature for 15 min in the dark; subsequently, flow cytometry analysis was performed by a FACS (Becton Dickinson). The percentage of apoptosis was computed using CellQuest software (Becton Dickinson).
Caspase‐8 and caspase‐9 activity assays.
Caspase‐8 and caspase‐9 activities were analyzed using the caspase‐8 and caspase‐9 activity assay kits (Beyotime, Nantong, China) according to the manufacturer’s protocol. Cells were lysed and total cellular protein extracts were quantified using a protein‐assay kit (Bio‐Rad Laboratories). Next, an equal amount of total protein extract was incubated at 37°C overnight with either Ac‐IETD‐pNA for caspase‐8 assay or Ac‐LEHD‐pNA for caspase‐9 assay. The release of pNA was estimated by determining the absorbance at 405 nm on a microplate ELISA reader (Bio‐Rad Laboratories). The relative activity of caspases was calculated as follows: caspase activity = (mean experimental absorbance/mean control absorbance) × 100 (%).
RT‐PCR.
RT‐PCR was performed to estimate the mRNA expressions of genes associated with cell‐cycle regulation or apoptosis. In brief, total RNA was extracted using Trizol reagent (Invitrogen). Reverse transcription was performed using the A3500 AMV RT‐PCR system (Promega). The primers used in PCR are shown in Table 1. The products of the RT‐PCR reaction were electrophoresed on 1% agarose gels, visualized by ethidium bromide staining, and quantified using Quantity One software (Bio‐Rad Laboratories). β‐Actin was used as the internal positive control and reference gene for the normalization of PCR cycle numbers, which ensures a linear amplification of templates in each experiment.
Table 1.
PCR primers of either cell‐cycle‐ or apoptosis‐associated genes
| Genes | Primers (5′‐3′) | Product size (bp) | |
|---|---|---|---|
| Sense | Anti‐sense | ||
| G2/M cell cycle | |||
| Cyclin A | gctatcctcgtggactggtt | cagcaataactgatggcaaatac | 436 |
| Cyclin B1 | gtcaccaggaactcgaaaa | tccagtgacttcccgacc | 585 |
| Cyclin B2 | acggtgtccagtgatttg | atcttcgttatcaatgtcctc | 351 |
| Cyclin H | agccagcaatgccaagat | cagaatgacatcgctccaact | 633 |
| p21 | ggacctgtcactgtcttgtacc | ttcctgtgggcggattag | 177 |
| CDK1 (CDC2) | ccctcctggtcagtacatg | gctaggcttcctggtttcc | 468 |
| CDK7 | tgtgggctgttggctgta | ttcttgggcaatcctcct | 442 |
| Apoptosis | |||
| Death receptor pathway | |||
| Fas | ttctgccataagccctgtc | ttggtgttgctggtgagtg | 320 |
| FasL | tcttccctgtccaacctct | tgagttggacttgcctgtt | 379 |
| TNF‐α | ctccaggcggtgcttgttc | tggtaggagacggcgatgc | 414 |
| TRAIL | aagtggcattgcttgtttct | ttgatgattcccaggagttta | 320 |
| TRAILR1 (DR4) | ttgttgcatcggctcaggtt | gaggcgttccgtccagtttt | 489 |
| TRAILR2 (DR5) | acccttgtgctcgttgtcgc | tgggctggaggtcaccgtct | 498 |
| DR6 | gggaccaaggagacagacaacg | ccacaatcaccacaagcaccag | 493 |
| Bcl‐2 family | |||
| Anti‐apoptosis | |||
| Bcl‐2 | tcgccctgtggatgactgag | cagagtcttcagagacagccagga | 143 |
| Bcl‐Xl | gggactgaatcggagatggaga | gctggacggaggatgtggtg | 650 |
| MCL‐1 isoform 1 | cagcgacggcgtaacaaa | ccaccctaccatcttcactaaatc | 584 |
| Pro‐apoptosis | |||
| Bax | tcaggatgcgtccaccaa | gttgaagttgccgtcagaaa | 166 |
| Bcl‐Xs | gggactgaatcggagatggaga | gctggacggaggatgtggtg | 551 |
| Bad | tcccagagtttgagccga | ccaagttccgatcccacc | 468 |
| Bak | ggacgacatcaaccgacgctat | tctgaaccgggacccaaagg | 424 |
| Bid | cagtgggagggctacgat | taggtgcgtaggttctggtta | 407 |
| Bik | ctggaccctatggaggactt | cagtctggtcgtagatgaaagc | 178 |
| Bim | ccctacagacagagccaca | attcgtgggtggtcttcg | 439 |
| MCL‐1 isoform 2 | ccgcttgaggagatggaa | ccaccctaccatcttcactaaatc | 781 |
| Internal control | |||
| β‐Actin | cccagagcaagagaggcatc | catgatctgggtcatcttctcg | 197 |
CDK, cyclin‐dependent kinase; DR, death receptor; TNF‐α, Tumor necrosis factor‐α; TRAILR, TNF‐related apoptosis inducing receptor.
Western blot analysis.
Total protein was extracted using a lysis buffer containing 50 mm Tris–HCl (pH 7.4), 150 mm NaCl, 1% Triton X‐100, 0.1% SDS, 1 mm EDTA, supplemented with protease inhibitors (10 mg/mL leupeptin, 10 mg/mL aprotinin, 10 mg/mL pepstatin A, and 1 mm 4‐[2‐aminoethyl] benzenesulfonyl fluoride) and phosphatase inhibitors (1 mm NaF and 1 mm Na3VO4). The protein extract was loaded, size‐fractionated by SDS–polyacrylamide gel electrophoresis and transferred to PVDF membranes (Bio‐Rad Laboratories). After blocking, the membranes were incubated with primary antibodies at 4°C for overnight. The protein expression was determined using horseradish peroxidase‐conjugated antibodies followed by enhanced ECL detection (Amersham Pharmacia Biotech, Buckinghamshire, UK). β‐Actin was used as internal control.
Oxidative stress assays.
The level of oxidative stress was measured by estimating the production of ROS using DCFH‐DA methods.( 21 ) Briefly, cells were treated with cantharidin for 24 h, harvested, and incubated with DCFH‐DA (Sigma) at a final concentration of 10 μm at 37°C for 15 min in the dark. The fluorescence intensity was measured by a FACS (Becton Dickinson) at an excitation wavelength of 488 nm and emission wavelength of 525 nm.
Statistical analysis.
Each experiment was performed at least in triplicate. Results were expressed as the mean ± SD. Statistical analysis was performed using unpaired Student’s t‐test. A P‐value less than 0.05 was considered significant.
Results
Inhibitory effect of cantharidin on pancreatic cancer cell growth and PP2A activity.
The inhibitory effects of cantharidin on the growth of pancreatic cancer cells and normal pancreatic duct cells were evaluated using MTT assays. Cantharidin treatment inhibited the growth of PANC‐1, CFPAC‐1, BxPC‐3, and Capan‐1 cells in a dose‐ and time‐dependent manner (Fig. 1a–d). And the IC50 values at 72 h after treatment were 9.42, 7.25, 6.09, and 5.56 μm respectively. Normal pancreatic duct cells showed more resistance to the cytotoxicity effect of cantharidin. The IC50 values at 72 h were 23.56 μm for human pancreatic duct cells and 24.47 μm for rat pancreatic duct cells (Fig. 1e,f). The dose‐dependent inhibitory activity of cantharidin on the growth of PANC‐1 and CFPAC‐1 cells was also confirmed by clone‐formation assays (Fig. 1g,h).
Figure 1.
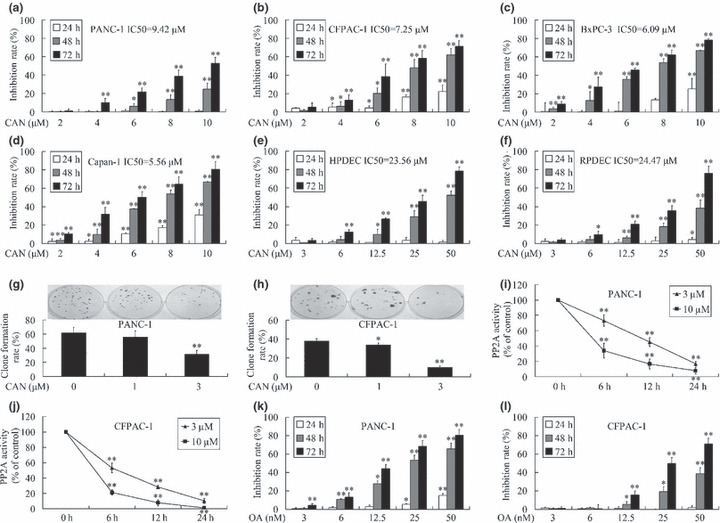
Inhibitory effect of cantharidin on pancreatic cancer cell growth and protein phosphatase 2A (PP2A) activity. (a–f) Exposure to various concentrations of cantharidin resulted in dose‐ and time‐dependent growth inhibition of PANC‐1, CFPAC‐1, BxPC‐3, and Capan‐1 pancreatic cancer cells, as well as human pancreatic duct cells (HPDEC) and rat pancreatic duct cells (RPDEC). Normal cells showed more resistance to the cytotoxicity effect of cantharidin. (g,h) Cantharidin treatment inhibited clone‐formation ability of both PANC‐1 and CFPAC‐1 cells in a dose‐dependant manner. (i,j) Treatment of both PANC‐1 and CFPAC‐1 cells with cantharidin lowered the activity of PP2A in a dose‐ and time‐dependant manner. (k,l) Treatment with various concentrations of okadaic acid (OA) also resulted in dose‐ and time‐dependent growth inhibition of PANC‐1 and CFPAC‐1 cells. *P < 0.05, **P < 0.01, indicate significant differences from the respective control groups.
As shown in Figure 1(i,j), cantharidin inhibited the activity of PP2A in a dose‐ and time‐dependent manner. OA, a classical PP2A inhibitor,( 22 ) also presented time‐ and dose‐dependent inhibition on the growth of PANC‐1 and CFPAC‐1 cells (Fig. 1k,l), suggesting the anti‐cancer effect of cantharidin is probably due to the inhibition of PP2A.
Cantharidin induced G2/M cell‐cycle arrest.
To further confirm the antimitogenic effect of cantharidin, we performed a cell‐cycle analysis. Cantharidin induced the accumulation of cells in the G2/M phase and decreased the cell population in the G0/G1 and S phases in a dose‐ and time‐dependent manner (Fig. 2a,b).
Figure 2.
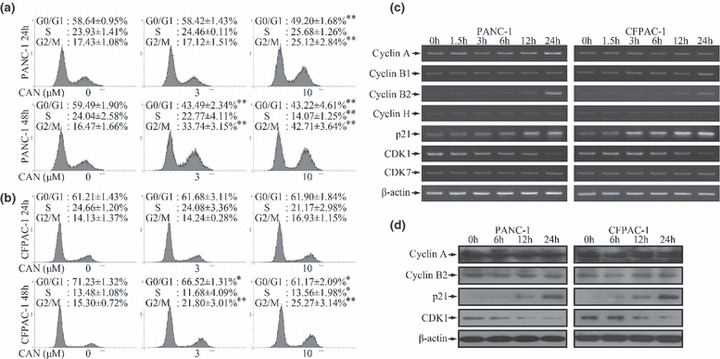
G2/M cell‐cycle arrest after cantharidin treatment. (a,b) DNA histogram showed that cantharidin induced dose‐ and time‐dependent accumulation of cells in the G2/M phase and reduced the number of cells in the G0/G1 and S phases in both PANC‐1 and CFPAC‐1 cells. *P < 0.05, **P < 0.01, indicate significant differences from the respective control groups. (c) Treatment with 10 μm cantharidin induced time‐dependent alterations of mRNA levels of G2/M cell‐cycle regulatory genes. The expressions of cyclin B2 and p21 were elevated while that of cyclin‐dependent kinase 1 (CDK1) was reduced markedly in both PANC‐1 and CFPAC‐1 cells. The expression of cyclin A was up‐regulated in PANC‐1 cells. The expression of cyclin B1 was augmented in CFPAC‐1 cells. The expressions of the other investigated genes did not show any significant changes. (d) Cantharidin (10 μm) treatment induced time‐dependent up‐regulation of p21 and down‐regulation of CDK1 in both cell lines at the protein level. But the expressions of cyclin A and cyclin B2 did not show significant changes.
The cell cycle is regulated by cyclin, CDKs, and CKIs.( 23 , 24 ) In line with the abovementioned observations, we observed differential expression patterns of cyclins, CDKs, and CKI, which are associated with G2/M cell‐cycle regulation.( 23 , 24 ) The mRNA expressions of genes encoding cyclin A, cyclin B1, cyclin B2, and p21 were increased, while that of the gene encoding CDK1 was markedly reduced (Fig. 2c). The up‐regulation of p21 and down‐regulation of CDK1 were further confirmed using western blotting (Fig. 2d). However, Figure 2(d) did not present escalated expressions of cyclins, indicating that a protein stability‐related mechanism may be involved.
Induction of apoptosis by cantharidin.
The pro‐apoptotic effect of cantharidin was quantified by using annexin V‐EGFP/PI double‐staining and flow‐cytometric analysis. The percentages of cell populations at various stages of apoptosis are shown in Figure 3(a). After cantharidin treatment, the number of cells that underwent apoptosis (early apoptosis, annexin V+/PI− and late apoptosis, annexin V+/PI+) increased significantly in a dose‐dependent manner.
Figure 3.
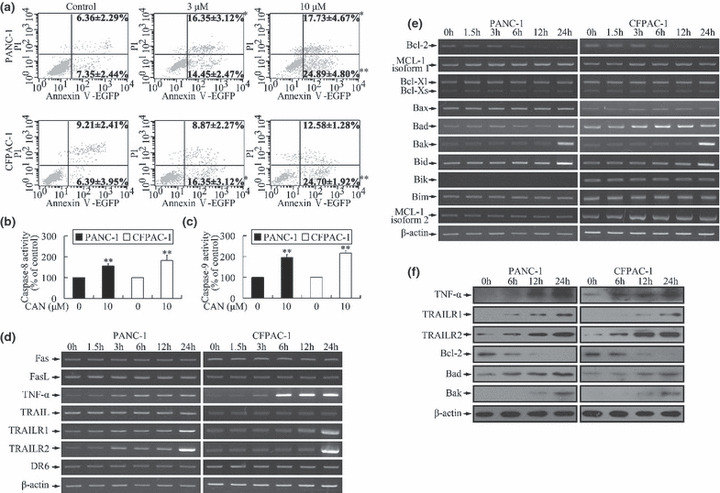
Induction of apoptosis by cantharidin. (a) After cantharidin treatment, the cell populations at both early apoptosis (annexin V+/propidium iodide [PI]−) and late apoptosis (annexin V+/PI+) stages increased significantly in a dose‐dependent manner. *P < 0.05, **P < 0.01, indicate significant differences from the respective control groups. (b,c) Caspase‐8 and caspase‐9 were activated after treatment of cells with cantharidin. *P < 0.05, **P < 0.01, indicate significant differences from the respective control groups. (d) Incubation with 10 μm cantharidin led to time‐dependent alteration of mRNA levels of genes related to extrinsic pathway. The expressions of tumor necrosis factor‐α (TNF‐α), TNF‐related apoptosis inducing receptor 1 (TRAILR1)/death receptor 4 (DR4), and TRAILR2/DR5 increased markedly. (e) Treatment with 10 μm cantharidin altered the expression pattern of genes associated with intrinsic pathway in a time‐dependent manner. The expressions of the anti‐apoptotic gene (Bcl‐2) and pro‐apoptotic genes (Bad, Bak, and Bid) were respectively down‐regulated and up‐regulated. PANC‐1 cells did not express Bik. The expressions of the other investigated genes did not show significant changes. (f) Cantharidin (10 μm) treatment induced time‐dependent up‐regulation of TNF‐α, TRAILR1, TRAILR2, Bad, and Bak, and down‐regulation of Bcl‐2 in both cell lines at the protein level.
Activation of caspases plays a central role in the execution of apoptosis.( 25 ) Both caspases 8 and 9 were activated upon cantharidin treatment, suggesting the participation of the DR (extrinsic pathway) and mitochondrial pathways (intrinsic pathway) in cantharidin‐induced apoptosis (Fig. 3b,c). This was further confirmed by the alterations in the mRNA expressions of genes related to both the pathways.( 25 , 26 ) The expressions of TNF‐α, TRAILR1/DR4, and TRAILR2/DR5 that mediate the extrinsic pathway were markedly increased (Fig. 3d) and that of the anti‐apoptotic gene (Bcl‐2) and pro‐apoptotic genes (Bad, Bak, and Bid) of the intrinsic pathway were down‐regulated and up‐regulated, respectively (Fig. 3e). Similar patterns of protein expression were also evidenced by western blotting (Fig. 3f).
Induction of oxidative stress by cantharidin.
The cytotoxic effect of cantharidin was believed to be related to oxidative stress.( 27 ) For confirming and quantifying the oxidative stress triggered by cantharidin in pancreatic cancer cells, the production of ROS was measured using the DCFH‐DA method.( 21 ) Cantharidin treatment at 10 μm significantly stimulated ROS production. Pretreatment for 3 h using 1 mm NAC, a common antioxidant,( 28 ) decreased the generation of ROS (Fig. 4a,b).
Figure 4.
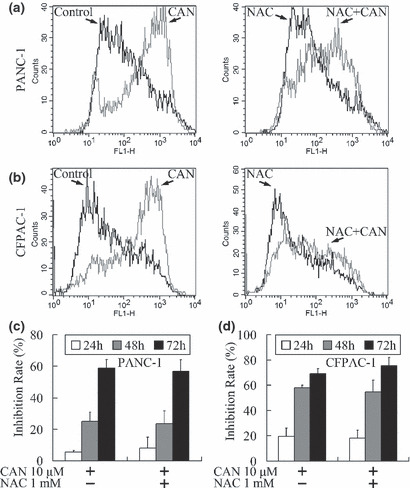
Induction of oxidative stress by cantharidin. (a,b) A 24‐h treatment with 10 μm cantharidin induced increased production of reactive oxygen species (ROS) that was attenuated by pretreatment with 1 mm N‐Acetyl‐ l‐cysteine (NAC). (c,d) Time‐dependent cantharidin‐induced growth inhibition of pancreatic cancer cells was not alleviated after treatment with 1 mm NAC (P > 0.05).
Since NAC reduced cantharidin‐induced ROS production, an MTT assay was performed for further confirming whether the cantharidin‐induced growth inhibition could also be attenuated by NAC. Treatment with 10 μm cantharidin markedly inhibited cellular growth, while pretreatment with NAC showed no significant protective function against the antitumor effect of cantharidin (Fig. 4c,d).
Cantharidin inhibited pancreatic cancer cell growth through activation of the JNK pathway.
Cantharidin has been proved to be the inhibitor of PP2A,( 6 ) a multimeric serine/threonine phosphatase, the inhibition of which could induce phosphorylation and activation of several substrate kinases.( 29 ) Although most of these kinases accelerate growth,( 29 ) MAPKs,( 30 ) including ERK,( 31 ) JNK, ( 8 ) and p38,( 8 ) have been revealed to be responsible for the growth inhibition effect of cantharidin. As shown by western blot analysis in Figure 5(a), ERK, JNK, and p38 were time‐dependently phosphorylated in PANC‐1 cells upon the treatment of cantharidin or OA. These two PP2A inhibitors also increased the expression of ERK. SP600125 (JNK inhibitor), but not PD98059 (ERK pathway inhibitor) or SB203580 (p38 inhibitor), could attenuate the growth inhibition triggered by PP2A inhibitors (Fig. 5b,c), indicating the cytotoxicity effect of PP2A inhibitors was executed through activation of JNK, but not ERK or p38.
Figure 5.
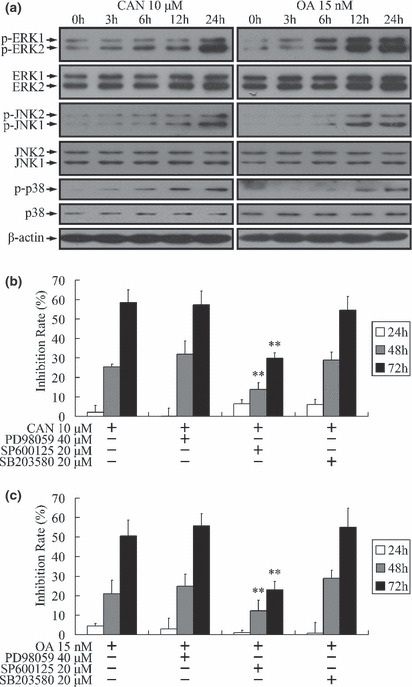
Activation of mitogen‐activated protein kinase (MAPK) pathways by protein phosphatase 2A (PP2A) inhibitors. (a,b) Treatment of PANC‐1 cells with 10 μm cantharidin or 15 nm okadaic acid (OA) induced time‐dependent phosphorylation of ERK, JNK, and p38. Total protein level of ERK was also up‐regulated. The expressions of JNK and p38 did not show significant changes. (b,c) Time‐dependent growth inhibition of PANC‐1 cells triggered by PP2A inhibitors could be attenuated by SP600125 (JNK inhibitor), but not PD98059 (ERK pathway inhibitor) or SB203580 (p38 inhibitor). **P < 0.01 indicates significant differences from the cantharidin‐ or OA‐treated groups.
Discussion
In this study, we investigated the antitumor activity of cantharidin on pancreatic cancer cell lines. Treatment with cantharidin induced substantial growth inhibition in pancreatic cancer cells, as indicated by MTT assay (Fig. 1a–d) and plate clone‐formation assay (Fig. 1g,h). Importantly, cantharidin was much less cytotoxic to normal pancreatic duct cells (Fig. 1e,f), suggesting that cantharidin induces selective cytotoxicity in pancreatic cancer cells. OA, the classical PP2A inhibitor, also presented similar toxicity effects on pancreatic cancer cells. Furthermore, the activity of PP2A could be inhibited by cantharidin. So we speculate that the cytotoxicity effect of cantharidin is probably due to the inhibition of PP2A. We further investigated the molecular mechanisms associated with the inhibitory role of cantharidin with focus on four main cellular aspects, including cell‐cycle arrest, apoptosis, oxidative stress, and activation of MAPK pathways.
First, we showed that cantharidin treatment resulted in a marked G2/M cell‐cycle arrest (Fig. 2a,b) and altered the mRNA and protein levels of cell‐cycle regulatory genes (Fig. 2c,d). The mRNA and protein levels of CDK1, which is specifically required for G2/M progression,( 23 , 24 ) were reduced after cantharidin treatment. Moreover, the expression of p21 (Waf1/Cip1), which is a blocker of CDK1 activity,( 23 , 24 ) was up‐regulated; this effect may further strengthen the G2/M cell‐cycle arrest that resulted from the decrease of CDK1 expression. Although, the mRNA levels of cyclins were elevated (Fig. 2c), the protein levels did not show remarkable changes (Fig. 2d). Such discrepancies between the mRNA and protein levels may be a result of protein degradation through the APC‐triggered ubiquitination during the progression of mitosis.( 32 , 33 ) Actually, CDK1 suppression activates Cdh1, which is a co‐activator of APC.( 32 ) In addition, cantharidin is a potent inhibitor of PP2A, which may block the APC activity.( 6 , 33 ) Taken together, treatment with cantharidin might be able to vitalize APC through inhibition of PP2A and down‐regulation of CDK1. The activation of APC may explain the increased mRNA levels of cyclins and the unchanged protein expressions.
Second, similar to previous reports on other cancer cells, we found that cantharidin induced apoptosis and activated caspase‐8 and caspase‐9 (Fig. 3a–c), thereby suggesting simultaneous participation of both the extrinsic and intrinsic pathways.( 34 ) The extrinsic pathway is activated by the binding of an extracellular death ligand to its cell‐surface DR.( 25 ) The level of TNF‐α, which has been reported to induce apoptosis in pancreatic cells,( 35 ) increased remarkably after treatment with cantharidin (Fig. 3d,f). While there was no apparent change in the TRAIL mRNA level, the levels of both TRAILR1/DR4 and TRAILR2/DR5, which are the receptors of TRAIL, increased markedly after cantharidin treatment (Fig. 3d,f). This is an important result since both PANC‐1 and CFPAC‐1 cells express low levels of TRAILR1 and TRAILR2, which is presumably responsible for the resistance to apoptosis and the lack of sensitivity to chemotherapy.( 36 , 37 ) Similar to the extrinsic pathway, there were obvious changes in the expressions of the genes involved in the intrinsic apoptotic pathway (Fig. 3e,f). The expression of Bcl‐2, an antiapoptotic protein, decreased dramatically after cantharidin treatment, which is consistent with the findings of other groups.( 11 , 27 ) The expressions of proapoptotic proteins like Bad, Bak, and Bid was also increased. Moreover, since activated caspase‐8 can further promote caspase‐9 activation through Bid,( 25 ) a crosstalk between the extrinsic and intrinsic pathways may be involved.
Third, it has been reported that the cytotoxicity of cantharidin was dependent on the induction of oxidative stress,( 27 ) which could induce subsequent apoptosis and cell‐cycle arrest;( 38 ) in this study, we examined the feasibility of this mechanism in pancreatic cancer cells. While cantharidin increased the ROS levels in both cell lines (Fig. 4a,b), growth inhibition was not alleviated in any cell line after treatment with NAC (Fig. 4c,d). These data suggest that cantharidin may induce apoptosis and cell‐cycle arrest in PANC‐1 and CFPAC‐1 cells in an oxidative stress‐independent pathway. It has been confirmed that the toxic oxidative stress is associated with p53 expression;( 8 , 27 ) mutations of this gene are present in approximately 50–75% of pancreatic cancers and are responsible for the resistance against many chemotherapeutic agents.( 39 ) Both PANC‐1 and CFPAC‐1 cell lines express a mutant form of p53,( 40 ) which might be able to explain that the oxidative stress induced by cantharidin had no relationship with the growth inhibition. The findings of our study also emphasize on the potential of the therapeutic effect of cantharidin for the treatment of pancreatic cancers with p53 mutation and those that are insensitive to the current chemotherapeutics.
Interestingly, PP2A is always thought to be a cancer suppresser, as inhibition of PP2A can induce phosphorylation and activation of substrate kinases, most of which can further accelerate growth.( 29 , 41 ) ERK, JNK, and p38 kinase, the three members of the MAPK family,( 30 ) present to be the direct substrates of PP2A.( 29 ) Although activation of MAPKs promotes growth in most cases, sustained activation of these kinases can also restrain proliferation and induce apoptosis in malignant tumor cells.( 30 ) So finally, we tried to investigate whether the cytotoxixity of cantharidin was related to MAPK pathways in pancreatic cancer cells. In the present study, ERK, JNK, and p38 were all found to be activated in PANC‐1 cells when treated with cantharidin or OA. Inhibition of JNK, but not ERK or p38, alleviated the growth inhibition effect of PP2A inhibitors, suggesting that the cytotoxicity effect of cantharidin is dependent on the JNK pathway.
JNK is evolutionarily‐conserved in animals, and extensive work has been done to confirm the participation of JNK in triggering cell‐cycle arrest and apoptosis.( 42 , 43 ) Importantly, it has been reported that activation of JNK can increase the expressions of p21,( 44 ) TNF‐α,( 45 ) Bad,( 46 ) and Bak,( 47 ) which were found to be escalated when treated by cantharidin, suggesting that the cytotocity of cantharidin could be due to the PP2A inhibition‐induced JNK activation and the subsequent up‐regulation of downstream genes which can further trigger G2/M cell‐cycle arrest and apoptosis.
In summary, we have obtained convincing evidence that cantharidin efficiently inhibits the growth of pancreatic cancer cells. Moreover, several features of its antitumor mechanisms make it an attractive candidate compound for pancreatic cancer therapy. Further investigation on both in vivo and in vitro pancreatic cancer models is warranted. And more clarification of the specific mechanism of cell signal transduction involved is still needed.
Abbreviations
- Ac‐IETD‐pNA
Acetyl‐Ile‐Glu‐Thr‐Asp p‐nitroanilide
- Ac‐LEHD‐pNA
Acetyl‐Leu‐Glu‐His‐Asp p‐nitroanilide
- APC
Anaphase‐promoting complex
- bFGF
Basic fibroblast growth factor
- CAN
Cantharidin
- CDK
Cyclin‐dependent kinase
- CKI
Cyclin‐dependent kinase inhibitor
- DCFH‐DA
2′,7′‐Dichlorodihydrofluorescein diacetate
- DMEM
Dulbecco’s minimum essential medium
- DMSO
Dimethyl sulphoxide
- DR
Death receptor
- ECL
Enhanced chemiluminescence
- EGF
Epidermal growth factor
- EGFP
Enhanced green fluorescent protein
- ERK,
Extracellular signal‐regulated kinase
- FACS
Fluorescence‐activated cell sorter
- FCS
Fetal calf serum
- JNK
c‐Jun N‐terminal kinase
- MAPK
Mitogen‐activated protein kinase
- MTT
3‐(4,5‐dimethyltiazol‐2‐yl) 2,5‐diphenyl‐tetrazolium bromide
- NAC
N‐Acetyl‐ l‐cysteine
- OA
Okadaic acid
- PBS
Phosphate‐buffered saline
- PI
Propidium iodide
- pNA
p‐Nitroanilide
- PP2A
Protein phosphatase 2A
- ROS,
Reactive oxygen species
- TNF‐α
Tumor necrosis factor‐α
- TRAILR
TNF‐related apoptosis inducing receptor
Acknowledgments
This work was supported by the National Natural Science Foundation of China (no. 30872509 [BA08]), the Science and Education for Health foundation of Jiangsu Province for Key Talents (no. 2007200 [EI07]), and the Foundation of the Cancer Center of Nanjing Medical University. We thank Dr Tao Yang (Department of Endocrinology, The First Affiliated Hospital of Nanjing Medical University, Nanjing, China) for helping isolating human and rat pancreatic duct cells. We also thank Dr Xiaofeng Fan (Saint Louis University, St Louis, MO, USA) for valuable suggestions.
References
- 1. Li D, Xie K, Wolff R, Abbruzzese JL. Pancreatic cancer. Lancet 2004; 363: 1049–57. [DOI] [PubMed] [Google Scholar]
- 2. Guo X, Cui Z. Current diagnosis and treatment of pancreatic cancer in China. Pancreas 2005; 31: 13–22. [DOI] [PubMed] [Google Scholar]
- 3. Bardeesy N, DePinho RA. Pancreatic cancer biology and genetics. Nat Rev Cancer 2002; 2: 897–909. [DOI] [PubMed] [Google Scholar]
- 4. Efferth T, Li PC, Konkimalla VS, Kaina B. From traditional Chinese medicine to rational cancer therapy. Trends Mol Med 2007; 13: 353–61. [DOI] [PubMed] [Google Scholar]
- 5. Wang GS. Medical uses of mylabris in ancient China and recent studies. J Ethnopharmacol 1989; 26: 147–62. [DOI] [PubMed] [Google Scholar]
- 6. Honkanen RE. Cantharidin, another natural toxin that inhibits the activity of serine/threonine protein phosphatases types 1 and 2A. FEBS Lett 1993; 330: 283–6. [DOI] [PubMed] [Google Scholar]
- 7. Janssens V, Goris J. Protein phosphatase 2A: a highly regulated family of serine/threonine phosphatases implicated in cell growth and signalling. Biochem J 2001; 353: 417–39. [DOI] [PMC free article] [PubMed] [Google Scholar]
- 8. Huh JE, Kang KS, Chae C, Kim HM, Ahn KS, Kim SH. Roles of p38 and JNK mitogen‐activated protein kinase pathways during cantharidin‐induced apoptosis in U937 cells. Biochem Pharmacol 2004; 67: 1811–8. [DOI] [PubMed] [Google Scholar]
- 9. Peng F, Wei YQ, Tian L et al. Induction of apoptosis by norcantharidin in human colorectal carcinoma cell lines: involvement of the CD95 receptor/ligand. J Cancer Res Clin Oncol 2002; 128: 223–30. [DOI] [PubMed] [Google Scholar]
- 10. Chen YN, Chen JC, Yin SC et al. Effector mechanisms of norcantharidin‐induced mitotic arrest and apoptosis in human hepatoma cells. Int J Cancer 2002; 100: 158–65. [DOI] [PubMed] [Google Scholar]
- 11. Huan SK, Lee HH, Liu DZ, Wu CC, Wang CC. Cantharidin‐induced cytotoxicity and cyclooxygenase 2 expression in human bladder carcinoma cell line. Toxicology 2006; 223: 136–43. [DOI] [PubMed] [Google Scholar]
- 12. Williams LA, Moller W, Merisor E, Kraus W, Rosner H. In vitro anti‐proliferation/cytotoxic activity of cantharidin (Spanish Fly) and related derivatives. West Indian Med J 2003; 52: 10–3. [PubMed] [Google Scholar]
- 13. Yu ZJ. Chinese material medica combined with cisplatin and lipiodol through transcatheter arterial embolization in the treatment of primary hepatoma. Zhongguo Zhong Xi Yi Jie He Za Zhi 1993; 13: 327–9. [PubMed] [Google Scholar]
- 14. Li J, Wang Y, Yu X et al. Islet neogenesis‐associated protein‐related pentadecapeptide enhances the differentiation of islet‐like clusters from human pancreatic duct cells. Peptides 2009; 30: 2242–9. [DOI] [PubMed] [Google Scholar]
- 15. Zhang X, Yong W, Lv J et al. Inhibition of forkhead box O1 protects pancreatic beta‐cells against dexamethasone‐induced dysfunction. Endo-crinology 2009; 150: 4065–73. [DOI] [PubMed] [Google Scholar]
- 16. Carmichael J, DeGraff WG, Gazdar AF, Minna JD, Mitchell JB. Evaluation of a tetrazolium‐based semiautomated colorimetric assay: assessment of chemosensitivity testing. Cancer Res 1987; 47: 936–42. [PubMed] [Google Scholar]
- 17. Ma T, Zhu ZG, Ji YB et al. Correlation of thymidylate synthase, thymidine phosphorylase and dihydropyrimidine dehydrogenase with sensitivity of gastrointestinal cancer cells to 5‐fluorouracil and 5‐fluoro‐2′‐deoxyuridine. World J Gastroenterol 2004; 10: 172–6. [DOI] [PMC free article] [PubMed] [Google Scholar]
- 18. Nicoletti I, Migliorati G, Pagliacci MC, Grignani F, Riccardi C. A rapid and simple method for measuring thymocyte apoptosis by propidium iodide staining and flow cytometry. J Immunol Methods 1991; 139: 271–9. [DOI] [PubMed] [Google Scholar]
- 19. Kues WA, Anger M, Carnwath JW, Paul D, Motlik J, Niemann H. Cell cycle synchronization of porcine fetal fibroblasts: effects of serum deprivation and reversible cell cycle inhibitors. Biol Reprod 2000; 62: 412–9. [DOI] [PubMed] [Google Scholar]
- 20. Vermes I, Haanen C, Reutelingsperger C. Flow cytometry of apoptotic cell death. J Immunol Methods 2000; 243: 167–90. [DOI] [PubMed] [Google Scholar]
- 21. Wang H, Joseph JA. Quantifying cellular oxidative stress by dichlorofluorescein assay using microplate reader. Free Radic Biol Med 1999; 27: 612–6. [DOI] [PubMed] [Google Scholar]
- 22. Haystead TA, Sim AT, Carling D et al. Effects of the tumour promoter okadaic acid on intracellular protein phosphorylation and metabolism. Nature 1989; 337: 78–81. [DOI] [PubMed] [Google Scholar]
- 23. Van Den Heuvel S. Cell‐cycle regulation. WormBook 2005; 21: 1–16. [DOI] [PMC free article] [PubMed] [Google Scholar]
- 24. Stark GR, Taylor WR. Control of the G2/M transition. Mol Biotechnol 2006; 32: 227–48. [DOI] [PubMed] [Google Scholar]
- 25. Riedl SJ, Shi Y. Molecular mechanisms of caspase regulation during apoptosis. Nat Rev Mol Cell Biol 2004; 5: 897–907. [DOI] [PubMed] [Google Scholar]
- 26. Youle RJ, Strasser A. The BCL‐2 protein family: opposing activities that mediate cell death. Nat Rev Mol Cell Biol 2008; 9: 47–59. [DOI] [PubMed] [Google Scholar]
- 27. Rauh R, Kahl S, Boechzelt H, Bauer R, Kaina B, Efferth T. Molecular biology of cantharidin in cancer cells. Chin Med 2007; 2: 8. [DOI] [PMC free article] [PubMed] [Google Scholar]
- 28. Zhang Q, Tsukahara F, Maru Y. N‐acetyl‐cysteine enhances growth in BCR‐ABL‐transformed cells. Cancer Sci 2005; 96: 240–4. [DOI] [PMC free article] [PubMed] [Google Scholar]
- 29. Millward TA, Zolnierowicz S, Hemmings BA. Regulation of protein kinase cascades by protein phosphatase 2A. Trends Biochem Sci 1999; 24: 186–91. [DOI] [PubMed] [Google Scholar]
- 30. Zhang W, Liu HT. MAPK signal pathways in the regulation of cell proliferation in mammalian cells. Cell Res 2002; 12: 9–18. [DOI] [PubMed] [Google Scholar]
- 31. Schweyer S, Bachem A, Bremmer F et al. Expression and function of protein phosphatase PP2A in malignant testicular germ cell tumours. J Pathol 2007; 213: 72–81. [DOI] [PubMed] [Google Scholar]
- 32. Baker DJ, Dawlaty MM, Galardy P, Van Deursen JM. Mitotic regulation of the anaphase‐promoting complex. Cell Mol Life Sci 2007; 64: 589–600. [DOI] [PMC free article] [PubMed] [Google Scholar]
- 33. Fang G, Yu H, Kirschner MW. Control of mitotic transitions by the anaphase‐promoting complex. Philos Trans R Soc Lond B Biol Sci 1999; 354: 1583–90. [DOI] [PMC free article] [PubMed] [Google Scholar]
- 34. Sagawa M, Nakazato T, Uchida H, Ikeda Y, Kizaki M. Cantharidin induces apoptosis of human multiple myeloma cells via inhibition of the JAK/STAT pathway. Cancer Sci 2008; 99: 1820–6. [DOI] [PMC free article] [PubMed] [Google Scholar]
- 35. Kondo J, Sato F, Kusumi T et al. Claudin‐1 expression is induced by tumor necrosis factor‐alpha in human pancreatic cancer cells. Int J Mol Med 2008; 22: 645–9. [PubMed] [Google Scholar]
- 36. Hesry V, Piquet‐Pellorce C, Travert M et al. Sensitivity of prostate cells to TRAIL‐induced apoptosis increases with tumor progression: DR5 and caspase 8 are key players. Prostate 2006; 66: 987–95. [DOI] [PubMed] [Google Scholar]
- 37. Mori T, Doi R, Toyoda E et al. Regulation of the resistance to TRAIL‐induced apoptosis as a new strategy for pancreatic cancer. Surgery 2005; 138: 71–7. [DOI] [PubMed] [Google Scholar]
- 38. Ozben T. Oxidative stress and apoptosis: impact on cancer therapy. J Pharm Sci 2007; 96: 2181–96. [DOI] [PubMed] [Google Scholar]
- 39. Farrell JJ, Van Rijnsoever M, Elsaleh H. Early detection markers in Pancreas Cancer. Cancer Biomark 2005; 1: 157–75. [DOI] [PubMed] [Google Scholar]
- 40. Moore PS, Sipos B, Orlandini S et al. Genetic profile of 22 pancreatic carcinoma cell lines. Analysis of K‐ras, p53, p16 and DPC4/Smad4. Virchows Arch 2001; 439: 798–802. [DOI] [PubMed] [Google Scholar]
- 41. Janssens V, Goris J, Van Hoof C. PP2A: the expected tumor suppressor. Curr Opin Genet Dev 2005; 15: 34–41. [DOI] [PubMed] [Google Scholar]
- 42. Kyriakis JM, Avruch J. Mammalian mitogen‐activated protein kinase signal transduction pathways activated by stress and inflammation. Physiol Rev 2001; 81: 807–69. [DOI] [PubMed] [Google Scholar]
- 43. Kajiguchi T, Yamamoto K, Iida S, Ueda R, Emi N, Naoe T. Sustained activation of c‐jun‐N‐terminal kinase plays a critical role in arsenic trioxide‐induced cell apoptosis in multiple myeloma cell lines. Cancer Sci 2006; 97: 540–5. [DOI] [PMC free article] [PubMed] [Google Scholar]
- 44. Xiao L, Eto M, Kazanietz MG. ROCK mediates phorbol ester‐induced apoptosis in prostate cancer cells via p21Cip1 up‐regulation and JNK. J Biol Chem 2009; 284: 29365–75. [DOI] [PMC free article] [PubMed] [Google Scholar]
- 45. An L, Dong GQ, Gao Q et al. Effects of UVA on TNF‐alpha, IL‐1beta, and IL‐10 expression levels in human keratinocytes and intervention studies with an antioxidant and a JNK inhibitor. Photodermatol Photoimmunol Photomed 2010; 26: 28–35. [DOI] [PubMed] [Google Scholar]
- 46. Lin KL, Su JC, Chien CM et al. Naphtho[1,2‐b]furan‐4,5‐dione induces apoptosis and S‐phase arrest of MDA‐MB‐231 cells through JNK and ERK signaling activation. Toxicol In Vitro. 2010; 24(1): 61–70. [Epub 2009 Sep 9]. [DOI] [PubMed] [Google Scholar]
- 47. Choi YJ, Kim SY, Oh JM, Juhnn YS. Stimulatory heterotrimeric G protein augments gamma ray‐induced apoptosis by up‐regulation of Bak expression via CREB and AP‐1 in H1299 human lung cancer cells. Exp Mol Med 2009; 41: 592–600. [DOI] [PMC free article] [PubMed] [Google Scholar]