

Abstract
We aimed to determine changes in the expression of the genes CDH1, CDH13, CD44, and TIMP3 to look for any relationship between them, HER2 and ESR1 expression at the RNA level, and the histopathological properties of tumors. We also analyzed the expression properties of double‐negative (estrogen receptor [ER] and human epidermal growth factor receptor [HER2] both negative) breast tumors. Expression status was studied in fresh tissue at the mRNA level with quantitative PCR using hydrolysis probes. Sixty‐two cancer patients and four normal controls were included in the study. When the tumor group was analyzed as a whole, the correlations of ESR1 with CDH1, CDH13, and TIMP3 were P < 0.05, P < 0.005, and P < 0.005, respectively. In ER‐positive tumors, CDH1 and CDH13 were correlated directly (P < 0.005) when HER2 was correlated with CDH1, CDH13, and TIMP3 indirectly (P < 0.005, P < 0.005, and P < 0.05, respectively). CDH1 and CD44 had a strong indirect correlation (P < 0.005) in ER‐negative tumors. There were significant differences in the expression levels of the CDH13, TIMP3, and CD44 genes (P < 0.005, P < 0.005, and P < 0.05, respectively) between the ER‐positive and ‐negative groups. All four genes were found to be correlated with invasive properties in both ER‐positive and ‐negative tumors. In double‐negative tumor samples, only CD44 had a significant and strong correlation with stage, lymph node involvement, and metastasis (P < 0.05, P < 0.005, and P < 0.05, respectively). As a conclusion, a decrease in CDH1, CDH13, and TIMP3 expression levels with an increase in CD44 can be used as an indicator for invasion in both ER‐positive and ‐negative breast tumors. In double‐negative tumor tissues, CD44 can be considered a marker for aggressive properties. (Cancer Sci 2009; 100: 2341–2345)
Breast cancer is the most common type of cancer and the most important cause of mortality and morbidity related to cancer in industrial countries. Several molecular markers for predicting response to treatment and prognosis have been introduced. The status of estrogen receptor (ER), which is a member of the ER nuclear receptor superfamily, is one of the most declared markers. Transcription of ER and estrogen is regulated by complicated mechanisms. Two isoforms of the ER (ER‐α and ER‐ß), which mediates the steroid hormone estrogen, are present; both have similar estrogen binding affinities but their expression is regulated separately.( 1 ) The role of ER‐ß expression in breast cancer is not yet clear, but the presence of ER‐α (ESR1) is used as a marker to indicate the potential effectiveness of endocrine treatment.( 1 ) Almost one‐third of breast tumors are ER negative at the time of diagnosis, and some others loose their receptors during tumor progression.( 2 ) Mostly ER‐positive tumors have a better prognosis then ER‐negative tumors. They can be successfully treated with hormone therapy like tamoxifen and aromatase inhibitors.( 3 , 4 )
Epidemiological studies have shown that ER‐positive tumors have a different risk profile compared with ER‐negative tumors.( 5 ) Human epidermal growth factor receptor (HER2) is another important factor in treatment and prognosis. It is overexpressed in 15–25% of breast cancers and is associated with resistance to hormone treatment and bad prognosis.( 6 )
In breast cancer, it is the metastatic disease that causes mortality more than the primary tumor itself. For invasion and metastasis, breast tumor cells need a motile phenotype, which is a product of many abnormal gene interactions.( 7 , 8 ) The invasion and metastasis process begins when a carcinoma cell no longer needs stromal support for its mitogenic signals.( 9 ) Many factors, including adhesion molecules, extracellular matrix (ECM), destroying metalloproteinases (MMP), and tissue inhibitors of MMP (TIMP), have roles in this not completely clarified process.( 10 , 11 )
Cadherins are transmembrane glycoproteins expressed on the epithelial cell surface that mediate intercellular Ca2+‐dependent adhesion, which is important for maintaining normal tissue structure.( 12 ) Reduced expression of cadherin family members such as like CDH1 (E‐cadherin) and CDH13 (H‐cadherin) is observed in many tumors.( 13 , 14 ) Even though both genes are accepted as tumor‐suppressor genes, the molecular mechanism is not yet clear.
CD44 is a cell surface membrane glycoprotein that acts in cell–cell and cell–matrix adhesions.( 15 ) Although the standard form is expressed the most, it has many isoforms formed by alternative splicing of the 10 exons of a single gene and post‐translational modifications.( 16 ) As a cell surface receptor, it mediates many ligands, including hyaluronic acid, fibronectin, and osteopontin.( 17 , 18 , 19 ) Studies analyzing the correlation of histopathological features and CD44 expression have produced conflicting results.( 20 , 21 , 22 ) Also, both tumor supressive and tumor progression‐promoting roles have been suggested in breast cancer patients.( 23 , 24 )
TIMP are natural molecules that inhibit proteolytic activity of MMP.( 25 ) The imbalance between MMP and TIMP may affect cancer invasion and metastasis, and conseqeuntly the clinical course of the patient.( 26 ) TIMP‐3, which is tightly bonded to the matrix via heparan sulfate,( 27 ) has been shown to have roles in invasion, apoptosis, and cellular growth in in vitro studies.( 28 , 29 , 30 , 31 ) It has a tumor suppressor role in many malignancies.( 32 )
No in vivo interaction of the genes CDH1, CDH13, CD44, and TIMP3 have been evidenced yet. The present study aims to display the expression changes of these genes in breast cancer. The relationship between the RNA levels of the genes CDH1, CDH13, CD44, and TIMP3 together with HER2 and ESR1 and with histopathological features was studied. Also, expression patterns in double‐negative breast tumors and differences in the patterns according to ER and HER2 status were characterized.
Material and Methods
Patients and tumors. Breast tumors and adjacent non‐malignant tissues from the resection margin were obtained from the Dokuz Eylül Breast Tumor Biobank under permission of the local clinical and laboratory research ethical council for analysis of patient samples. All of the breast tissue samples were collected from patients who had neither chemotherapy nor radiotherapy before operation. Primary breast carcinomas were frozen in either liquid nitrogen or on dry ice within 20 min following devascularization, and were stored at −80°C. Frozen sections were cut from primary breast carcinoma specimens and stained with hematoxylin–eosin to confirm tumor content. Specimens in which at least 70% of the cells were carcinoma cells were utilized in this study. The Elston–Ellis modification of the Scarff–Bloom–Richardson grading system (Nottingham grading system) is based on a microscopic evaluation of morphological and cytological features of tumor cells.( 33 ) The clinical stage of the disease was determined according to the American Joint Committee on Cancer staging manual.( 34 ) Tumour size (≤2 cm and >2 cm) and status of involved lymph nodes (none and one or more nodes) were evaluated separately. ER and HER2 receptor status were assessed on histological sections by standard immunohistochemistry (IHC). IHC was scored qualitatively exploiting the semiquantitative results of ER and HER2 to accept staining of 10% or more and 3+ as positive, respectively. Normal control breast tissues were obtained from breast reduction surgeries of otherwise healthy patients. All of the macroscopic and microscopic examinations were carried out by the same pathologist.
DNA and RNA extraction. DNA and RNA isolations were done using fresh tissue that was immediately analyzed by the pathologist after surgical resection. Approximately 10–20 μg of DNA was isolated from 1 mg of tissue pieces using the spin column technique (genomic DNA extraction, Mini‐Tissue; RBC Bioscience, Taipei, Taiwan) after mechanical homogenization (micropestle made with polypropylene) of the tissue. DNA concentration and purity was measured with an UV spectrophotometer (UV‐3600; Shimadzu, Kyoto, Japan).
Quantitative PCR. The cDNA was synthesized using 0.2 μg random primers and 200 U moloney murine leukemia virus reverse transcriptase (Revertaid First Strand; Fermentas, Vilnius, Lithuania) DNA polymerase at 42°C for 90 min.
Specific primers and hydrolysis probes for CDH1, CDH13, CD44, TIMP3, ESR1, HER2, HER4, and the housekeeping genes ACTB (β‐actin), B2M (β‐2‐microglobulin), RPL13A (ribosomal protein L13a), and PUM1 (homolog of Pumilio, Drosophila) were designed using a universal probe library database (Roche Diagnostics, Mennheim, Germany) (Table 1), and quantitative PCR (qPCR) was set up on a 96‐well plate (Mx3000P; Stratagene, La Jolla, CA, USA).
Table 1.
Primer and probe list for quantitative PCR
| Gene | GenBank/EMBL name | Primer 1 (forward) | Primer 2 (reverse) | UPL probe number |
|---|---|---|---|---|
| CDH1 | ENSG00000039068 | gccgagagctacacgttca | gaccggtgcaatcttcaaa | 80 |
| CDH13 | ENSG00000140945 | gcgtgtacactgctctcttcc | aaagtcccagtgcccgtag | 59 |
| CD44 | ENSG00000026508 | tggatcaggcattgatgatg | gtcaaaagcccgtggtgt | 67 |
| TIMP3 | ENSG00000100234 | ctgtgcaacttcgtggagag | ggcaggtagtagcaggacttg | 14 |
| ESR | ENSG00000091831 | ttactgaccaacctggcaga | atcatggagggtcaaatcca | 24 |
| HER2 | ENSG00000141736 | gggaaacctggaactcacct | ccctgcacctcctggata | 4 |
| RPL13A | NM_012423 | gaggcccctaccacttcc | aacaccttgagacggtccag | 28 |
| B2M | NM_004048 | taggagggctggcaacttag | cttatgcacgcttaactatcttaacaa | 32 |
| ACTB | NM_001101 | ccaaccgcgagaagatga | ccagaggcgtacagggatag | 64 |
| PUM1 | NM_001020658 | agtgggggactaggcgttag | gttttcatcactgtctgcatcc | 22 |
UPL, universal probe library.
A calibrator RNA of a pool of human RNA (Universal Human Normal Tissue RNA; BioTaq, Bioline, UK) was used for optimization of primer and probe combinations and plotting standard curves. Universal RNA was converted to its cDNA using random hexamer primers at once and diluted to a pool to minimize any experimental variations. In calculations of standard curves, at least five different dilutions of the calibrator cDNA were used, each in triplicate.
qPCR reactions were set up in a 20‐μL volume with 10 μL 2× Taqman master mix (RBC Bioscience), 0.2 μL (200 nM) of each primer, and 0.2 μL (100 nM) probe starting with 2 μL cDNA template. The reaction profile was 50 cycles of 30 s at 95°C, 40 s at 59°C, and 20 s at 72°C after 10 min of initial denaturation and hot‐start activation. Fluorescence readings was done at the end of the annealing step. The formula 2−ΔΔCt was used to calculate relative quantitation values from data of an individual sample to normalize it with its housekeeping gene for comparison with normal tissue to show fold differences in expression.( 35 )
Intra‐run and inter‐run coefficiencies of variation (CV) were calculated for the whole experiment. When PCR were set up in parties of 96 at once, a duplicate of PUM1 at two different concentrations of universal cDNA (10 and 0.1 ng/μL) was repeated in each plate to standardize inter‐run differences.
Statistics. SPSS 15.0 (SPSS Inc, Chicago, USA) was used in statistical analysis to do: Kolmogorov–Smirnov and Shapiro–Wilk tests for normal distribution analysis of data groups; Kruskal–Wallis and Mann–Whitney U‐tests for searching any statistical difference between groups, clinical parameters, and gene expression levels; and Spearman and Pearson correlation analysis for any relationships in the expression patterns of genes. Log and −1/log of data were used in the calculations for positive and negative data, respectively.
Results
Individuals. Sixty‐six samples from 66 individuals grouped as four normal (ages 30–41 years; mean 36 years; median 36.5 years) and 62 invasive tumors (ages 26–81 years; mean 53.2 years; median 51 years) were included in the study. The histopathological specifications and ER status of the tumors are shown in Table 2.
Table 2.
Histopathological features of the patients
| Characteristics | ER negative | ER positive | Total | |||
|---|---|---|---|---|---|---|
| n | %‡ | n | %‡ | n | %§ | |
| Age at diagnosis (years) | ||||||
| ≤50 | 9 | 50 | 20 | 45.5 | 29 | 46.8 |
| 50< | 9 | 50 | 24 | 54.5 | 33 | 53.2 |
| Stage | ||||||
| 1 | 3 | 16.7 | 12 | 27.3 | 15 | 24.2 |
| 2 | 8 | 44.4 | 12 | 27.3 | 20 | 32.3 |
| 3 | 4 | 22.2 | 15 | 34.1 | 19 | 30.6 |
| 4 | 3 | 16.7 | 5 | 11.4 | 8 | 12.9 |
| Nuclear grade | ||||||
| 1 | 1 | 5.6 | 5 | 11.4 | 6 | 9.7 |
| 2 | 6 | 33.3 | 21 | 47.7 | 27 | 43.6 |
| 3 | 10 | 55.6 | 18 | 40.9 | 28 | 45.2 |
| Unknown | 1 | 5.6 | – | – | 1 | 1.6 |
| Histological grade | ||||||
| 1 | 0 | – | 11 | 25 | 11 | 17.7 |
| 2 | 7 | 38.9 | 12 | 27.3 | 19 | 30.6 |
| 3 | 3 | 16.7 | 2 | 4.5 | 5 | 8.1 |
| Unknown | 8 | 44.4 | 9 | 20.5 | 17 | 27.4 |
| Mitotic activity | ||||||
| 1 | 6 | 33.3 | 21 | 47.7 | 27 | 43.6 |
| 2 | 4 | 22.2 | 14 | 31.8 | 18 | 29 |
| 3 | 7 | 38.9 | 7 | 15.9 | 14 | 22.6 |
| Unknown | 1 | 5.6 | 2 | 4.5 | 3 | 4.8 |
| Tubular differentiation | ||||||
| 1 | 0 | – | 4 | 9.1 | 4 | 6.5 |
| 2 | 4 | 22.2 | 20 | 45.5 | 24 | 38.8 |
| 3 | 11 | 61.1 | 20 | 45.5 | 31 | 50 |
| Unknown | 3 | 16.7 | – | – | 3 | 4.8 |
| Tumor size | ||||||
| ≤20 mm | 5 | 27.8 | 22 | 50 | 27 | 43.6 |
| >20 mm | 11 | 61.1 | 21 | 47.7 | 32 | 51.6 |
| Tx | 2 | 11.1 | 1 | 2.3 | 3 | 4.8 |
| Nodal involvement | ||||||
| No | 9 | 50 | 18 | 40.9 | 27 | 43.6 |
| N positive | 9 | 50 | 26 | 59.1 | 35 | 56.5 |
| Metastasis | ||||||
| Negative | 15 | 83.3 | 39 | 88.6 | 54 | 87.1 |
| Positive | 3 | 16.7 | 5 | 11.4 | 8 | 12.9 |
| HER2† | ||||||
| Negative | 8 | 44.4 | 6 | 13.6 | 14 | 22.6 |
| Positive | 10 | 55.6 | 36 | 81.8 | 46 | 74.2 |
| Unknown | – | – | 2 | 4.5 | 2 | 3.2 |
†Her2 positive, 3+ expression by immunostatin; ‡percentage in the group; §percentage in the total number of patients. Tx, unknown tumor size.
Reliability of qRT‐PCR. The absorbance ratios of 260/280 nm for the RNA isolated from tissue samples were 1.95–2.12 (±0.03). Intra‐run CV% for all qRT‐PCR reactions were 0.0342 and 0.042, and inter‐run CV% were 0.042 and 0.024 for 10 ng and 1 ng initial concentrations, respectively.
Efficiency, slope, and RSq values for reference and target genes were calculated by the MxPro analysis software of the Stratagene Mx3000P device and are shown in Table 3. The RSq value is a calculated assessment of the fit of the standard curve to the data points plotted.
Table 3.
Gene amplification efficiencies
| Gene | Efficiency (%) | Slope | RSq† |
|---|---|---|---|
| CDH1 | 100.4 | 3.313 | 0.997 |
| CDH13 | 99.8 | 3.326 | 0.997 |
| CD44 | 100.4 | 3.312 | 0.999 |
| TIMP3 | 99.4 | 3.337 | 0.999 |
| ESR1 | 101 | 3.299 | 0.999 |
| HER2 | 97.6 | 3.380 | 0.998 |
| RPL13A | 101 | 3.288 | 0.998 |
| B2M | 86.1 | 3.717 | 0.999 |
| ACTB | 100.2 | 3.318 | 1.000 |
| PUM1 | 101.4 | 3.327 | 0.996 |
†RSq value is a calculated assessment of the fit of the standard curve to the data points plotted.
In the whole group, the PUM1 gene was ranked as the most stable gene (stability score 0.229; standard error 0.104) and preferred for use in normalization.
Gene expression data. There were strong and significant correlations between the IHC and qRT‐PCR results for ER and HER2 (r = 786, P = 0.000 and r = 710, P = 0.000, respectively).
In the whole tumor group, the levels of ESR1 and CDH1, CDH13, and TIMP3 had significant correlations (r = 256, P = 0.021; r = 566, P = 0.000; and r = 409, P = 0.000, respectively).
In ER‐positive tumors, the observed correlation was direct between the expression of CDH1 and CDH13 (r = 424, P = 0.004), but indirect between HER2 and CDH1, CDH13, and TIMP3 (=−510, P = 0.000; r = −423, P = 0.004; and r = −386, P = 0.01, respectively). There was an indirect correlation between CDH1 and CD44 in ER‐negative tumors (r = −666, P = 0.003).
There were significant differences in the expression of CDH13, TIMP3, and CD44 between the ER‐positive and ER‐negative groups at the levels of 0.001, 0.001, and 0.05, respectively (Fig. 1). The expression of these genes was not significantly different when grouped as HER2‐positive and HER2‐negative.
Figure 1.
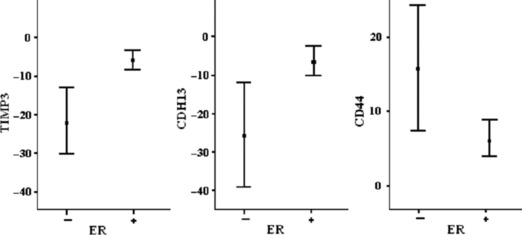
CDH13, TIMP3, and CD44 gene expressions versus estrogen receptor (ER) status (mean ± SE).
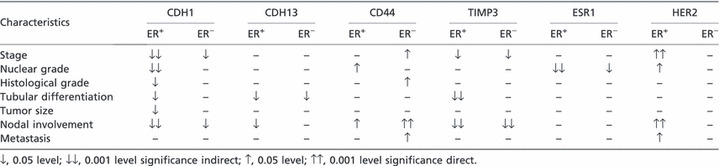
Table 4 shows the correlation between gene expression levels and histopathological features, when grouped according to ER status. In double‐negative tumor samples, CD44 gene expression levels had strong and significant correlations with stage, nodal involvement, and metastasis (r = 848, P = 0.008; r = 756, P = 0.003; and r = 845, P = 0.008, respectively).
Table 4.
Correlation between gene expression and histopathological features of the tumor
Discussion
This is one of the exceptional studies in the literature in which intra‐ and inter‐study CV are calculated to show the reliability of the results of qRT‐PCR experiments. Both CV were below 0.005, indicating the analytical validity. The normalization step in the analysis of RNA level expression studies has a direct effect on the experimental results. Incorrect assignment of the unstable reference gene may lead to wrong decisions based on these deflected results.( 36 ) Instead of the influential B2M and ACTB genes, the PUM1 gene was calculated as the most stable gene and used for the purpose of normalization in our study.( 37 ) Comparison with normal breast tissue is a very simple and confident method to show the fold difference in expression.
Breast cancer has a heterogenous nature and patients with similar histopathological diagnosis can have different clinical prognosis and respond differently to the same therapy.( 38 ) Improving the clinical management of breast cancer is only possible with more data on the biological behavior of the tumor. In the present study, genes related with metastatic and invasive properties are compared with the conventional histopathological features of the tumor, which specifies the biological behavior of the tumor.
The role of CD44 in the regulation of metastasis and invasion in tumorigenesis is controversial. Some authors suggest its role in tumor progression and metastasis( 39 , 40 , 41 , 42 ) while others suggest that it inhibits these courses.( 43 , 44 ) It is highly possible that different variants of this gene and post‐translational modifications of the product may lead to different conclusions in studies with different methods. It was shown that transfection with antisense CD44 inhibits tumor cell growth and metastasis;( 45 ) and expression levels of the standard form of CD44 and its variants are increased in metastatic breast carcinoma.( 46 ) The idea of expedition to invasion( 47 , 48 ) is also supported by our data, which reflects the standard form of CD44. This effect is more obvious in ER‐negative tumors compared with ER‐positive tumors. The cell adhesion mechanism for binding of tumor cells to the ECM and basal membrane has an important role in tumor invasion. Migration via ECM is favoured in the CD44 and hyaluronic acid interaction for degradation of basal membrane. Upregulation of the standard form of CD44 in tumors may lead to more aggressive and spreading cells. In double‐negative (ER and HER2 negative) tumor samples, correlation of CD44 with stage, nodal involvement, and metastasis supports this idea. In more aggressive ER‐positive tumors, a similar situation is observed revealing that CD44 is not only dependent on estrogen.
Decreased expression of CDH1 is one of the most prominent changes in cancer, signifying its tumor suppressor role.( 49 ) However, CDH1 expression changes are not related to advanced‐grade ER‐negative and metastatic individuals. Our data shows that CDH1 and ESR1 levels are related and suggests a correlation between decreased levels of the CDH1 gene with impaired tumor phenotype and ESR1 expression. Similar situations are observed in CDH13 expression changes. Poor differentiation is shown to be associated with decreased levels of CDH13 in ER‐negative tumor samples.
Our results indicate higher TIMP3 RNA levels in steroid receptor‐positive samples. We found a decrease in the levels of TIMP3 RNA when tumor cells gain invasive properties and loose their differentiated state. A negative correlation between TIMP3 and HER2 also suggests these circumstances.
The patterns of gene expression in ER‐positive and ER‐negative tumors and their relationships with HER2 and ESR1 levels may have great importance in comprehending molecular pathogenesis, and should be verified in large sample groups. To guess tumor behavior, using multiple markers is no doubt better than a single marker, minimizing possible errors.
As a conclusion, decreased CDH1, CDH13, and TIMP3 with increased CD44 gene expression levels can be used as an indicator for invasion in both ER‐positive and ER‐negative breast tumors. In double‐negative tumor tissues, CD44 can be considered a marker for aggressive properties. However, additional assays in a larger series of patients with long follow up will be necessary to confirm these results of gene expressions in ER‐positive and ER‐negative tumors and their relationship with HER2 and ESR1.
Author Contribution
ACC conceived the statistical analysis of data from molecular genetic studies designed by ACC with MS and performed by ACC and YK. SS and AIS helped in selecting patients and supplying tissues. TC carried out pathological evaluations and ZB maintained the coordination of clinical data of the patients. The manuscript was written by ACC and YK, and read and approved by all authors.
Funding
This study is supported by The Scientific and Technological Research Council of Turkiye (TUBITAK) and Dokuz Eylul University.
Disclosure Statement
The authors declare that they have no conflict of interests.
References
- 1. Shao W, Brown M. Advances in estrogen receptor biology: prospects for improvements in targeted breast cancer therapy. Breast Cancer Res 2004; 6: 39–52. [DOI] [PMC free article] [PubMed] [Google Scholar]
- 2. Hortobagyi GN. Treatment of breast cancer. N Engl J Med 1998; 339: 974–84. [DOI] [PubMed] [Google Scholar]
- 3. Early Breast Cancer Trialists’ Collaborative Group . Effects of chemotherapy and hormonal therapy for early breast cancer on recurrence and 15‐year survival: an overview of the randomised trials. Lancet 2005; 365: 1687–717. [DOI] [PubMed] [Google Scholar]
- 4. Smith IE, Dowsett M, Ebbs SR et al. Neoadjuvant treatment of postmenopausal breast cancer with anastrozole, tamoxifen, or both in combination: the Immediate Preoperative Anastrozole, Tamoxifen, or Combined with Tamoxifen (IMPACT) Multicenter double‐blind randomized trial. J Clin Oncol 2005; 23: 5108–16. [DOI] [PubMed] [Google Scholar]
- 5. Colditz GA, Rosner BA, Chen WY, Holmes MD, Hankinson SE. Risk factors for breast cancer according to estrogen and progesterone receptor status. J Natl Cancer Inst 2004; 96: 218–28. [DOI] [PubMed] [Google Scholar]
- 6. Francis G, Beadle G, Thomas S, Mengersen K, Stein S. Evaluation of oestrogen and progesterone receptor status in HER‐2 positive breast carcinomas and correlation with outcome. Pathology 2006; 38: 391–8. [DOI] [PubMed] [Google Scholar]
- 7. Entschladen F, Drell TL IV, Lang K, Joseph J, Zaenker KS. Tumour‐cell migration, invasion, and metastasis: navigation by neurotransmitters. Lancet Oncol 2004; 5: 254–8. [DOI] [PubMed] [Google Scholar]
- 8. Eccles SA. Targeting key steps in metastatic tumour progression. Curr Opin Genet Dev 2005; 15: 77–86. [DOI] [PubMed] [Google Scholar]
- 9. Keen JC, Davidson NE. The biology of breast carcinoma. Cancer 2003; 97: 825–33. [DOI] [PubMed] [Google Scholar]
- 10. Vernon AE, LaBonne C. Tumor metastasis: a new twist on epithelial‐mesenchymal transitions. Curr Biol 2004; 14: R719–21. [DOI] [PubMed] [Google Scholar]
- 11. Lambert E, Dasse E, Haye B, Petitfrere E. TIMPs as multifacial proteins. Crit Rev Oncol Hematol 2004; 49: 187–98. [DOI] [PubMed] [Google Scholar]
- 12. Takeichi M. Morphogenetic roles of classic cadherins. Curr Opin Cell Biol 1995; 7: 619–27. [DOI] [PubMed] [Google Scholar]
- 13. Berx G, Van Roy F. The E‐cadherin/catenin complex: an important gatekeeper in breast cancer carcinogenesis and malignant progression. Breast Cancer Res 2001; 3: 289–93. [DOI] [PMC free article] [PubMed] [Google Scholar]
- 14. Toyooka KO, Toyooka S, Virmani AK et al. Loss of expression and aberrant methylation of the CDH13 (H‐cadherin) gene in breast and lung carcinomas. Cancer Res 2001; 61: 4556–60. [PubMed] [Google Scholar]
- 15. Naor D, Nedvetzki S, Golan I, Melnik L, Faitelson Y. CD44 in cancer. Crit Rev Clin Lab Sci 2002; 39: 527–79. [DOI] [PubMed] [Google Scholar]
- 16. Naor D, Sionov RV, Ish‐Shalom D. CD44 structure, function, and association with the malignant process. Adv Cancer Res 1997; 71: 241–319. [DOI] [PubMed] [Google Scholar]
- 17. Aruffo A, Stamenkovic I, Melnick M, Underhill CB, Seed B. CD44 is the principal cell surface receptor for hyaluronate. Cell 1990; 61: 1303–13. [DOI] [PubMed] [Google Scholar]
- 18. Jalkanen S, Jalkanen M. Lymphocyte CD44 binds the COOH‐terminal heparin‐binding domain of fibronectin. J Cell Biol 1992; 116: 817–25. [DOI] [PMC free article] [PubMed] [Google Scholar]
- 19. Weber GF, Ashkar S, Glimcher MJ, Cantor H. Receptor–ligand interaction between CD44 and osteopontin (Eta‐1). Science 1996; 271: 509–12. [DOI] [PubMed] [Google Scholar]
- 20. Gotte M, Yip GW. Heparanase, hyaluronan, and CD44 in cancers: a breast carcinoma perspective. Cancer Res 2006; 66: 10233–7. [DOI] [PubMed] [Google Scholar]
- 21. Morris SF, O’Hanlon DM, McLaughlin R, McHale T, Connolly GE, Given HF. The prognostic significance of CD44s and CD44v6 expression in stage two breast carcinoma: an immunohistochemical study. Eur J Surg Oncol 2001; 27: 527–31. [DOI] [PubMed] [Google Scholar]
- 22. Auvinen P, Tammi R, Tammi M, Johansson R, Kosma VM. Expression of CD44s, CD44v3 and CD44v6 in benign and malignant breast lesions: correlation and colocalization with hyaluronan. Histopathology 2005; 47: 420–8. [DOI] [PubMed] [Google Scholar]
- 23. Watanabe O, Kinoshita J, Shimizu T et al. Expression of a CD44 variant and VEGF‐C and the implications for lymphatic metastasis and long‐term prognosis of human breast cancer. J Exp Clin Cancer Res 2005; 24: 75–82. [PubMed] [Google Scholar]
- 24. Diaz LK, Zhou X, Wright ET et al. CD44 expression is associated with increased survival in node‐negative invasive breast carcinoma. Clin Cancer Res 2005; 11: 3309–14. [DOI] [PubMed] [Google Scholar]
- 25. Fassina G, Ferrari N, Brigati C et al. Tissue inhibitors of metalloproteases: regulation and biological activities. Clin Exp Metastasis 2000; 18: 111–20. [DOI] [PubMed] [Google Scholar]
- 26. Freije J, Balbin M, Pendas AM, Sanchez LM, Puente XS, Lopez‐Otin C. Matrix metalloproteinases and tumor progression. Adv Exp Med Biol 2003; 532: 91–107. [DOI] [PubMed] [Google Scholar]
- 27. Yu WH, Yu S, Meng Q, Brew K, Woessner JF Jr. TIMP‐3 binds to sulfated glycosaminoglycans of the extracellular matrix. J Biol Chem 2000; 275: 31226–32. [DOI] [PubMed] [Google Scholar]
- 28. Baker AH, George SJ, Zaltsman AB, Murphy G, Newby AC. Inhibition of invasion and induction of apoptotic cell death of cancer cell lines by overexpression of TIMP‐3. Br J Cancer 1999; 79: 1347–55. [DOI] [PMC free article] [PubMed] [Google Scholar]
- 29. Bond M, Murphy G, Bennett MR, Newby AC, Baker AH. Tissue inhibitor of metalloproteinase‐3 induces a Fas‐associated death domain‐dependent type II apoptotic pathway. J Biol Chem 2002; 277: 13787–95. [DOI] [PubMed] [Google Scholar]
- 30. Leco KJ, Waterhouse P, Sanchez OH et al. Spontaneous air space enlargement in the lungs of mice lacking tissue inhibitor of metalloproteinases‐3 (TIMP‐3). J Clin Invest 2001; 108: 817–29. [DOI] [PMC free article] [PubMed] [Google Scholar]
- 31. Ahonen M, Ala‐Aho R, Baker AH et al. Antitumor activity and bystander effect of adenovirally delivered tissue inhibitor of metalloproteinases‐3. Mol Ther 2002; 5: 705–15. [DOI] [PubMed] [Google Scholar]
- 32. Loging WT, Reisman D. Inhibition of the putative tumor suppressor gene TIMP‐3 by tumor‐derived p53 mutants and wild type p53. Oncogene 1999; 18: 7608–15. [DOI] [PubMed] [Google Scholar]
- 33. Simpson JF, Gray R, Dressler LG et al. Prognostic value of histologic grade and proliferative activity in axillary node‐positive breast cancer: results from the Eastern Cooperative Oncology Group Companion Study, EST 4189. J Clin Oncol 2000; 18: 2059–69. [DOI] [PubMed] [Google Scholar]
- 34. Singletary SE, Connolly JL. Breast cancer staging: Working with the sixth edition of the AJCC Cancer Staging Manual. CA Cancer J Clin 2006; 56: 37–47. [DOI] [PubMed] [Google Scholar]
- 35. Livak KJ, Schmittgen TD. Analysis of relative gene expression data using real‐time quantitative PCR and the 2(–Delta Delta C(T)) method. Methods 2001; 25: 402–8. [DOI] [PubMed] [Google Scholar]
- 36. Jacques BK, Roelofs RW, Giesendorf BA et al. Normalization of gene expression measurements in tumor tissues: comparison of 13 endogenous control genes. Lab Invest 2005; 85: 154–9. [DOI] [PubMed] [Google Scholar]
- 37. Lyng MB, Laenkholm AV, Pallisgaard N, Ditzel HJ. Identification of genes for normalization of real‐time RT‐PCR data in breast carcinomas. BMC Cancer 2008; 8: 20. [DOI] [PMC free article] [PubMed] [Google Scholar]
- 38. Osborne C, Wilson P, Tripathy D. Oncogenes and tumor suppressor genes in breast cancer: potential diagnostic and therapeutic applications. The Oncologist 2004; 9: 361–77. [DOI] [PubMed] [Google Scholar]
- 39. Kurozumi K, Nakao K, Nishida T, Nakahara M, Ogino N, Tsujimoto M. Significance of biologic aggressiveness and proliferating activity in papillary thyroid carcinoma. World J Surg 1998; 22: 1237–42. [DOI] [PubMed] [Google Scholar]
- 40. De Alava E, Panizo A, Sola I, Rodriguez‐Rubio FI, Pardo‐Mindan FJ. CD44v6 expression is related to progression in renal epithelial tumours. Histopathology 1998; 33: 39–45. [DOI] [PubMed] [Google Scholar]
- 41. Bankfalvi A, Terpe HJ, Breukelmann D et al. Immunophenotypic and prognostic analysis of E‐cadherin and ß‐catenin expression during breast carcinogenesis and tumour progression: a comparative study with CD44. Histopathology 1999; 34: 25–34. [DOI] [PubMed] [Google Scholar]
- 42. Kanke M, Fujii M, Kameyama K et al. Role of CD44 variant exon 6 in invasion of head and neck squamous cell carcinoma. Arch Otolaryngol Head Neck Surg 2000; 126: 1217–23. [DOI] [PubMed] [Google Scholar]
- 43. Sillanpää S, Anttila MA, Voutilainen K et al. CD44 expression indicates favorable prognosis in epithelial ovarian cancer. Clin Cancer Res 2003; 9 (14): 5318–24. [PubMed] [Google Scholar]
- 44. Ngan CY, Yamamoto H, Seshimo I et al. A multivariate analysis of adhesion molecules expression in assessment of colorectal cancer. J Surg Oncol 2007; 95: 652–62. [DOI] [PubMed] [Google Scholar]
- 45. Yu Q, Toole BP, Stamenkovic I. Induction of apoptosis of metastatic mammary carcinoma cells in vivo by disruption of tumor cell surface CD44 function. J Exp Med 1997; 186: 1985–96. [DOI] [PMC free article] [PubMed] [Google Scholar]
- 46. Naor D, Sionov RV, Ish‐Shalom D. CD44, structure, function, and association with the malignant process. Adv Cancer Res 1997; 71: 241–319. [DOI] [PubMed] [Google Scholar]
- 47. Lopez JI, Camenisch TD, Stevens MV, Sands BJ, McDonald J, Schroeder JA. CD44 attenuates metastatic invasion during breast cancer progression. Cancer Res 2005; 65: 6755–63. [DOI] [PubMed] [Google Scholar]
- 48. Choi SH, Takahashi K, Eto H, Yoon SS, Tanabe KK. CD44s expression in human colon carcinomas influences growth of liver metastases. Int J Cancer 2000; 85: 523–6. [DOI] [PubMed] [Google Scholar]
- 49. Gamallo C, Palacios J, Suarez A et al. Correlation of E‐cadherin expression with differentiation grade and histological type in breast carcinoma. Am J Pathol 1993; 142: 987–93. [PMC free article] [PubMed] [Google Scholar]