

Abstract
Many studies have shown that tumor‐associated macrophages (TAMs) contribute to tumor development and poor prognosis in various cancers. In this study, we investigated the macrophage populations and phenotypes, and their correlation to angiogenesis, immunosuppression, and clinical prognosis in intrahepatic cholangiocarcinoma (ICC). CD68 (+) and CD163 (+) macrophage infiltration was analyzed in paraffin‐embedded tissue samples from 39 patients. CD163 is used as a marker of M2 macrophages. Neovascularization and infiltration of forkhead box P3 (FOXP3) (+) regulatory T cells were also evaluated. The number of CD68 (+) and CD163 (+) macrophages was positively correlated with the numbers of vessels and regulatory T cells. The number of CD163 (+) cells was more closely associated with them. Intrahepatic cholangiocarcinoma (ICC) patients with high counts of CD163 (+) macrophages showed poor disease‐free survival (P = 0.0426). The macrophage density was not correlated with overall survival. In an in vitro study using ICC cell lines (HuCCT1, RBE, and MEC) and human macrophages, tumor cell supernatant (TCS) from cell lines induced an activation of signal transducers and activators of transcription‐3 (Stat3) and macrophage polarization toward the M2 phenotype. Tumor cell supernatant (TCS) from HuCCT1 most strongly induced Stat3 activation and production of cytokines and other bioactive molecules such as interleukin (IL)‐10, vascular endothelial growth factor (VEGF)‐A, transforming growth factor (TGF)‐β, and matrix metalloproteinase (MMP)‐2. Down‐regulation of Stat3 by siRNA significantly suppressed the production of IL‐10 and VEGF‐A. These results provide suggestive evidence that TAMs contribute to cancer progression via Stat3 activation, and CD163 is useful for evaluating M2 TAMs and predicting the clinical prognosis of ICC patients. (Cancer Sci)
Intrahepatic cholangiocarcinoma (ICC) is the second most common primary liver cancer and accounts for 5–10% of primary hepatic cancers.( 1 , 2 , 3 ) Intrahepatic cholangiocarcinoma (ICC) arises from the intrahepatic bile ducts and continues to be associated with a poor prognosis, 5‐year survival rates following curative resection ranging from 20% to 63%, and a high recurrence rate.( 4 , 5 , 6 ) Complete surgical resection is the only option for curative treatment of ICC at the present time.
Recent studies have shown that tumor‐associated macrophages (TAMs) contribute to tumor growth, invasion, and metastasis by producing various mediators in many cancers.( 7 , 8 , 9 , 10 ) Monocytes are recruited from the circulation into local tissues or at sites of injury, inflammation, infection, or malignancy where they differentiate into tissue macrophages.( 7 , 8 , 9 , 10 ) They acquire a distinct phenotype and activation status in response to factors present in the local tissue microenvironment. Interferon‐γ induces “classical” activation of macrophages, while anti‐inflammatory mediators, such as interleukin (IL)‐10, IL‐4, and IL‐13 provoke “alternative” activation of macrophages.( 7 , 8 , 9 , 10 ) Classically activated macrophages and alternatively activated macrophages are referred as M1 and M2 respectively.( 11 , 12 , 13 ) Since M2 macrophages are oriented toward promoting tumor growth, remodeling tissues, promoting angiogenesis, and suppressing adaptive immunity in human tumors, the distribution of M2 macrophages in various cancer tissues has been focused upon in recent studies.( 14 , 15 , 16 , 17 , 18 , 19 )
In ICC, the significance of TAM infiltration has been unclear. The aim of this study was to evaluate the relationship between TAMs, especially M2‐type TAMs, and angiogenesis, immunosuppression, and clinical prognosis in ICC. In addition, we investigated the mechanisms of macrophage differentiation into M2 phenotype by tumor‐derived factors.
Materials and Methods
Patients and specimens. From January 1993 to June 2008, 55 ICC patients underwent surgical resection and were pathologically confirmed as having ICC at the Kumamoto University Hospital, Kumamoto, Japan.( 20 ) To exclude the influence of inflammation and tissue debridement cases with infections and necrosis were excluded. Staging was dependent on the International Union Against Cancer tumor‐node‐metastasis classification.( 21 , 22 ) The mean follow‐up period after hepatectomy was 39.7 ± 35.2 months (range, 3–120 months). Informed written consent was obtained from all patients in accordance with protocols approved by the Kumamoto University Review Board. Tissue samples were fixed in 10% neutral buffered formalin and were embedded in paraffin.
Cell culture. Three human cholangiocarcinoma cell lines (RBE, MEC, and HuCCT1) were obtained from the Cell Resource Center for Biochemical Research, Tohoku University (Sendai, Japan). Cells were cultured in Dulbecco’s modified Eagle’s medium (DMEM; Wako, Tokyo, Japan). Tumor culture supernatants (TCS) were prepared as described previously.( 15 ) The human monocytic cell line THP‐1 cells were obtained from the American Type Culture Collection (ATCC; Manassas, VA, USA) and were cultured in DMEM. All mediums were supplemented with 10% fetal bovine serum, penicillin/streptomycin (Invitrogen, Tokyo, Japan).
Macrophage culture. Peripheral blood mononuclear cells (PBMCs) were obtained from healthy volunteer donors. CD14+ monocytes were purified from PBMCs by positive selection via magnetic‐activated cell‐sorting technology (Miltenyi Biotec, Bergisch Gladbach, Germany). Informed written consent was obtained from all healthy donors. CD14+ monocytes were cultured with granulocyte macrophage‐colony stimulating factor (GM‐CSF) (10 ng/mL; Wako) for 5 days to induce macrophage differentiation.
Preparation of cell block specimens. Primary macrophages and THP‐1 cells were fixed in 10% neutral buffered formalin, suspended in 1% sodium arginate, and solidified by the addition of 1 M calcium chloride. Solidified specimens were embedded in paraffin in a routine fashion.
Immunohistochemistry. Immunohistochemical staining was performed on 4‐μm sections obtained from paraffin‐embedded conventional blocks. Table 1 provides the data for the monoclonal antibodies. After samples were reacted with primary antibodies, they were incubated with horseradish peroxidase‐labeled goat antimouse or antirabbit secondary antibody (Nichirei, Tokyo, Japan). The reaction was visualized using the diaminobenzidine substrate system (Nichirei). CD68‐, CD163‐, forkhead box P3 (FOXP3)‐positive cells, or CD34‐positive vessels in randomly chosen intra‐tumor area were counted in 20 high power fields (0.028 mm2 per field) by two pathologists (Y.K. and H.H.) who were blind to the information of the samples. The data of Y.K. and H.H. were averaged and analyzed statistically.
Table 1.
Monoclonal antibodies used in this study
| Antigen | Clone | Source |
|---|---|---|
| CD68 | PG‐M1 | Dako, Glostrup, Denmark |
| CD163 | 10D6 | Novocastra, Newcastle, UK |
| CD34 | QBEnd‐10 | Dako, Glostrup, Denmark |
| FOXP3 | 236A/E7 | AbD Serotec, Oxford, UK |
| pStat3 | D3A7 | Cell Signaling Technology, Danvers, MA, USA |
| IL‐6 | 10C12 | Novocastra, Newcastle, UK |
FOXP3, forkhead box P3; IL‐6, interleukin‐6; pStat3, phospho‐signal transducer and activator of transcription 3.
Macrophages were detected by immunostaining of CD68, and the M2 population was evaluated by immunostaining of CD163 as described previously.( 15 ) To evaluate regulatory T cells, immunostaining of FOXP3 was performed. To evaluate neovascularization, vessels were stained by anti‐CD34 antibody. Double‐immunostainings for CD68/CD163 and FOXP3/CD4 were performed as described previously.( 15 )
Cell enzyme‐linked immunosorbent assay (Cell‐ELISA) and cytokine ELISA. Monocytes were cultured in a 96‐well plate (5 × 10⁴ cells per well). Primary monocyte‐derived macrophages were stimulated with 50% TCS or medium alone (control). Expression of CD163 on human macrophages was evaluated with the aid of a cell‐ELISA, as described previously.( 23 ) Evaluation of IL‐10 in supernatant was performed with an ELISA kit (eBiosciences, San Diego, CA, USA).
Quantitative real‐time polymerase chain reaction (Q‐PCR). Total RNA was extracted by using an RNA STAT‐60 extraction kit (Tel‐Test, Friendswood, TX, USA). RNA was reverse‐transcribed by means of the ExScript RT reagent kit (Takara, Shiga, Japan). Quantitative PCR was performed by using TaqMan polymerase, with the detection of Syber Green fluorescence (Takara) by an ABI Prism 7300 Sequence Detector (Applied Biosystems, Foster City, CA, USA). Primers were as follows: CD163, 5′‐CGAGTTAACGCCAGTAAGG‐3′ (forward) and 5′‐GAACATGTCACGCCAGC‐3′ (reverse); CD204, 5′‐CCAGGGACATGGGAATGCAA‐3′ (forward) and 5′‐CCAGTGGGACCTCGATCTCC‐3′ (reverse); IL‐10, 5′‐GGTTGCCAAGCC‐TTGTCTGA‐3′ (forward) and 5′‐AGGGAGTTCACATGCGCCT‐3′ (reverse); vascular endothelial growth factor‐A (VEGF‐A), 5′‐TGCTCTACCTCCACCATGCCAAGT‐3′ (forward) and 5′‐ GCGCAGAGTCTCCTCTTCCTTCAT‐3′ (reverse); TGF‐β, 5′‐TTGCTTCAGCTCCACGGAGAA‐3′ (forward) and 5′‐ACGTAGTACACGATGGGCAGC‐3′ (reverse); matrix metalloproteinase (MMP)‐2, 5′‐ATGGATCCTGGCTTTCCC‐3′ (forward) and 5′‐GCTTCCAAACTTCACGCTG‐3′ (reverse); MMP9, 5′‐ATGCGTGGAGAGTCGAAATC‐3′ (forward) and 5′‐TACACGCGAGTGAAGGTGAG‐3′ (reverse); GAPDH, 5′‐GCACCGTCAAGGCTGAGAAC‐3′ (forward) and 5′‐TGGTGAAGACGCCAGTGGA‐3′ (reverse). Relative quantitation of mRNA levels was normalized by using expression of GAPDH as a housekeeping gene.
Small interfering RNA (siRNA) in human macrophages and tumor cells. Primary monocyte‐derived macrophages were transfected with siRNA against human signal transducers and activators of transcription‐3 (Stat3) (sc‐29493; Santa Cruz Biotechnology, Santa Cruz, CA, USA) using Lipofectamine RNAi MAX (Invitrogen). Control siRNA (sc‐44230; Santa Cruz Biotechnology) was used as a negative control.
Statistics. Statistical analysis was carried out using StatMate III (ATOMS, Tokyo, Japan). Associations between different categorical variables were assessed using the anova test. The simultaneous relationship between multiple prognostic factors for survival was assessed using the Cox proportional hazards model with stepwise backwards reduction. Experimental in vitro data represent two or three independent experiments. Data are expressed as mean ± SD. The Mann–Whitney U‐test was used for two‐group comparisons. A value of P < 0.05 was considered statistically significant.
Results
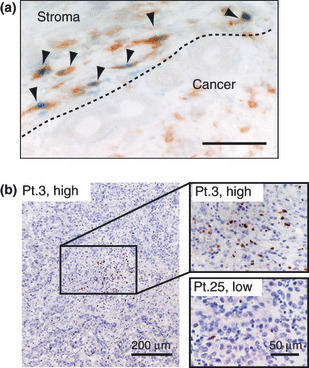
Macrophage distribution in ICC. As shown in Figure 1(a), CD68 (+) and CD163 (+) cells were detected in tumor tissues including tumor stroma and nest. Double immunostaining showed a part of CD68 (+) cells expressed CD163 (Fig. 1b). In most cases, the number of CD163 (+) cells was lower than the number of CD68 (+) cells.
Figure 1.

Immunohistochemical analysis of CD68‐ and CD163‐positive cells in intrahepatic cholangiocarcinoma. (a) In patient no. 3 (Pt.3), CD68‐positive tumor‐associated macrophages (TAMs) highly expressed CD163. However, CD163 was not detected in CD68‐positive TAMs in patient no. 25 (Pt.25). The density of macrophages was classified into two groups (high density or low density). (b) Double‐immunostaining of CD68 and CD163 antigens were performed. CD68 (brown) and CD163 (blue) antigens were mainly localized in cytoplasm and surface cell membrane respectively. Double‐positive cells are indicated by arrows.
Correlation between macrophage infiltration, the number of regulatory T cells, and the number of vessels. Since we confirmed that almost all FOXP3 (+) cells were positive for CD4 by double staining (Fig. 2a), FOXP3 (+) cells were counted as regulatory T cell (Fig. 2b). The number of macrophages detected by CD68 and CD163 was associated with the number of vessels and regulatory T cells (Fig. 3). Interestingly, the numbers of vessels and regulatory T cells showed more intimate correlation with the number of CD163 (+) M2 macrophages than that of CD68(+) macrophages (Fig. 3).
Figure 2.
Immunohistochemical analysis of FOXP3‐positive regulatory T cells. (a) Double‐immunostaining of FOXP3 and CD4 antigens. FOXP3 (blue) and CD4 (brown) were stained in the nucleus and cytoplasm of infiltrating leukocytes respectively. Double positive cells are indicated by arrows. Scale bar: 20 μm. (b) FOXP3‐positive cells were counted and classified into two groups (high density or low density).
Figure 3.
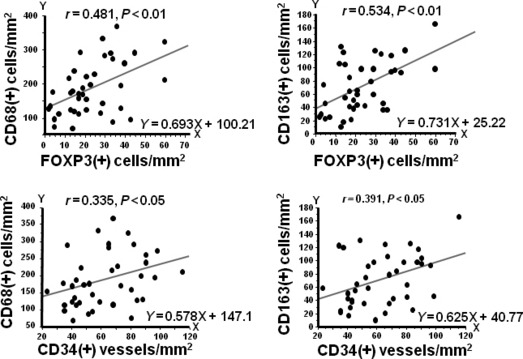
Correlation between the numbers of CD68(+) or CD163(+) macrophages and the number of vessels and regulatory T cells. Significant association was observed between the numbers of CD68(+) or CD163(+) macrophages, and the numbers of regulatory T cells or vessels. FOXP3.
Correlation between macrophage infiltration and clinoco‐pathologic factors. To analyze the correlation between clinicopathologic factors of ICC and the tumor‐infiltrating macrophages or regulatory T cells, the median value of the cell number was used to divide the patients into two groups. The density of CD68 (+) cells was associated with histological differentiation, and the density of CD163 (+) cells was correlated with gender and stage (Table 2). There was no significant difference between the FOXP3high and FOXP3low groups.
Table 2.
Clinicopathologic factors and the number of macrophages and regulatory T cells
| Variable | Number | CD68 (+) cells | P‐value | CD163 (+) cells | P‐value | FOXP3 (+) cells | P‐value | |||
|---|---|---|---|---|---|---|---|---|---|---|
| High | Low | High | Low | High | Low | |||||
| Age (years) | ||||||||||
| <67 | 20 | 9 | 11 | NS | 10 | 10 | NS | 11 | 9 | NS |
| ≥67 | 19 | 10 | 9 | 10 | 9 | 9 | 10 | |||
| Gender | ||||||||||
| Male | 27 | 12 | 15 | NS | 11 | 16 | 0.048 | 14 | 13 | NS |
| Female | 12 | 7 | 5 | 9 | 3 | 6 | 6 | |||
| HBsAg or HCV ab | ||||||||||
| Negative | 34 | 17 | 17 | NS | 18 | 16 | NS | 17 | 17 | NS |
| Positive | 5 | 2 | 3 | 2 | 3 | 3 | 2 | |||
| Lymph node metastasis | ||||||||||
| Negative | 33 | 16 | 17 | NS | 17 | 16 | NS | 17 | 16 | NS |
| Positive | 6 | 3 | 3 | 3 | 3 | 3 | 3 | |||
| UICC stage | ||||||||||
| I and II | 29 | 12 | 17 | NS | 12 | 17 | 0.035 | 14 | 15 | NS |
| III and IV | 10 | 7 | 3 | 8 | 2 | 6 | 4 | |||
| Tumor size (cm) | ||||||||||
| <4 | 18 | 8 | 10 | NS | 10 | 8 | NS | 11 | 7 | NS |
| ≥4 | 21 | 11 | 10 | 10 | 11 | 9 | 12 | |||
| Histologic differentiation | ||||||||||
| Well–moderate | 30 | 12 | 18 | 0.047 | 14 | 16 | NS | 14 | 16 | NS |
| Poor | 9 | 7 | 2 | 6 | 3 | 6 | 3 | |||
| Vascular invasion | ||||||||||
| Negative | 6 | 2 | 4 | NS | 3 | 3 | NS | 2 | 4 | NS |
| Positive | 33 | 17 | 16 | 17 | 16 | 18 | 15 | |||
HBsAg, hepatitis B surface antigen; HCV, hepatitis C virus; NS, not significant; UICC, International Union Against Cancer.
Correlation between macrophage infiltration and clinical prognosis. Univariate and multivariate analysis showed that the infiltration of CD163 (+) macrophages was associated with poor disease‐free survival (DFS) but not with overall survival (OS) (Fig. 4; 3, 4). CD68 (+) macrophages were not associated with DFS and OS, and other factors were also not correlated with DFS and OS (Fig. 4; 3, 4).
Figure 4.
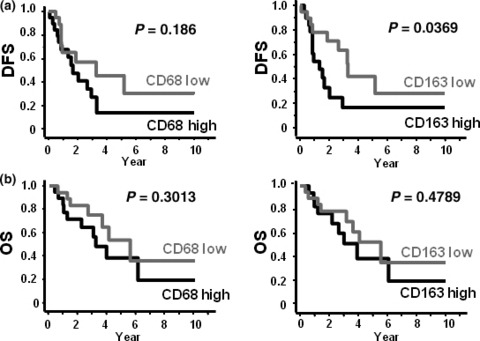
Correlation between macrophages and clinical prognosis. (a) Disease‐free survival (DFS) and macrophage density. (b) Overall survival (OS) and macrophage density.
Table 3.
Univariate and multivariate Cox regression analysis of potential prognostic factors for DFS
| Variable | Univariate analysis | Multivariate analysis | ||||
|---|---|---|---|---|---|---|
| Number | Median survival (months) | P‐value | HR | 95% CI | P‐value | |
| UICC stage | ||||||
| I, II | 29 | 21.6 | 0.1003 | |||
| III, IV | 10 | 9.9 | ||||
| Tumor size (cm) | ||||||
| <4 | 18 | 18.9 | 0.0649 | 2.048 | 0.862–5.077 | 0.1218 |
| ≥4 | 21 | 10.9 | ||||
| Histologic differentiation | ||||||
| Well–Mod. | 30 | 18.1 | 0.8534 | |||
| Poor | 9 | 19.8 | ||||
| Lymph node metastasis | ||||||
| + | 12 | 9.7 | 0.0219 | 2.44 | 0.335–2.213 | 0.0269 |
| − | 27 | 29.8 | ||||
| CD68 | ||||||
| High | 19 | 16.3 | 0.0623 | |||
| Low | 20 | 18.3 | ||||
| CD163 | ||||||
| High | 20 | 11.2 | 0.0369 | 2.48 | 1.031–5.983 | 0.0426 |
| Low | 19 | 23.7 | ||||
| FOXP3 | ||||||
| High | 20 | 10.4 | 0.0999 | 1.003 | 0.244–4.129 | 0.9964 |
| Low | 19 | 20.3 | ||||
CI, confidence interval; DFS, disease free survival; FOXP3, forkhead box P3; HR, hazard ratio; UICC, International Union Against Cancer.
Table 4.
Univariate and multivariate Cox regression analysis of potential prognostic factors for OS
| Variable | Univariate analysis | Multivariate analysis | ||||
|---|---|---|---|---|---|---|
| Number | Median survival (months) | P‐value | HR | 95% CI | P‐value | |
| UICC stage | ||||||
| I, II | 29 | 31.8 | 0.1656 | |||
| III, IV | 10 | 25.5 | ||||
| Tumor size (cm) | ||||||
| <4 | 18 | 25.3 | 0.0876 | 1.319 | 0.257–6.765 | 0.7398 |
| ≥4 | 21 | 29.6 | ||||
| Histologic differentiation | ||||||
| Well–Mod. | 30 | 28.8 | 0.1612 | |||
| Poor | 9 | 27 | ||||
| Lymph node metastasis | ||||||
| + | 12 | 18.2 | 0.1249 | 2.09 | 0.31–1.502 | 0.1331 |
| − | 27 | 32.3 | ||||
| CD68 | ||||||
| High | 19 | 27 | 0.1322 | |||
| Low | 20 | 28.8 | ||||
| CD163 | ||||||
| High | 20 | 25.3 | 0.1252 | |||
| Low | 19 | 36.6 | ||||
| FOXP3 | ||||||
| High | 20 | 21.7 | 0.23 | |||
| Low | 19 | 38.7 | ||||
CI, confidence interval; FOXP3, forkhead box P3; HR, hazard ratio; OS, overall survival; UICC, International Union Against Cancer.
Tumor‐derived factors induced macrophage differentiation into the M2 phenotype via the Stat3 pathway. Exposure to TCS significantly up‐regulated macrophage expression of CD163 and IL‐10 production following lipopolysaccharide (LPS) exposure (Fig. 5a). As shown in Figure 5(b), Stat3 activation was induced by TCSs. Tumor cell supernatant (TCS) from HuCCT1 strongly induced Stat3 activation and macrophage polarization toward M2; however, lesser activation and polarization were observed in case of TCS from MEC and RBE.
Figure 5.

Macrophage differentiation into the M2 phenotype by tumor‐cell supernatant (TCS). (a) Cultured macrophages were stimulated by TCS for 2 days, and then CD163 expression, a marker of M2 status, was examined by cell‐ELISA assay. Macrophages cultured with TCS were stimulated with LPS and interleukin (IL)‐10 (M2‐related cytokine) production was evaluated by ELISA. (b) Signal transducers and activators of transcription‐3 (Stat3) activation by TCS was examined by using the monocytic cell line THP‐1 and cultured macrophages. The following cells were cultured with TCS for 1 h, and pStat3 was evaluated by immunostaining. (c) Cultured macrophages were stimulated by TCS for 15 h, and the mRNA expression of molecules and cytokines which related to the M2 phenotype was examined by quantitative PCR (Q‐PCR). *P < 0.05. MMP2, matrix metalloproteinase 2; TGF‐β, transforming growth factor‐β. VEGF‐A, vascular endothelial growth factor A. (d) Signal transducers and activators of transcription‐3 (Stat3) protein in macrophages was silenced by siRNA. Western blot analysis revealed down‐regulation of Stat3 protein by siRNA. (e) Following the inhibition of Stat3 expression, macrophages were stimulated by TCS from HuCCT1. The mRNA expression of CD163 and cytokines was evaluated by Q‐PCR. *P < 0.05 (compared with control siRNA).
We evaluated the cytokine expression by macrophages in response to TCS stimulation. Exposure to TCS from HuCCT1 significantly enhanced the mRNA expression of M2‐type cytokines such as IL‐10, VEGF‐A, TGF‐β, and MMP2 (Fig. 5c). To clarify the involvement of Stat3 in this process, Stat3 expression in macrophages was silenced by siRNA and the macrophages were then stimulated by TCS from HuCCT1 (Fig. 5d). The results showed a significant down‐regulation of mRNA expression of CD163, IL‐10, and VEGF‐A by silencing Stat3 (Fig. 5e). These results indicate that macrophage differentiation into the M2 phenotype and the contribution to angiogenesis and immunosuppression are dependent on the Stat3 pathway in the ICC microenvironment.
Interleukin (IL)‐6 production from tumor cells was associated with the number of CD68 (+) TAMs in vivo. Next we investigated the relationship between IL‐6 production and macrophage population by means of immunostaining because IL‐6 is one of the major molecules that influence macrophage differentiation. In 19 cases of ICC, strong IL‐6 staining in tumor cells was observed, whereas no or low IL‐6 staining was observed in the other 20 cases (Fig. 6a). Significant correlation between IL‐6 staining and the number of CD68 (+) macrophages was noted (Fig. 6b); however, IL‐6 production from tumor cells was not associated with the numbers of CD163 (+) macrophages, regulatory T cells, or vessels (data not shown). There was no significant correlation between IL‐6 expression and clinical prognosis (data not shown).
Figure 6.
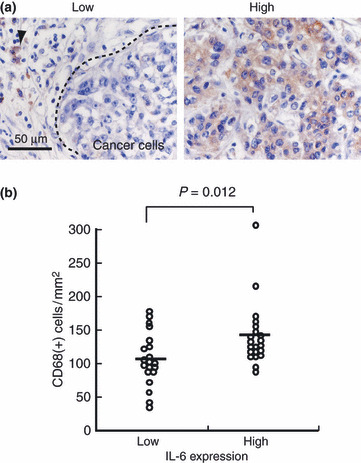
(a) Interleukin (IL)‐6 expression in intrahepatic cholangio‐carcinoma (ICC) cancer cells. Strong immunostaing of IL‐6 was observed in patient (Pt.) 14 (right panel), whereas no IL‐6 expression in cancer cells was seen in Pt. 25 (left panel). Plasma cells (arrowheads) were positively stained as an internal control (right panel). (b) Significant correlation between the numbers of CD68(+) macrophages and IL‐6 production in cancer cells.
Discussion
The relation between TAM infiltration and neovascularization in the tumor microenvironment is well established ( 9 , 23 ) and a correlation between TAM distribution and regulatory T cells has recently been indicated by many researchers.( 24 , 25 ) M2 macrophages induce the infiltration and differentiation of regulatory T cells, and regulatory T cells induce macrophage differentiation toward M2 phenotype.( 26 ) These interactions are considered to be mediated by some chemokines such as CCL18 and CCL22 and anti‐inflammatory molecules such as IL‐10, TGF‐β, and B7‐H4.( 26 , 27 , 28 ) In the present study, we evaluated the relationship between the infiltration of TAMs and regulatory T cells, and vascular formation in ICC. Interestingly, CD163 (+) M2 TAM was found to be more closely associated with the induction of vascular formation and the number of regulatory T cells.
Macrophage heterogeneity in the tumor microenvironment has been the focus of recent research. We have reported that M2 TAMs are significantly associated with the poor prognosis of patients with glioblastoma and have suggested that the interaction of tumor cells and TAMs contributes to tumor growth.( 15 ) In ovarian cancer tissues, the number of M2 TAMs is correlated with histological malignancy.( 16 ) In melanoma tissues, the number of TAMs and the soluble form of CD163 in serum was well related to poor prognosis.( 17 ) In pancreatic cancer, the number of M2 TAMs is closely related to poor prognosis.( 19 ) In our present study, M2 TAMs were associated with metastasis and recurrence, namely significant association with DFS, but not with OS in ICC. Overall survival (OS) mainly depends on the response of cancer cells to chemotherapy, and there might be little relation between sensitivity of cancer cells to anticancer drugs and TAMs in ICC. The application of new combination chemotherapy with gemcitabine and S‐1 for recent patients with recurrent ICC after hepatic resection( 29 ) might provide an explanation for the discrepancy between DFS and OS.
Tumor‐derived factors such as IL‐6, IL‐10, TGF‐β, and CSF‐1 are believed to induce TAMs to polarize toward an M2 phenotype and promote tumor progression.( 24 , 28 ) We therefore evaluated the effects of TCS from the RBE, MEC, and HuCCT1 human ICC cell lines on macrophage differentiation. As shown in Figure 5, TCS from HuCCT1 cells differentiated macrophages toward the M2 phenotype significantly more than TCS from MEC and RBE cells. Since HuCCT1 cells possess the fastest proliferative activity among these cell lines, we speculate that some cytokines produced by HuCCT1 might be involved in both tumor cell proliferation and macrophage polarization.
It is well known that IL‐6 plays a major role in tumor development, angiogenesis, and metastasis in many kinds of cancers by autocrine and paracrine mechanisms.( 30 ) As shown in Figure 6, IL‐6 expression in tumor cells was correlated to the number of infiltrating TAMs, but not to the numbers of M2 TAMs, regulatory T cells, or vessels. Since IL‐6 stimulates macrophages and induces CCL2 production,( 31 ) we speculate that the infiltration of macrophages into ICC tissues could be enhanced by CCL2 produced by IL‐6‐stimulated macrophages, though we did not evaluate CCL2 production.
Pollard et al. have demonstrated in the murine model that recruitment of TAMs is necessary for breast cancer metastasis and the importance of tumor cell‐macrophage interactions in extravasation of tumor cell by macrophage‐derived colony stimulating factor‐1.( 25 , 32 , 33 ) Robinson et al. ( 34 ) have shown that the tumor microenvironment of metastasis (TMEM), which means the interaction of cancer cells, endothelial cells, and TAMs, induces vascular invasion and distant metastasis. In the present study, although we did not evaluate the TMEM, cell–cell interactions of cancer cells, endothelial cells, and M2 polarized TAMs may influence cancer cell metastasis and recurrence in ICC.
Since it is well known that tumor cell‐derived factors induce macrophage polarization into the M2 phenotype and the Stat3 pathway contributes to M2 polarization,( 10 , 35 ) we evaluated Stat3 activation in macrophages by TCS. We have shown that M2 polarization of macrophages is dependent on Stat3 activation by TCS. Stat3 also affects the tumor microenvironment and tumor development by virtue of its association with immunosuppression, angiogenesis, and cancer cell proliferation.( 36 , 37 , 38 ) Therefore, Stat3 is thought to be an important target molecule for anticancer therapy. Many researchers have reported the identification of various Stat3 inhibitors in recent years.( 39 ) Hussain et al. ( 40 ) have demonstrated that a small molecule inhibitor of Stat3 blocks macrophage differentiation into the immunosuppressive phenotype in glioblastoma and have indicated its usefulness for cancer therapy. Stat3 inhibitors may also provide a promising approach for anticancer therapy of ICC.
In summary, we have shown that the relationship between the numbers of TAMs, vascular, and regulatory T cells in ICC. M2 TAMs are closely associated with the induction of vascular and regulatory T cells. Since the high density of CD163 (+) M2 TAMs in tissues is an independent risk factor of DFS, CD163 (+) M2 TAMs may be useful markers for assessing the clinical prognosis of patients with ICC. In addition, in vitro study indicated that activation of the Stat3 pathway is involved in macrophage differentiation and development of the tumor microenvironment. Stat3 inhibitors could be effective in preventing tumor progression in ICC patients by regulating the tumor microenvironment.
Acknowledgments
We thank Ms Yui Hayashida, Ms Emi Kiyota, Mr Osamu Nakamura, and Mr Takenobu Nakagawa for their technical assistance. This study was supported in part by Grants‐in‐Aid for Scientific Research (B20390113, 21790388, 21591757) from the Ministry of Education, Culture, Sports, Science, and Technology of Japan.
References
- 1. Shirabe K, Shimada M, Harimoto N et al. Intrahepatic cholangiocarcinoma: its mode of spreading and therapeutic modalities. Surgery 2002; 131: S159–64. [DOI] [PubMed] [Google Scholar]
- 2. Shirabe K, Shimada M, Tsujita E et al. Prognostic factors in node‐negative intrahepatic cholangiocarcinoma with special reference to angiogenesis. Am J Surg 2004; 187: 538–42. [DOI] [PubMed] [Google Scholar]
- 3. Hanazaki K, Kajikawa S, Shimozawa N et al. Prognostic factors of intrahepatic cholangiocarcinoma after hepatic resection: univariate and multi‐variate analysis. Hepatogastroenterology 2002; 49: 311–6. [PubMed] [Google Scholar]
- 4. Suzuki H, Isaji S, Pairojkul C, Uttaravichien T. Comparative clinico‐pathological study of resected intrahepatic cholangiocarcinoma in northeast Thailand and Japan. J Hepatobiliary Pancreat Surg 2000; 7: 206–11. [DOI] [PubMed] [Google Scholar]
- 5. Isaji S, Kawarada Y, Taoka H, Tabata M, Suzuki H, Yokoi H. Clinicopathological features and outcome of hepatic resection for intrahepatic cholangiocarcinoma in Japan. J Hepatobiliary Pancreat Surg 1999; 6: 108–16. [DOI] [PubMed] [Google Scholar]
- 6. DeOliveira ML, Cunningham SC, Cameron JL et al. Cholangiocarcinoma: thirty‐one‐year experience with 564 patients at a single institution. Ann Surg 2007; 245: 755–62. [DOI] [PMC free article] [PubMed] [Google Scholar]
- 7. Gordon S. Alternative activation of macrophages. Nat Rev Immunol 2003; 3: 23–35. [DOI] [PubMed] [Google Scholar]
- 8. Sica A, Schioppa T, Mantovani A, Allavena P. Tumour‐associated macro‐phages are a distinct M2 polarised population promoting tumour progression: potential targets of anti‐cancer therapy. Eur J Cancer 2006; 42: 717–27. [DOI] [PubMed] [Google Scholar]
- 9. Pollard JW. Tumour‐educated macrophages promote tumour progression and metastasis. Nat Rev Cancer 2004; 4: 71–8. [DOI] [PubMed] [Google Scholar]
- 10. Hallam S, Escorcio‐Correia M, Soper R, Schultheiss A, Hagemann T. Activated macrophages in the tumour microenvironment‐dancing to the tune of TLR and NF‐kappaB. J Pathol 2009; 219: 143–52. [DOI] [PMC free article] [PubMed] [Google Scholar]
- 11. Mantovani A, Sozzani S, Locati M, Allavena P, Sica A. Macrophage polarization: tumor‐associated macrophages as a paradigm for polarized M2 mononuclear phagocytes. Trends Immunol 2002; 23: 549–55. [DOI] [PubMed] [Google Scholar]
- 12. Mosser DM. The many faces of macrophage activation. J Leukoc Biol 2003; 73: 209–12. [DOI] [PubMed] [Google Scholar]
- 13. Martinez FO, Gordon S, Locati M, Mantovani A. Transcriptional profiling of the human monocyte‐to‐macrophage differentiation and polarization: new molecules and patterns of gene expression. J Immunol 2006; 177: 7303–11. [DOI] [PubMed] [Google Scholar]
- 14. Van Dongen M, Savage ND, Jordanova ES et al. Anti‐inflammatory M2 type macrophages characterize metastasized and tyrosine kinase inhibitor‐treated gastrointestinal stromal tumors. Int J Cancer 2009; [Epub ahead of print]. [DOI] [PubMed] [Google Scholar]
- 15. Komohara Y, Ohnishi K, Kuratsu J, Takeya M. Possible involvement of the M2 anti‐inflammatory macrophage phenotype in growth of human gliomas. J Pathol 2008; 216: 15–24. [DOI] [PubMed] [Google Scholar]
- 16. Kawamura K, Komohara Y, Takaishi K, Katabuchi H, Takeya M. Detection of M2 macrophages and colony‐stimulating factor 1 expression in serous and mucinous ovarian epithelial tumors. Pathol Int 2009; 59: 300–5. [DOI] [PubMed] [Google Scholar]
- 17. Jensen TO, Schmidt H, Moller HJ et al. Macrophage markers in serum and tumor have prognostic impact in American Joint Committee on Cancer stage I/II melanoma. J Clin Oncol 2009; 27: 3330–7. [DOI] [PubMed] [Google Scholar]
- 18. Espinosa I, Beck AH, Lee CH et al. Coordinate expression of colony‐stimulating factor‐1 and colony‐stimulating factor‐1‐related proteins is associated with poor prognosis in gynecological and nongynecological leiomyosarcoma. Am J Pathol 2009; 174: 2347–56. [DOI] [PMC free article] [PubMed] [Google Scholar]
- 19. Kurahara H, Shinchi H, Mataki Y et al. Significance of M2‐polarized tumor‐associated macrophage in pancreatic cancer. J Surg Res 2009; [Epub ahead of print]. [DOI] [PubMed] [Google Scholar]
- 20. Okabe H, Beppu T, Hayashi H et al. Hepatic stellate cells may relate to progression of intrahepatic cholangiocarcinoma. Ann Surg Oncol 2009; 16: 2555–64. [DOI] [PubMed] [Google Scholar]
- 21. Nozaki Y, Yamamoto M, Ikai I et al. Reconsideration of the lymph node metastasis pattern (N factor) from intrahepatic cholangiocarcinoma using the International Union Against Cancer TNM staging system for primary liver carcinoma. Cancer 1998; 83: 1923–9. [PubMed] [Google Scholar]
- 22. Aurello P, D’Angelo F, Rossi S et al. Classification of lymph node metastases from gastric cancer: comparison between N‐site and N‐number systems. Our experience and review of the literature. Am Surg 2007; 73: 359–66. [PubMed] [Google Scholar]
- 23. Sica A, Larghi P, Mancino A et al. Macrophage polarization in tumour progression. Semin Cancer Biol 2008; 18: 349–55. [DOI] [PubMed] [Google Scholar]
- 24. Solinas G, Germano G, Mantovani A, Allavena P. Tumor‐associated macrophages (TAM) as major players of the cancer‐related inflammation. J Leukoc Biol 2009; 86: 1065–1073. [DOI] [PubMed] [Google Scholar]
- 25. Pollard JW. Macrophages define the invasive microenvironment in breast cancer. J Leukoc Biol 2008; 84: 623–30. [DOI] [PMC free article] [PubMed] [Google Scholar]
- 26. Guan Y, Yu S, Zhao Z, Ciric B, Zhang GX, Rostami A. Antigen presenting cells treated in vitro by macrophage colony‐stimulating factor and autoantigen protect mice from autoimmunity. J Neuroimmunol 2007; 192: 68–78. [DOI] [PMC free article] [PubMed] [Google Scholar]
- 27. Kryczek I, Wei S, Zhu G et al. Relationship between B7‐H4, regulatory T cells, and patient outcome in human ovarian carcinoma. Cancer Res 2007; 67: 8900–5. [DOI] [PubMed] [Google Scholar]
- 28. Sica A, Allavena P, Mantovani A. Cancer related inflammation: the macrophage connection. Cancer Lett 2008; 267: 204–15. [DOI] [PubMed] [Google Scholar]
- 29. Sasaki T, Isayama H, Nakai Y et al. Multicenter, phase II study of gemcitabine and S‐1 combination chemotherapy in patients with advanced biliary tract cancer. Cancer Chemother Pharmacol 2009; 65: 1101–1107. [DOI] [PubMed] [Google Scholar]
- 30. Hong DS, Angelo LS, Kurzrock R. Interleukin‐6 and its receptor in cancer: implications for translational therapeutics. Cancer 2007; 110: 1911–28. [DOI] [PubMed] [Google Scholar]
- 31. Roca H, Varsos ZS, Sud S, Craig MJ, Ying C, Pienta KJ. CCL2 and interleukin‐6 promote survival of human CD11b+ peripheral blood mononuclear cells and induce M2‐type macrophage polarization. J Biol Chem 2009; 284: 34342–54. [DOI] [PMC free article] [PubMed] [Google Scholar]
- 32. Qian B, Deng Y, Im JH et al. A distinct macrophage population mediates metastatic breast cancer cell extravasation, establishment and growth. PLoS ONE 2009; 4: e6562. [DOI] [PMC free article] [PubMed] [Google Scholar]
- 33. Hernandez L, Smirnova T, Kedrin D et al. The EGF/CSF‐1 paracrine invasion loop can be triggered by heregulin beta1 and CXCL12. Cancer Res 2009; 69: 3221–7. [DOI] [PMC free article] [PubMed] [Google Scholar]
- 34. Robinson BD, Sica GL, Liu YF et al. Tumor microenvironment of metastasis in human breast carcinoma: a potential prognostic marker linked to hematogenous dissemination. Clin Cancer Res 2009; 15: 2433–41. [DOI] [PMC free article] [PubMed] [Google Scholar]
- 35. Sica A, Bronte V. Altered macrophage differentiation and immune dysfunction in tumor development. J Clin Invest 2007; 117: 1155–66. [DOI] [PMC free article] [PubMed] [Google Scholar]
- 36. Yu H, Kortylewski M, Pardoll D. Crosstalk between cancer and immune cells: role of STAT3 in the tumour microenvironment. Nat Rev Immunol 2007; 7: 41–51. [DOI] [PubMed] [Google Scholar]
- 37. Chen SH, Murphy DA, Lassoued W, Thurston G, Feldman MD, Lee WM. Activated STAT3 is a mediator and biomarker of VEGF endothelial activation. Cancer Biol Ther 2008; 7: 1994–2003. [DOI] [PMC free article] [PubMed] [Google Scholar]
- 38. Murray PJ. The JAK‐STAT signaling pathway: input and output integration. J Immunol 2007; 178: 2623–9. [DOI] [PubMed] [Google Scholar]
- 39. Costantino L, Barlocco D. STAT 3 as a target for cancer drug discovery. Curr Med Chem 2008; 15: 834–43. [DOI] [PubMed] [Google Scholar]
- 40. Hussain SF, Kong LY, Jordan J et al. A novel small molecule inhibitor of signal transducers and activators of transcription 3 reverses immune tolerance in malignant glioma patients. Cancer Res 2007; 67: 9630–6. [DOI] [PubMed] [Google Scholar]