

Abstract
We report isolation of a novel tumor‐reversing gene, tentatively named SVS‐1, encoding a protein of 820 amino acids with localization on the plasma membrane as a type I transmembrane protein. The gene was found among those downregulated in the activated oncogene‐v‐K‐ras‐transformed NIH3T3 cells, Ki3T3, with tumorigenic phenotype. SVS‐1 protein harbors several functional domains inherent to adhesion molecules. Histochemical staining of mouse tissues using antibody raised against the protein showed the expression of the protein in restricted regions and cells, for example, strongly positive in apical membranes of epithelial cells in renal tubules and bronchial tubes. The protein inducibly expressed in human fibrosarcoma HT1080 cells and cervical carcinoma HeLa cells was found to be localized primarily on the plasma membrane, as stained with antibodies against FLAG tag in the N‐terminus and against the C‐terminal peptide of the protein. Expression of the protein in cells induced a variety of biological effects on cancer cells: detachment from the substratum and aggregation of cells and growth inhibition in HeLa cells, but no inhibition in non‐tumorigenic mouse NIH3T3 cells. Inhibition of clonogenicity, anchorage‐independent growth, migration and invasion through Matrigel was also observed. Taken together these results suggest that the SVS‐1 gene is a possible tumor‐reversing gene. (Cancer Sci 2007; 98: 900–908)
Abbreviations
- BSA
bovine serum albumin
- CCP
complement control protein
- ConA
concanavalin A
- DAB
3,3′‐diaminobenzidine
- DMEM
Dulbecco's Modified Eagle Medium
- DMSO
dimethyl sulfoxide
- ER
endoplasmic reticulum
- FITC
fluorescein isothiocyanate
- GAPDH
glyceraldehyde‐3‐phosphate dehydrogenase
- HRP
horseradish peroxidase
- LacZ
β‐galactosidase
- Luc
luciferase
- MMP
matrix metalloproteases
- MTT
3‐(4,5‐dimethylthiazol‐2‐yl)‐2,5‐diphenyltetrazolium bromide
- NSLC
non‐small‐cell lung cancer
- pAb
polyclonal rabbit antibodies
- PBS
phosphate‐buffered saline
- PCR
polymerase chain reaction
- PNGase
N‐glycanase F
- RT‐PCR
reverse transcription–polymerase chain reaction
- SCR
short consensus repeats
- SDS‐PAGE
sodium dodecyl sulfate‐polyacrylamide gel electrophoresis
- SUSD2
sushi domain containing 2
- TMR
tetramethylrhodamine
- TRITC
tetramethylrhodamine isothiocyanate
- TSTA
two‐step‐transcription amplification
- WGA
wheat germ agglutinin.
Loss of tumor suppressor gene function was frequently observed in several cancer tissues, cell lines established therefrom,( 1 ) and transformed cells with oncogenes such as src and ras. ( 2 , 3 )
Multiple cell adhesion molecules such as cadherins,( 4 ) tetraspanins like KAI1,( 5 ) TSLC1,( 6 ) have been identified to participate in intercellular and cell–extracellular matrix interactions in epithelial cells, which is essential in all aspects of growth migration and differentiation of cells in vertebrates.( 7 )
Cancer progression is a multistep process in which some adhesion molecules play a pivotal role in the development of recurrent, invasive, and distant metastasis. KAI1 (CD82) belongs to the transmembrane 4 superfamily in which members possess inhibitory effects on tumor cell motility, adhesion, and metastasis.( 8 ) TSLC1/IGF4 is a single membrane‐spanning glycoprotein belonging to the family of immunoglobulin superfamily cell adhesion molecules,( 9 ) and its expression is reported to be abrogated or markedly reduced in a number of diverse human cancers, including lung, prostate, pancreatic, gastric, and breast cancers.( 6 , 10 , 11 , 12 , 13 ) Re‐expression of TSLC1 in NSLC cells or in prostate cancer cells suppressed tumorigenicity in nude mice.( 6 ) Recently, TSLL2/IGF4C, an immunoglobulin superfamily molecule homologous to TSLC1/IGF4, was reported to be lost in prostate cancer and in a prostate cancer cell line, PPC‐1. Introduction of TSLL2 into PPC‐1 strongly suppressed subcutaneous tumor formation in nude mice but growth in in vitro culture was not affected.( 14 ) The drs gene was isolated as a tumor suppressor gene against transformation by v‐src.( 3 , 15 ) The drs protein has one transmembrane domain and three consensus repeats, sushi motif, conserved in extracellular domains in a number of adhesion‐related and plasma proteins. It was further reported that introduction of drs cDNA by retroviral vector into cancer cell lines suppressed anchorage‐independent growth without disturbing cell proliferation in liquid medium.( 16 ) Recently, it was reported that drs induced apoptosis where caspases 3 and 12 are activated without releasing cytochrome c from mitochondria.( 17 )
Overexpression of tumor suppressor genes in cancer cells frequently leads to apoptosis and inhibition of tumor growth.( 17 , 18 , 19 , 20 ) To elucidate the biological role and molecular mechanism of action of SVS‐1 in tumor cells, SVS‐1 was overexpressed by a recombinant adenoviral vector‐mediated gene transfer in human fibrosarcoma cells, HT1080, and uterine cervix cancer cells, HeLa, using the TSTA system developed by Wu et al.( 21 ) We found that SVS‐1 protein expressed in cells is located on plasma membrane and that the protein was specifically processed and N‐glycosylated. The overexpression of SVS‐1 protein induced detachment of cells from substratum in both HT1080 and HeLa cells. Overexpression of SVS‐1 protein in tumor cells reduced or abrogated some of the tumorigenic phenotypes including anchorage‐independent growth, migratory and invasive activity of the cells.
Materials and Methods
Cell culture. Mouse fibroblast line, NIH3T3, Ki‐3T3, NIH3T3 transformed by activated oncogene v‐K‐ras with tumorigenic phenotype, human embryonic kidney 293, human fibrosarcoma HT1080 and human uterine cervix carcinoma HeLa cells were cultured in DMEM (Nissui, Tokyo, Japan) containing 250 µg/mL kanamycin (Meiji, Tokyo, Japan), 4 mM L‐glutamine (Sigma, St Louis, MI, USA), 0.225% sodium bicarbonate (Sigma), 0.36% D‐glucose (Sigma), and 10% fetal bovine serum (Japan Bio Serum, Osaka, Japan) at 37°C in humidified 5% CO2. B16 cells, melanoma cells transplanted in C57BL/6 mice and 3LL cells, Lewis Lung cancer cells transplanted in C57BL/6 mice, were kindly provided by Dr Yasuyuki Onishi of Central Institute of Experimental Animals, Kawasaki, Japan.
Construction of vectors. The mammalian expression vector for SVS‐1 with N‐terminal FLAG tag inserted between signal peptide and somatomedin B domain and C‐terminal V5 tag (pcDNA3‐FSVSV5his) was created by cloning a PCR‐amplified fragment from the isolated mouse clone susd2 (Genebank: AK004703) into an expression vector pcDNA3.1‐V5‐His (Invitrogen, Carlsbad, CA, USA). pBXG1 + VP1 bearing Gal4/VP16 gene and pG5E4T‐luc (pG5‐luc) bearing five Gal4 binding sites were kindly provided by Dr Makoto Sato (UCLA, David Geffen School of Medicine, USA).( 22 ) Luciferase in pG5‐luc was replaced by FLAG‐ and V5‐His‐tagged SVS‐1 from pcDNA3‐FSVSV5his (pG5‐FSVS1). Gene fragment containing CMV promoter/G4VP2 from pBXG1 + VP1 was inserted into pShuttle vector (pShuttle‐G4VP2).
Recombinant adenoviruses. pShuttle‐G4VP2 was transformed into competent Escherichia coli BJ5183 cells (Stratagene, La Jolla, CA, USA) harboring the adenoviral backbone plasmid pAdEasy‐1. Thus, a recombinant adenovirus Ad/G4VP2 containing CMV‐G4VP2 was generated by homologous recombination in E. coli BJ5183‐AD 1 cells. Ad/G4VP2 was then packaged and amplified in human embryonic kidney 293 cells. The plaque‐forming unit was determined by median tissue culture infective dose (TCID50) assay.( 23 )
Establishment of SVS‐1 inducible cell lines. NIH3T3, HT1080 and HeLa cells were plated on 12‐well plates at 4 × 10⁵/well with antibiotics‐free DMEM 1 day prior to transfection. pG5‐luc or pG5‐F‐SVS‐1 was transfected into the cells using Lipofectamine 2000 (Invitrogen), according to the manufacturer's protocol. The cells were transferred to an 100‐mm dish, and incubated in growth medium containing 800 µg/mL G418 (Sigma) for 1 week. Several clones were obtained from each of the transfected cells and inducible expression of luciferase or F‐SVS‐1 was confirmed by adenoviral transduction of G4VP2
RT‐PCR. SVS‐1 mRNA level was determined by semiquantitative RT‐PCR. Total RNA was extracted with Trizol reagent (Gibco BRL, Gaithersburg, MD, USA) according to the manufacturer's instruction. Reverse transcription was carried out using total RNA (1 µg) from normal mouse tissues. The reverse transcription products were amplified. Primers used for SVS‐1 mRNA amplification were (F) 5′‐GTGATAGAGGTGCGGTTAGC‐3′ and (R) 5′‐GTTTGAAGTTGGGGTTGTGC‐3′. PCR conditions were as follows: 94°C for 5 min, followed by 27 cycles at 94°C for 30 s, 60°C for 1 min, and 74°C for 2 min, with a final extension at 74°C for 7 min. Electrophoresis of the RT‐PCR products was performed on 2% agarose gel with a size marker under standard conditions. Transcript encoding GAPDH were simultaneously detected in all samples and served as internal controls using the primers (F) 5′‐GCAAATTCAACGGCACAGTC‐3′ and (R) 5′‐GCCTGCTTCACCACCTTCTT‐3′.
Rabbit polyclonal antibodies. Rabbit polyclonal antibodies for SVS‐1 were obtained by immunizing New Zealand White rabbits with Nus‐tag fused recombinant mouse SVS‐1 protein expressed in E. coli (BL21[DE3]) by pET vector system (Novagen, Darmstadt, Germany). The antigens were designed in N‐terminal and C‐terminal regions on the sequence of SVS‐1 protein and named N1 and C1, respectively, N1 consisted of 203 amino acids from 27th to 229th amino acid following the signal peptide and C1 231 amino acids starting from 545th to 775th amino acid, including a part of von Willebrand factor type D and sushi domains, excluding the transmembrane region. Immunization was performed as described by Ooumi et al.( 24 ) The antibody was affinity‐purified from immune serum by an antigen‐immobilized column.
Western blotting. Cells and tissues were harvested and lyzed with RIPA buffer (10 mM Tris‐HCl, pH 7.4, 150 mM NaCl, 5 mM EDTA, pH 7.4, 1% Triton X‐100 and 0.1% SDS). Western blotting was performed essentially as described previously,( 25 ) using anti‐C1, anti‐N1, anti‐FLAG or anti‐V5 anti‐bodies followed by incubation with HRP‐conjugated anti‐mouse or anti‐rabbit secondary antibodies (Amersham Bioscience, Piscataway, NJ, USA).
Immunoprecipitation. Immunoprecipitation was performed according to the procedure recommended by the manufacturer using protein A/G plus agarose (Santa Cruz Biotechnology, Santa Cruz, CA, USA). 100‐mm dishes of approximately 90% confluent HeLa cells were transfected with the expression vector using Lipofectamine 2000 (Invitrogen). At 24 h after transfection, cells were lyzed with RIPA buffer containing protease inhibitor cocktail (Sigma). 500 µg of each lysate was used for the immunoprecipitation. To check the release of the antigen in the culture medium, medium was harvested at 48 h after transfection of HeLa cells plated at 1 × 10⁶ in 100 mm dish with the expression vector, and cleared by centrifugation at 800 g at 4°C for 10 min. The supernatant was immunoprecipitated.
Immunohistochemistry. The immunoperoxidase method was applied to 10% neutral buffered formalin‐fixed, paraffin‐embedded sections. The sections were incubated with 0.03% H2O2 in methanol to inhibit the endogenous peroxidase activity and preincubation with the 10% normal goat serum (Nichirei, Tokyo, Japan) to block any non‐specific reaction. Then the sections were incubated with an affinity purified polyclonal antibody against C1 fragment of SVS‐1 at a dilution 1:100 of original serum at 4°C overnight, followed by incubation with HRP‐labeled polymer conjugated goat anti‐rabbit antibody (Histofine Simplestain Max‐PO; Nichirei, Tokyo, Japan) at room temperature for 30 min. Immunoreaction products were visualized by incubation in a 0.05 M Tris‐HCl buffer (pH 7.6) containing 0.02% DAB and 0.006% H2O2. Immunostained sections were counterstained with hematoxylin for visualization of nuclei.
Immunofluorescence staining. The NIH3T3 cell line was transfected with SVS‐1 expression plasmid vector, pcDNA3 FSVS‐1. At 48 h after transfection, the cells were washed with PBS and fixed with 4% paraformaldehyde/PBS for 20 min at room temperature. Then, after washing with PBS, 0.2% Triton X‐100/PBS was added and the cells were stored at room temperature for 15 min. The cells were washed with PBS, anti‐FLAG antibody was added and the cells were stored at 4°C overnight. After washing with 1% Triton X‐100/PBS, TRITC‐ or FITC‐labeled anti‐mouse IgG and 2 µg/mL of Hoechst 33258 were added to the cells, and the mixture was stored at 4°C for 1 h. The cells were washed with 1% Triton X‐100/PBS, and observed under a fluorescence microscope (Olympus BX50; Sibuya, Tokyo, Japan) and under a laser confocal microscope (LSM 5 PASCAL; Carl Zeiss, Gottingen, Germany). The organelle in the cell was costained with anti‐Flag antibody for SVS‐1 and WGA‐TMR (Molecular Probes, Eugene, OR, USA), Con A‐TMR (Molecular Probes), Mito tracker Orange CMTM Ros (Molecular Probes), or Phalloidin Oregon green488 (Molecular Probes) for Golgi aparatus, ER, mitochondria and actin fibers, respectively, using the procedure recommended by the manufacturer. To stain cells inducibly expressing SVS‐1 protein by adnovirus transduction, cells were plated on cover glass at 7 × 10⁴/well in 12‐well plate, 24 h prior to infection. Cells were infected with Ad‐G4VP2. At 48 h after infection, the cells were washed and fixed. Immunofluorescence staining was performed as described above.
N‐glycosylation analysis. HeLa cells were transfected with SVS‐1 expression plasmid vector, pcDNA3 FSVS‐1. After 4 h cells were incubated with 1 µg/mL of tunicamycin inhibiting N‐linked glycosylation for 24 h. Lysates were prepared therefrom and western blotting analysis performed as described above. For enzymatic digestion of N‐linked oligosaccharides on proteins, 20 µg extract protein of SVS‐1‐overexpressed cells was denatured and treated with 0.07–500.00 unit of PNGase F (New England Biolabs, Fort Collins, CO, USA) at 37°C for 10–20 min according to the manufacture's instruction, followed by western blotting analysis.( 26 )
Colony formation assay. Ki3T3 cells were plated at 3 × 10⁴/well in 96‐well plate 24 h prior to transfection. Ki3T3 cells were cotransfected with pTK‐hyg (Takara Bio, Shiga, Japan) and expression plasmids of pcDNA3.1V5His, pcDNA3.1‐LacZ, pcDNA3.1‐FSVSV5His, or pcDNA3.1‐mDRS. After transfection, cells were plated in a 60‐mm culture dish in medium containing hygromycin at 0.1 mg/mL and cultured for 3 weeks. The number of colonies in each dish was counted after fixation and methylene blue staining.
MTT assay. HeLa/G5‐Luc, HeLa/G5‐FSVS‐1, NIH/G5‐Luc and NIH/G5‐FSVS‐1 cells were plated on 96‐well plates at 500 cells per well 24 h prior to infection. The cells were infected with Ad/G4VP2 at various moi or mock‐infected. On days indicated after infection cells were incubated with 0.5 mg/mL of MTT (Sigma) for 4 h at 37°C. After removal of the solution, the purple precipitates were dissolved in DMSO and the absorbance was measured at 570 nm using multiwell plate reader (Bio‐Rad Model 550, Bio‐Rad, Hercules, CA, USA).
Anchorage independent growth. PolyHEMA (purchased from Aldrich Chemical Co., Milwaukee, WI, USA) was solubilized in 95% ethanol at 120 mg/mL and diluted 10 times in ethanol. To prepare polyHEMA‐coated dishes, 1.5 mL of the polyHEMA solution was placed onto 60‐mm Petri dishes and dried in a tissue culture hood. Methylcellulose was dissolved at 15 mg/mL in DMEM at 4°C. Methylcellulose solution was centrifuged at 9000 g for 30 min. One mL cell suspension (1 × 10⁴ cells/mL) was added to 4 mL methylcellulose solution. Cell suspensions were seeded in polyHEMA‐coated 60 mm dishes.
Cell adhesion assays. 96‐well flat‐bottom microtiter ELISA plates (Iwaki; Asahi Techno Glass, Chiba, Japan) were coated with 10 µg/mL each of fibronectin (Sigma), laminin (Sigma), or type I collagen (Nitta gelatin, Osaka, Japan). Additional wells were coated with 1% BSA in PBS. The plates were incubated for 1 h at 37°C; the coated surfaces were washed with PBS and then blocked with 1% BSA for 30 min at 37°C. HeLa cells detached with 20 mM EDTA were washed and resuspended in serum free DMEM, and plated on each protein‐coated well at 20 000 cells/100 µL/well. The plates were incubated for 2 h at 37°C in humidified 5% CO2. Non‐adherent cells were removed by centrifugation (top side down) at 48 g for 5 min. The attached cells were fixed with 1% formaldehyde and stained with 0.5% crystal violet overnight. The wells were washed with PBS. Number of cells per each microscopic field was counted. Averages of three dishes were calculated.
Migration and invasion assay. Migration activity assay was performed using Transwell plates (PET membrane, 8 µm pores, Becton Dickinson, NJ, USA). Suspension of 2.0 × 10⁵ cells was added to the top chamber and cells were allowed to migrate through the membrane at 37°C, 5% CO2 for 24 h. Cells passing through the membrane into the lower chamber were counted. For invasion assay Transwell plates were precoated on upper sides with Matrigel. Then, 2.0 × 10⁵ cells were added to the top chamber and assays performed at 37°C, 5% CO2. The membrane was fixed in methanol and stained with 0.5% crystal violet/30% methanol for 1 h. The upper side of the membrane was wiped off, and cells that attached to the lower side surface were counted. Invasion assay was performed by using the growth factor‐reduced BD Matrigel invasion chamber (PET membrane with 8 µm pores, Becton Dickinson), as described above.
Statistics. Data were analyzed and averages and standard deviations were calculated using statistics (paired t‐test) with GraphPad InStad v.3.01 (GraphPad Software, San Diego, CA, USA).
Results
In an attempt to find novel tumor suppressor genes, we performed cDNA microarray analysis for differential gene expression in mouse NIH3T3 cells with normal phenotype and Ki3T3 cells with tumorigenic phenotype, NIH3T3 cells transformed by an activated oncogene v‐K‐ras. A few hundred genes among the 16 000 genes were found to be up‐ or downregulated in Ki3T3 cells. A presumably plasma membrane‐localized uncharacterized gene tentatively named SVS‐1/SUSD2 was selected from those downregulated in the transformed cells on the basis that many tumor suppressor gene products are expressed on the plasma membrane and have a possible role in cell adhesion, migration and metastasis as tumor suppressors. However, the biological function of SVS‐1 has not been reported. The SVS‐1 protein is presumed to be a transmembrane protein of 820 amino acids, consisting of three major domains, an extracellular, a transmembrane and a cytoplasmic domain. The extracellular domain contains somatomedin B, AMOP, von Willebrand factor type D, and sushi/CCP/SCR domains (Fig. 1a), which are frequently found in cell adhesion molecules playing important roles in cell‐to‐cell and/or cell‐to‐matrix adhesion.( 27 , 28 , 29 )
Figure 1.
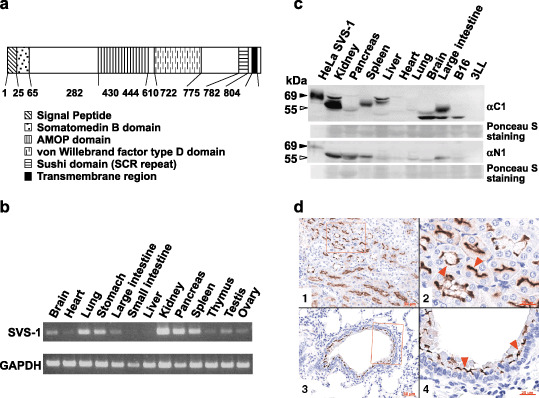
Expression of SVS‐1 in several mouse tissues. (a) Diagram of SVS‐1 protein. SVS‐1 possesses various domains which are frequently found in adhesion molecules. FLAG‐tag was inserted between signal peptide and somatomedin B domain, and V5‐tag added to the carboxyl‐terminus of the protein. (b) Semiquantitative RT‐PCR using total RNA (1 µg) from normal mouse tissues. (c) Western blotting analysis with protein extracts of normal mouse tissues, loading 100 µg in each lane, and detected with C1 and N1 antibodies. (▹) Positions of presumably processed proteins detected in various tissues, which may correspond to (▸) processed protein of Flag‐ and V5‐tagged SVS‐1 ectopically expressed in HeLa cells (lane 1). (d) Expression of SVS‐1 in kidney and lung, as examined by immunohistochemistry. Tissue sections were analyzed using anti‐C1 antibody. d1, kidney tissue section; d2, large magnification of a part of d1; d3, lung tissue section; d4, large magnification of a part of d3. (red ▸) Immuno‐positive apical membranes of epithelial cells. GAPDH, glyceraldehyde‐3‐phosphate dehydrogenase.
SVS‐1 expression in several mouse tissues. We examined the expression of SVS‐1 in normal mouse tissues by RT‐PCR. Mouse SVS‐1 mRNA was found to be expressed in several specific tissues: at high levels in kidney, pancreas, lung, stomach, and spleen, at moderate levels in thymus, testis, ovary, brain, and large intestine, and almost no level of expression in heart, liver and small intestine (Fig. 1b).
Western blotting and histochemical staining with polyclonal rabbit antibodies against SVS‐1 were then performed. We generated pAb against N‐terminal (N1, 203 residues from amino acid no. 27‐223) and C‐terminal (C1, 231 residues from amino acid no. 545‐775) peptides of the protein and examined the expression of SVS‐1 protein in mouse tissues using western blotting analysis. As shown in Fig. 1c, presumably processed proteins with various molecular mass were detected in various tissues, the variation in molecular mass among tissues being most likely ascribed to differences in glycosylation status (T. Sugahara et al., unpublished data, 2007). Strong expression of the protein was detected in kidney, with both C1 and N1 antibodies, and there was moderate expression in other tissues, such as spleen, liver, large intestine, and undetectable levels of expression in pancreas, heart and lung. A second band with lower molecular mass observed in brain and large intestine, was detected in mouse melanoma cell line B16 but not in lung cancer cell line Lewis Lung 3LL (Fig. 1c). Several mouse tissues were examined using immunohistochemistry for SVS‐1 expression. Expression was restricted in specific regions of the tissues: distinct polarity was observed in the distribution of the antigen being restricted on the apical membranes of the epithelial cells in renal tubules and bronchial tubes, but not in alveolar epithelium (Fig. 1d).
Subcellular localization of SVS‐1. NIH3T3, transiently transfected with pcDNA‐Fsvs‐1V5his, was costained with anti‐FLAG antibody and probes that specifically stain subcellular organella, such as ConA‐TMR, WGA‐TMR, Mito‐tracker‐Orange CMTM Ros and Phalloidin‐FITC staining ER, Golgi apparatus, mitochondria and actin fibers, respectively (Fig. 2a). Thus SVS‐1 protein was found to be localized mainly in ER, but not in mitochondria or Golgi apparatus. NIH3T3 cells are rich in actin stress fibers and the fibers notably disappeared from SVS‐1 expressed cells. The disruption of stress fibers appeared to depend on the levels of SVS‐1 expression, indicating strong (†) and weak (§) expression (Fig. 2b). To examine further whether the antigen SVS‐1 is localized in the outer surface of the plasma membrane, fixed cells were treated with or without Triton X‐100, and stained with anti‐FLAG antibody. As shown in Fig. 2c, plasma membrane of cells untreated with Triton X‐100 was stained, and treatment of the cells with Triton rendered ER stainable, indicating that the antigen SVS‐1 is localized in the outer surface of the plasma membrane accessible to the antibody. Furthermore, SVS‐1 seems to be concentrated in cell‐to‐cell contact region, as observed with laser confocal microscopy (Fig. 2c). Cells were not stained with V5 antibody without Triton X‐100 treatment, suggesting that the C‐terminus of the protein is localized in the inner surface of the plasma membrane (Fig. 2d).
Figure 2.
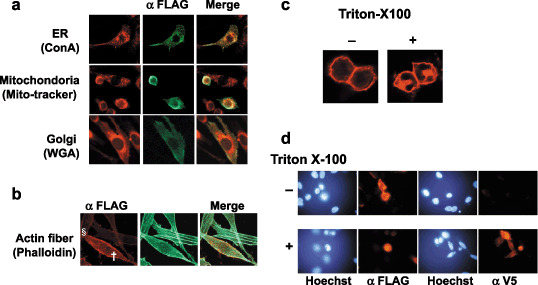
Subcellular localization of SVS‐1 protein expressed in NIH3T3 cells. At 48 h after transfection with pcDNA3‐FSVS‐1, cells were fixed and perneabilized by Triton X‐100 treatment. (a) Fixed cells were costained with anti‐Flag antibody followed by fluorescein isothiocyanate (FITC)‐labeled secondary antibody and probes specifically staining cellular organells, Con A staining endoplasmic reticulum (ER), wheat germ agglutinin (WGA) staining Golgi apparatus, mito‐tracker staining mitochondria. (b) Actin fibers were stained with FITC‐labeled phalloidin, strong (†) and weak (§) expression of SVS‐1 being shown. (c) Fixed cells were washed with phosphate‐buffered saline with or without 0.2% Triton X‐100, stained with anti‐FLAG antibody, and observed with laser confocal microscope. (d) Fixed cells permeabilized or not were stained with anti‐FLAG antibody or anti‐V5 antibody.
SVS‐1 is processed, glycosylated and released in the culture medium. FSVS‐1 cDNA was transfected into HeLa cells, and analyzed using western blotting. FSVS‐1 proteins were detected approximately at 110 kDa and 60 kDa using anti‐FLAG antibody and at 110 kDa, 60 kDa, and 55 kDa using V5 antibody (Fig. 3a), demonstrating that the protein was processed at specific regions around the middle of the protein. The C‐terminal fragment was coimmunoprecipitated with the N‐terminal fragment by anti‐FLAG antibody, and vice versa, the N‐terminal fragment was coimmunoprecipitated with the C‐terminal fragment by anti‐V5 antibody (Fig. 3b), indicating that the processed N‐terminal and C‐terminal peptides form a complex.
Figure 3.
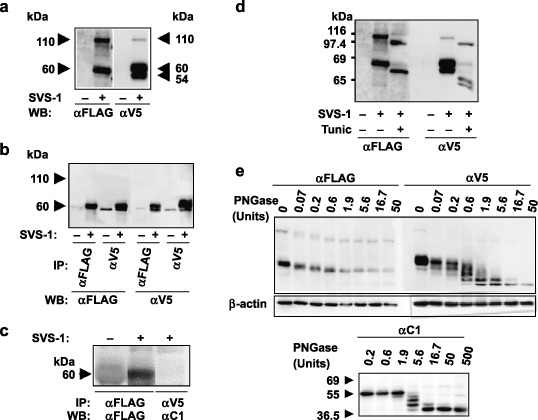
Processing, glycosylation and shedding of SVS‐1. (a) Western blotting using anti‐FLAG antibody and anti‐V5 antibody of HeLa cell extract prepared from cells transfected with FSVS‐1 gene, and harvested at 48 h after transfection. (b) Association of N‐terminus and C‐terminus of processed SVS‐1 protein. Lysate of the SVS‐1‐transfected HeLa cells was immunoprecipitated with anti‐FLAG or anti‐V5 antibody, and the precipitates analyzed using western blotting with either anti‐FLAG (left panel) or anti‐V5 (right panel) antibody. (c) Shedding of N‐terminus peptide. SVS‐1‐transfected HeLa cells were cultured for 48 h and culture medium was harvested and immunoprecipited with anti‐FLAG or anti‐V5 antibody. The precipitates were subjected to SDS‐PAGE and immunobloted with anti‐FLAG or anti‐C1 antibody. (d) Glycosylation of SVS‐1. SVS‐1‐transfected HeLa cells were incubated with or without 1 µg/mL of tunicamycin for 24 h, and subjected to western blotting analysis with anti‐FLAG or anti‐V5 antibody. (e) Glycosylation of SVS‐1. SVS‐1‐transfected HeLa cell lysate was treated with various dilutions of N‐glycanase F (PNGase) and subjected to western blotting analysis using anti‐FLAG (upper left panel) or anti‐V5 (upper right panel) antibody. Kidney lysate was similarly treated with PNGase followed by western blotting(lower panel).
To examine whether processed SVS‐1 is released in the culture medium, the protein in the culture medium was immunoprecipitated using anti‐FLAG antibody, or anti‐V5 antibody. The N‐terminal fragment was immunoprecipitated, but no C‐terminal fragment was immunoprecipitated (Fig. 3c), demonstrating that only the N‐terminal fragment is released in the culture medium.
Since SVS‐1 protein is a membrane protein, it was suggested by computer search that the protein harbors possible N‐glycosylation sites in its extracellular domain (NetNGLyc 1.0 server: http://www.cbs.dtu.dk/services/NetNGlyc/). Sequence analysis of SVS‐1 predicted that the protein bears eight NX(S/T) motifs as N‐linked glycosylation sites. We attempted deglycosylation of the SVS‐1 proteins by treatment with tunicamycin inhibiting N‐linked glycosylation, or treatment with PNGase to release putative N‐linked oligosaccharides (Fig. 3d,e). Thus the treatment of cells with tunicamycin gave rise to SVS‐1 proteins with lower Mr (Fig. 3d). SVS‐1 protein was enzymatically digested with PNGase in different dilutions. Western blotting analysis demonstrated that the C‐terminal peptide showed at least four different bands with different mobility, indicating that it is in fact glycosylated at least at four different sites, and that the 39 kDa band is assumed to be completely deglycosylated (Fig. 3e). The N‐terminal peptide appeared to give three bands with different sizes (Fig. 3e). Similar glycosylation was observed with SVS‐1 protein in kidney, as evidenced by PNGase treatment (Fig. 3e).
FSVS‐1 introduced by transfection inhibits cell proliferation in Ki3T3 To test whether SVS‐1 affects the growth of the cells, we performed colony‐formation assays in liquid medium. Ki3T3 mouse fibroblast cells were cotransfected with pcDNA‐LacZ, pcDNA‐Drs, pcDNA‐Fsvs‐1v5his or the vector pcDNA3.1 and pTK‐hyg. Transfected cells were allowed to grow in medium containing hygromycin; colonies formed were fixed, stained, and counted 3 weeks later. Overexpression of pcDNA‐Fsvs‐1v5his caused suppression of colony formation (Fig. 4a,b): 39.3% and 44.9% reduction in colony numbers, as compared with those transfected with pcDNA‐LacZ and pcDNA3.1 vector, respectively (Fig. 4b). Suppression of colony formation by Drs gene, one of the known tumor suppressor genes,( 15 ) was even more pronounced than Fsvs‐1. These results indicate that ectopic expression of SVS‐1 suppresses growth of Ki3T3 cells.
Figure 4.
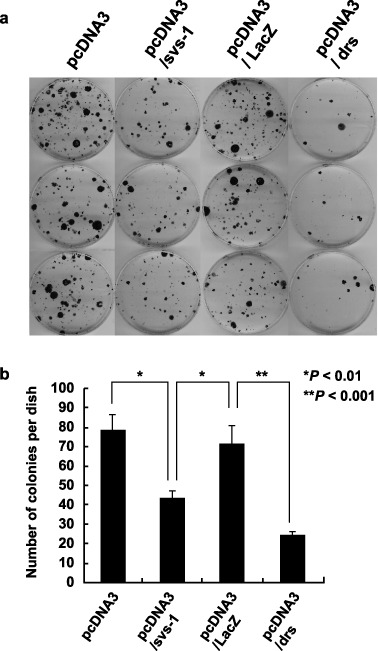
Growth inhibition of Ki3T3 cells by SVS‐1, as assayed by colony formation. (a) Ki3T3 cells were transfected with pcDNA‐Fsvs‐1v5his, pcDNA‐LacZ, pcDNA‐Drs or pcDNA3.1 and plated in medium containing G‐418. Colonies were fixed stained with methylene blue, and counted. The experiments were repeated three times using triplicate dishes. (b) Average numbers of colonies in each group are shown. P‐values are shown.
Construction of inducible overexpression system by TSTA. Since FSVS‐1 expression suppresses growth of tumor cells, as shown in Fig. 4, and since isolation of cell clones stably expressing SVS‐1 was not successful, an inducible expression system was constructed to analyze the effect of SVS‐1 in cells.
Thus induction of FSVS‐1 is achieved by infection of cells harboring the FSVS‐1 gene under the control of Gal4 response element with Ad/G4VP2 expressing a fusion transcription factor consisting of the Gal4 binding domain and the VP‐16 transactivation domain. 21 , 22
To test whether infection of recombinant adnovirus Ad/G4VP2 induces FSVS‐1 or luciferase expression in HeLa/G5‐FSVS‐1, HeLa/G5‐Luc, HT/G5‐FSVS‐1, HT/G5‐Luc, or NIH/G5‐FSVS‐1, western blot analysis was performed using anti‐FLAG or anti‐Luc antibodies. Result showed that the proteins were expressed in a moi‐dependent manner (Fig. 5a). By infection of HT/G5‐FSVS‐1 and HeLa/G5‐FSVS‐1 cells with Ad/G4VP2, detachment from substratum and aggregation of cells were induced (Fig. 5b,c). FSVS‐1 protein appears to be concentrated in the cell‐to‐cell attachment boundary, but control HT/G5‐Luc, and HeLa/G5‐Luc cells were not affected (Fig. 5b and data not shown).
Figure 5.
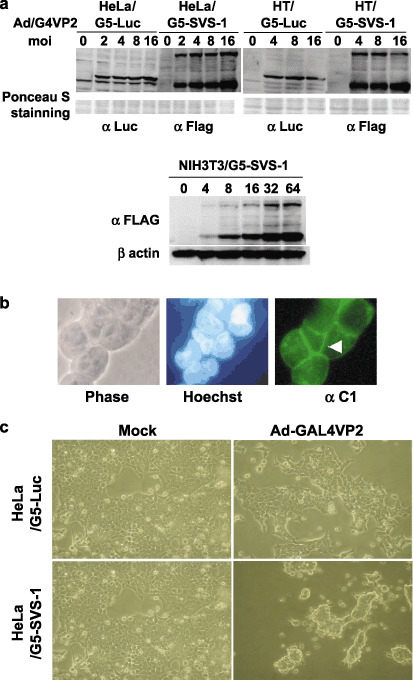
Expression of FSVS‐1 using two‐step‐transcription amplification (TSTA) system induced detachment of cells from substratum. (a) moi‐dependent expression of SVS‐1. At 48 h after Ad/G4VP2 infection at a moi of 2–16, HeLa/G5‐luciferase, HeLa/G5‐FSVS‐1, HT/G5‐luciferase, HT/G5‐FSVS‐1, and NIH/G5‐FSVS‐1 cells were harvested, lyzed and analyzed using western blotting with anti‐FLAG, anti‐luciferase or anti‐β‐actin antibody. As a loading control the membrane was stained with Ponceau S. (b,c) The HeLa/G5‐FSVS‐1 cells were infected with Ad/G4VP2 at 2 moi. 72 h postinfection, overexpression of SVS‐1 protein induced detachment of cells from the substratum and aggregation, immunofluorescence of SVS‐1 shown in (b) and phase‐contrast images in (c).
Suppression of anchorage‐dependent and ‐independent growth by FSVS‐1. We tested using MTT assay whether the overexpression of FSVS‐1 inhibits cell growth. Growth of HeLa/G5‐Fsvs‐1 cells infected with Ad/G4VP2 was significantly reduced in a moi‐dependent manner, in contrast to no effect on HeLa/G5‐Luc, NIH/G5‐Luc or NIH/G5‐Fsvs‐1 cells (Fig. 6a,b). Of note is the finding that growth of phenotypically normal NIH/G5‐SVS‐1 cells was not affected.
Figure 6.
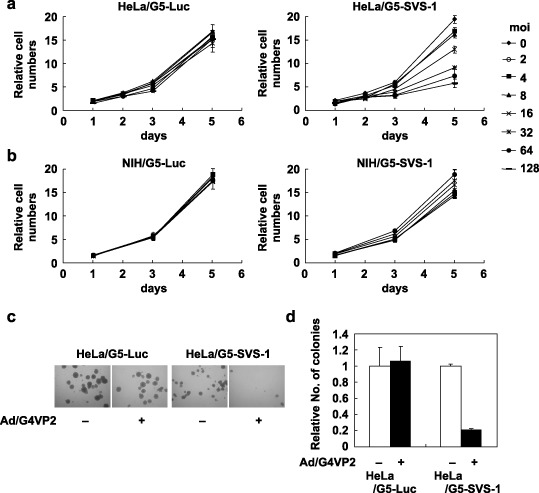
Overexpression of FSVS‐1 inhibits anchorage‐dependent and anchorage‐independent growth. (a,b) HeLa/G5‐luciferase, HeLa/G5‐FSVS‐1, NIH/G5‐luciferase and NIH/G5‐FSVS‐1 cells were infected with various moi of Ad/G4VP2 and growth of cells were followed by 3‐(4,5‐dimethylthiazol‐2‐yl)‐2,5‐diphenyltetrazolium bromide (MTT) assay at indicated days after infection. Relative cell numbers were expressed relative to the number of cells on day 0. (c) At 48 h after Ad/G4VP2 infection of HeLa/G5‐FSVS‐1 cells at 16 moi, 1 × 10⁴ cells were seeded per dish in methylcellulose medium on polyHEMA‐coated plates. After 12 days of incubation numbers of colonies were counted. (d) Average number of colonies from three dishes of mock and Ad/G4VP2‐infected cells was calculated.
HeLa/G5‐Luc and HeLa/G5‐Fsvs‐1 cells infected with Ad‐G4VP2 were assayed for colony formation in suspension in methylcellulose medium on polyHEMA‐coated dishes. The SVS‐1 significantly suppressed anchorage‐independent growth of HeLa cells. A reduction of approximately 80% in colony numbers was observed in HeLa/G5‐Fsvs‐1 upon infection with Ad‐G4VP2 compared with mock infection (Fig. 6c,d). In contrast HeLa/G5‐Luc was not suppressed. These results clearly show that the SVS‐1 gene suppressed anchorage‐independent growth, one of the prominent characteristics of tumor cells.
Inhibition by SVS‐1 expression of attachment of HeLa cells to fibronectin. As expression of SVS‐1 rendered HeLa cells to detach from the substratum, as shown in Fig. 5c, we tested the ability of SVS‐1‐expressed cells to adhere to some of the extracellular matrix proteins. As shown in Fig. 7a, attachment of cells to fibronectin was significantly decreased by 40%, compared with mock infection. In contrast, attachment of cells to type I collagen and laminin was not affected, nor was attachment of control HeLa/G5‐Luc cells to the three matrix proteins.
Figure 7.
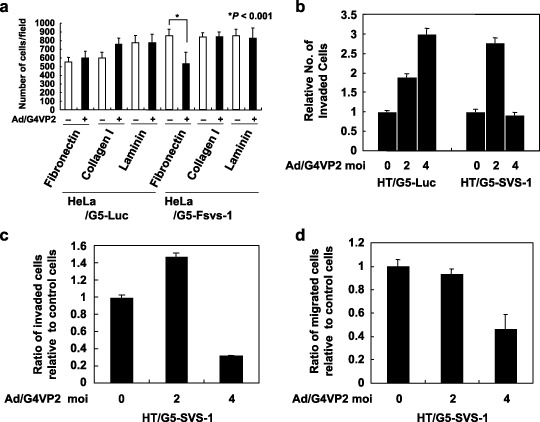
Inhibition by SVS‐1 of cell adhesion to fibronectin, migration and invasion. (a) Cell adhesion to extracellular matrix (ECM) proteins. 96‐well flat‐bottom microtiter ELISA plates were coated with fibronectin, laminin, or type I collagen. At 48 h after Ad/G4VP2 infection at 8 moi, 20 000 cells were seeded in protein‐coated wells. After incubation, the number of attached cells per each microscopic field was counted. (b) Invasion assay. At 48 h after infection of HT/G5‐luciferase and HT/G5‐FSVS‐1 cells with Ad/G4VP2 at a moi of 2 and 4, suspension of 6.25 × 10⁴ cells was added to the top chamber and cells were allowed to invade through Matrigel and the membrane for 24 h. Cells traversing through the membrane into the lower chamber were counted. Cell numbers were expressed relative to those of mock infected cells. (c) Ratio of invaded cells relative to control cells. Relative numbers of invaded SVS‐1‐expressed cells were normalized by those of HT/G5‐luciferase cells at each moi. (d) Ratio of migrated cells relative to control cells. At 48 h after infection of HT/G5‐luciferase and HT/G5‐FSVS‐1 cells with Ad/G4VP2, suspension of 3 × 10⁴ cells was added to top chamber and cells were allowed to migrate through the membrane for 24 h. Cells passing through the membrane into the lower chamber were counted in three microscopic fields. Cell numbers were expressed relative to those of mock infected cells. Relative numbers of migrated cells were normalized by those of HT/G5‐luciferase cells at each moi.
F‐SVS‐1 suppresses migration and invasion of HT1080. To assess the biological function of SVS‐1 in cell motility and invasive activity, we performed migration and invasion assay using Transwell chamber with or without Matrigel. In the invasion assay, the numbers of cells traversing through Matrigel and membrane into the lower chamber significantly increased upon infection of HT/G5‐Luc cells with Ad/G4VP2 (2 moi and 4 moi). The numbers of traversing HT/G5‐SVS‐1 cells increased upon infection with 2 moi as control cells, but significantly decreased upon infection with 4 moi of the virus (Fig. 7b). Thus the ratios of the numbers of SVS‐1‐expressed invaded cells relative to those of control cells were calculated and depicted in Fig. 7c, showing that expression of SVS‐1 in HeLa cells inhibited invasion of cells at 4 moi.
In migration assay using Transwell chamber without Matrigel, almost similar results were obtained. Thus a similar trend of the ratios of migrated SVS‐1‐expressed cells relative to those of control cells was observed (Fig. 7d). These results demonstrate that SVS‐1 suppresses not only migration but also invasion of tumor cells.
Discussion
In the present study, we report isolation of a novel gene, SVS‐1/SUSD2, suppressing tumorigenic phenotypes of cancer cells. The protein is localized on plasma membrane, N‐glycosylated and shed. Ectodomain shedding is a major process regulating various biological events such as cell differentiation, proliferation, migration, and survival. Various proteins such as growth factors, growth factor receptors, or cell adhesion molecules are substrates for sheddases.( 30 , 31 ) Of great interest is our finding that the N‐terminal portion of processed SVS‐1 protein was released into the culture medium. Among the Zn2+‐dependent protease superfamily, MMP and ADAM proteins, both members of the metzincin subgroup, are largely implicated in the degradation and remodeling of the extracellular matrix. MMP mediate shedding of transmembrane and membrane‐associated proteins, including E‐cadherin.( 32 ) For example, exogenous matrilysin and stromelysin‐1 (MMP‐3) can release an 80‐kDa E‐cadherin fragment from various cancer cell lines.( 33 , 34 ) Proteolytic cleavage of E‐cadherin ectodomains and shedding into the blood stream has been shown in various cancers such as bladder, prostate, lung and gastric cancers,( 35 ) thus soluble E‐cadherin has been suggested to be a prognostic marker in various cancers. The biological function of ectodomain shedding of SVS‐1 needs to be clarified.
SVS‐1 induced disruption of actin stress fibers (Fig. 2b), detachment of cells from substratum (Fig. 5c), most likely due to interference with the interaction of integrins with extracellular adhesion molecules such as fibronectin (Fig. 7a). We showed that, since expression of SVS‐1 did not affect cell cycle distribution of cells in G1‐, S‐ and G2/M‐phases (data not shown), suppression of cell growth by SVS‐1 is most likely due to a mechanism unrelated to arrest of the cell cycle progression, for example, regulation of cell growth by cell‐to‐cell or cell‐to‐substrate interaction, in turn perturbing signal transduction leading to cell growth. Analysis by laser confocal microscopy revealed SVS‐1 localization on plasma membranes (Fig. 2c) and accumulation in the cell‐to‐cell contact region (2, 5), accounting in part for cell cycle‐independent growth inhibition. A similar pattern of accumulation and biological activity of membrane proteins at the cell‐to‐cell contact sites has also been reported with other adhesion molecules including E‐cadherin, TSLC‐1 and nectins.( 9 , 36 , 37 , 38 ) Furthermore, we showed that overexpression of SVS‐1 in HeLa cells induced cell aggregation, and suppressed migration and invasion of cells. Similar compaction of cells was observed by the expression of E‐cadherin,( 39 ) thereby acting as an invasion suppressor of various epithelial malignancies.( 40 , 41 , 42 ) Of relevance is the finding that similar complete disruption of the actin stress fiber network and disappearance of focal adhesions were observed by hSNF5/INI1 tumor suppressor gene, a component of the ATP‐dependent chromatin remodeling hSWI‐SNF complex.( 43 )
Although the function of SVS‐1 appears to be similar to that of various tumor suppressors, SVS‐1 cannot be defined as a tumor suppressor, unless genetic and epigenetic alterations as well as abnormal expression of SVS‐1 in tumors are examined.
According to the database, the human SVS‐1/SUSD2 gene is located near chromosome 22q11.23. Recent findings that follow show some evidence relevant to the genetics of genes near 22q11.23. Rhabdoid tumors of kidney are highly malignant neoplasms that occur primarily within the first 3 years of life, normally occurring by deletion of a small region of chromosome 22q11.2,( 44 ) but occasionally occurring by atypical deletions spanning 2.8 Mb and extending to 22q12.( 45 ) Frequent chromosomal loss such as 22q has been reported in as much as 30% of astrocytomas and 50% of glioblastomas.( 46 ) Several tumor suppressor genes have been investigated on chromosome 22. Putative tumor suppressor genes have been identified on chromosome 22q, such as hSNF5/INII, involved in pediatric malignant rhabdoid tumor on 22q11.2, hCHK2 on 22q12.1, a tumor suppressor gene encoding checkpoint kinase 2 involved in cell cycle control. These have been reported in Li‐Fraumeni families without p53 mutations. There is a possibility that a new tumor suppressor gene is found from the proximal region of 22q11.23‐12, as suggested by Hartmann et al.( 47 ) Genetic and epigenetic alteration of the SVS‐1 gene has to be investigated further.
In summary, newly characterized SVS‐1/SUSD2 was demonstrated to be a novel protein suppressing tumorigenic phenotypes, as inhibition of anchorage‐dependent and anchorage‐independent growth, motility and invasiveness of cancer cells in culture. Of most importance is the activity of SVS‐1 in suppressing tumor growth in vivo, which is now in progress.
Furthermore, elucidation of the molecular mechanism underlying the physiological function of SVS‐1 may provide an appropriate molecular target for future cancer therapy.
Acknowledgments
We are grateful to Drs Makoto Sato and Lilly Wu of Department Urology, School of Medicine, University of California at Los Angeles for their kind gift of vectors used in TSTA system. We also thank Drs Masamichi Ikeguchi, Shoko Nishihara and Keishin Hayashida of Faculty of Engineering, Soka University for advice in manipulation of pET vectors, laser confocal microscope and immunization of rabbits, respectively.
References
- 1. Xinliang M, Eric S, Ray T et al. Re‐expression of TSLC1 in a non‐small‐cell lung cancer cell line induces apoptosis and inhibits tumor growth. Oncogene 2004; 23: 5632–42. [DOI] [PubMed] [Google Scholar]
- 2. Kolfschoten IG, Van Leeuwen B, Berns K et al. A genetic screen identifies PITX1 as a suppressor of RAS activity and tumorigenicity. Cell 2005; 121: 849–58. [DOI] [PubMed] [Google Scholar]
- 3. Pan J, Nakanishi K, Yutsudo M et al. Isolation of a novel gene down‐regulated by v‐src. FEBS Lett 1996; 383: 21–5. [DOI] [PubMed] [Google Scholar]
- 4. Pecina‐Slaus N. Tumor suppressor gene E‐cadherin and its role in normal and malignant cells. Cancer Cell Int 2003; 3: 17. [DOI] [PMC free article] [PubMed] [Google Scholar]
- 5. Dong JT, Rinker‐Schaeffer CW, Ichikawa T et al. Prostate cancer – biology of metastasis and its clinical implications. World J Urol 1996; 14: 182–9. [DOI] [PubMed] [Google Scholar]
- 6. Kuramochi M, Fukuhara H, Nobukuni T et al. TSLC1 is a tumor‐suppressor gene in human non‐small‐cell lung cancer. Nat Genet 2001; 27: 427–30. [DOI] [PubMed] [Google Scholar]
- 7. Cohen MB, Grieblin TL, Ahaghotu CA et al. Cellular adhesion molecules in urologic malignancies. Am J Clin Path 1997; 107: 56–63. [DOI] [PubMed] [Google Scholar]
- 8. Takaoka A, Hinoda Y, Satoh S et al. Suppression of invasive properties of colon cancer cells by a metastasis suppressor KAI1 gene. Oncogene 1998; 16: 1443–53. [DOI] [PubMed] [Google Scholar]
- 9. Masuda M, Yageta M, Fukuhara H et al. The tumor suppressor protein TSLC1 is involved in cell‐cell adhesion. J Biol Chem 2002; 277: 31014–19. [DOI] [PubMed] [Google Scholar]
- 10. Fukuhara H, Kuramochi M, Fukami T et al. Promoter methylation of TSLC1 and tumor suppression by its gene product in human prostate cancer. Jpn J Cancer Res 2002; 93: 605–9. [DOI] [PMC free article] [PubMed] [Google Scholar]
- 11. Allinen M, Peri L, Kujala S et al. Analysis of 11q21‐24 loss of heterozygosity candidate target genes in breast cancer: indications of TSLC1 promoter hypermethylation. Genes Chromosomes Cancer 2002; 34: 384–9. [DOI] [PubMed] [Google Scholar]
- 12. Jansen M, Fukushima N, Rosty C et al. Aberrant methylation of the 5′‐CpG island of TSLC1 is common in pancreatic ductal adenocarcinoma and is first manifest in high‐grade PanlNs. Cancer Biol Ther 2002; 1: 293–6. [DOI] [PubMed] [Google Scholar]
- 13. Honda T, Tamura G, Waki T et al. Hypermethylation of the TSLC1 gene promoter in primary gastric cancers and gastric cancer cell lines. Jpn J Cancer Res 2002; 93: 857–60. [DOI] [PMC free article] [PubMed] [Google Scholar]
- 14. Williams YN, Masuda M, Sakurai‐Yageta M et al. Cell adhesion and prostate tumor‐suppressor activity of TSLL2/IGSF4C, an immunoglobulin superfamily molecule homologous to TSLC1/IGSF4. Oncogene 2006; 25: 1446–53. [DOI] [PubMed] [Google Scholar]
- 15. Inoue H, Pan J, Hakura A. Suppression of v‐src transformation by the drs gene. J Virol 1998; 72: 2532–7. [DOI] [PMC free article] [PubMed] [Google Scholar]
- 16. Yamashita A, Hakura A, Inoue H. Suppression of anchorage‐independent growth of human cancer cell lines by the drs gene. Oncogene 1999; 18: 4777–87. [DOI] [PubMed] [Google Scholar]
- 17. Tambe Y, Isono T, Haraguchi S et al. A novel apoptotic pathway induced by the drs tumor suppressor gene. Oncogene 2004; 23: 2977–87. [DOI] [PubMed] [Google Scholar]
- 18. Ji L, Fang B, Yen N, Fong K et al. Induction of apoptosis and inhibition of tumorigenicity and tumor growth by adenovirus vector‐mediated fragile histidine triad (FHIT) gene overexpression. Cancer Res 1999; 59: 3333–9. [PubMed] [Google Scholar]
- 19. Saeki T, Mhashilkar A, Swanson X et al. Inhibition of human lung cancer growth following adenovirus‐mediated mda‐7 gene expression in vivo . Oncogene 2002; 21: 4558–66. [DOI] [PubMed] [Google Scholar]
- 20. Roz L, Gramegna M, Ishii H et al. Restoration of fragile histidine triad (FHIT) expression induces apoptosis and suppresses tumorigenicity in lung and cervical cancer cell lines. Proc Natl Acad Sci USA 2002; 99: 3615–20. [DOI] [PMC free article] [PubMed] [Google Scholar]
- 21. Wu L, Johnson M, Sato M. Transcriptionally targeted gene therapy to detect and treat cancer. Trends Mol Med 2003; 9: 421–9. [DOI] [PMC free article] [PubMed] [Google Scholar]
- 22. Sato M, Johnson M, Zhang L et al. Optimization of adenoviral vectors to direct highly amplified prostate‐specific expression for imaging and gene therapy. Mol Ther 2003; 8: 726–37. [DOI] [PMC free article] [PubMed] [Google Scholar]
- 23. Huyghe BG, Liu X, Sutjipto S et al. Purification of a type 5 recombinant adenovirus encoding human p53 by column chromatography. Hum Gene Ther 1995; 6: 1403–16. [DOI] [PubMed] [Google Scholar]
- 24. Ooumi S. Preparation of anti‐peptide antibody using rabbit. In: Ooumi S, Tujimura K, Inagaki M, eds. Experimental Protocol for Anti‐Peptide Antibody. Tokyo: Shujunsha, 1995: 48–74 (in Japanese). [Google Scholar]
- 25. Yanagihara M, Sasaki‐Takahashi N, Sugahara T et al. Leptosins isolated from marine fungus Leptoshaeria species inhibit DNA topoisomerases I and/or II and induce apoptosis by inactivation of Akt/protein kinase B. Cancer Sci 2005; 96: 816–24. [DOI] [PMC free article] [PubMed] [Google Scholar]
- 26. Matsushima R, Kondo M, Nishimura M et al. A novel ER‐derived compartment, the ER body, selectively accumulates a β‐glucosidase with a ER‐reaction signal in Arabidopsis. Plant J 2003; 33: 493–502. [DOI] [PubMed] [Google Scholar]
- 27. Schroeck F, Arroyo de Prada N, Sperl S et al. Interaction of plasminogen activator inhibitor type‐1 (PAI‐1) with vitronectin (Vn): mapping the binding sites on PAI‐1 and Vn. Biol Chem 2002; 383: 1143–9. [DOI] [PubMed] [Google Scholar]
- 28. Ciccarelli FD, Doerks T, Bork P. AMOP, a protein module alternatively spliced in cancer cells. Trends Biochem Sci 2002; 27: 113–15. [DOI] [PubMed] [Google Scholar]
- 29. Colombatti A, Bonaldo P, Doliana R. Type A modules: interacting domains found in several non‐fibrillar collagens and in other extracellular matrix proteins. Matrix 1993; 13: 297–306. [DOI] [PubMed] [Google Scholar]
- 30. Chang C, Werb Z. The many faces of metalloproteases: cell growth, invasion, angiogenesis and metastasis. Trends Cell Biol 2001; 11: 37–43. [DOI] [PMC free article] [PubMed] [Google Scholar]
- 31. Seals DF, Courtneidge SA. The ADAMs family of metalloproteases: multidomain proteins with multiple functions. Genes Dev 2003; 17: 7–30. [DOI] [PubMed] [Google Scholar]
- 32. Sbarba PD, Rovida E. Transmodulation of cell surface regulatory molecules via ectodomain shedding. Biol Chem 2002; 383: 69–83. [DOI] [PubMed] [Google Scholar]
- 33. Noe V, Fingleton B, Jacobs K et al. Release of an invasion promoter E‐cadherin fragment by matrilysin and stromelysin‐1. J Cell Sci 2001; 114: 111–18. [DOI] [PubMed] [Google Scholar]
- 34. Davies G, Jiang WG, Mason MD. Matrilysin mediates extracellular cleavage of E‐cadherin from prostate cancer cells: a key mechanism in hepatocyte growth factor/scatter factor‐induced cell‐cell dissociation and in vitro invasion. Clin Cancer Res 2001; 7: 3289–97. [PubMed] [Google Scholar]
- 35. Chan AO. E‐cadherin in gastric cancer. World J Gastroenterol 2006; 12: 199–203. [DOI] [PMC free article] [PubMed] [Google Scholar]
- 36. Edelman GM. Cell adhesion molecules in the regulation of animal form and tissue pattern. Annu Rev Cell Biol 1986; 2: 81–116. [DOI] [PubMed] [Google Scholar]
- 37. Kamiguchi H, Lemmon V. IgCAMs: bidirectional signals underlying neurite growth. Curr Opin Cell Biol 2000; 12: 598–605. [DOI] [PubMed] [Google Scholar]
- 38. Satoh‐Horikawa K, Nakanishi H, Takahashi K et al. Nectin‐3, a new member of immunoglobulin‐like cell adhesion molecules that shows homophilic and heterophilic cell‐cell adhesion activities. J Biol Chem 2000; 275: 10 291–9. [DOI] [PubMed] [Google Scholar]
- 39. Adams CL, Chen YT, Smith SJ et al. Mechanisms of epithelial cell‐cell adhesion and cell compaction revealed by high‐resolution tracking of E‐cadherin‐green fluorescent protein. J Cell Biol 1998; 142: 1105–19. [DOI] [PMC free article] [PubMed] [Google Scholar]
- 40. Takeichi M. Cadherins in cancer: implications for invasion and metastasis. Curr Opin Cell Biol 1993; 5: 806–11. [DOI] [PubMed] [Google Scholar]
- 41. Birchmeier W, Behrens J. Cadherin expression in carcinomas: role in the formation of cell junctions and the prevention of invasiveness. Biochim Biophys Acta 1994; 119: 11–26. [DOI] [PubMed] [Google Scholar]
- 42. Hirohashi S. Inactivation of the E‐cadherin‐mediated cell adhesion system in human cancers. Am J Pathol 1998; 153: 333–9. [DOI] [PMC free article] [PubMed] [Google Scholar]
- 43. Medjkane S, Novikov E, Versteege I et al. The tumor suppressor hSNF5/INI1 modulates cell growth and actin cytoskeleton organization. Cancer Res 2004; 64: 3406–13. [DOI] [PubMed] [Google Scholar]
- 44. Schofield DE, Beckwith JB, Sklar J. Loss of heterozygosity at chromosome regions 22q11‐12 and 11p15.5 in renal rhabdoid tumors. Gene Chromosomes Cancer 1996; 15: 10–7. [DOI] [PubMed] [Google Scholar]
- 45. Wieser R, Fritz B, Ullmann R et al. Novel rearrangement of chromosome band 22q11.2 causing 22q11 microdeletion syndrome‐like phenotype and rhabdoid tumor of kidney. Human Mutation 2005; 26: 78–83. [DOI] [PubMed] [Google Scholar]
- 46. Hoang‐Xuan K, Merel P, Vega F et al. Analysis of the NF2 tumor‐suppressor gene and of chromosome 22 deletions in gliomas. Int J Cancer 1995; 60: 478–81. [DOI] [PubMed] [Google Scholar]
- 47. Hartmann C, Numann A, Mueller W et al. Fine mapping of chromosome 22q tumor suppressor gene candidate regions in astrocytoma. Int J Cancer 2004; 108: 839–44. [DOI] [PubMed] [Google Scholar]