

Abstract
Gliomas in the form of astrocytomas, anaplastic astrocytomas and glioblastomas are the most common brain tumors in humans. Early detection of these cancers is crucial for successful treatment. Proteomics promises the discovery of biomarkers and tumor markers for early detection and diagnosis. In the current study, a differential gel electrophoresis technology coupled with matrix‐assisted laser desorption/ionization–time of flight and liquid chromatography–tandem mass spectroscopy was used to investigate tumor‐specific changes in the proteome of human brain cancer. Fifty human brain tissues comprising varying diagnostic groups (non‐tumor, grade I, grade II, grade III and grade IV) were run in duplicate together with an internal pool sample on each gel. The proteins of interest were automatically picked, in‐gel digested and mass spectrometry fingerprinted. Two hundred and eleven protein spots were identified successfully and were collapsed into 91 unique proteins. Approximately 20 of those 91 unique proteins had, to our knowledge, not been reported previously as differentially expressed in human brain cancer. Alb protein, peroxiredoxin 4 and SH3 domain‐binding glutamic acid‐rich‐like protein 3 were upregulated in glioblastoma multiform versus non‐tumor tissues. However, aldolase C fructose‐biphosphate, creatine kinase, B chain dihydrolipoyl dehydrogenase, enolase 2, fumarate hydratase, HSP60, lactoylglutathione lyase, lucine aminopeptidase, Mu‐crystallin homolog, NADH‐UO 24, neurofilament triplet L protein, septin 2, stathmin and vacuolar ATP synthase subunit E were downregulated in glioblastoma multiform compared with non‐tumor tissues. These differentially expressed proteins provided novel information on the differences existing between normal brain and gliomas, and thus might prove to be useful molecular indicators of diagnostic or prognostic value. (Cancer Sci 2007; 98: 201–213)
Abbreviations:
- 2‐DE
two‐dimensional electrophoresis
- ASB‐16
tetradecanoylamidopropyldimethylammoniopropanesulfonate
- BP
band pass
- CHAPS
(3‐[3‐cholamidopropyl] dimethylammonio)‐1‐propane‐sulfonate
- DTT
dithiothreitiol
- DIGE
difference gel electrophoresis
- EGFR
epidermal growth factor receptor
- ESI
electrospray ionization
- GAPDH
glyceraldehyde‐3‐phosphate dehydrogenase
- GBM
glioblastoma multiform
- GFAP
glial fibrillary acidic protein
- HSP
heat shock protein
- IPG
immobilized pH gradient
- IPG‐Dalt
two‐dimensional polyacrylamide gel electrophoresis with immobilized gel electrophoresis
- IPI
international protein index
- LC
liquid chromatography
- MALDI‐TOF
matrix‐assisted laser desorption/ionization–time of flight
- MS
mass spectrometry
- MS/MS
tandem mass spectrometry
- PAGE
polyacrylamide gel electrophoresis
- PIUMS
Protein Identification Using Mass Spec
- SDS
sodium dodecyl sulfate
- UCH‐L1
ubiquitin carboxyl‐terminal hydrolase L1.
Cancer is a complex multistep disease. It is estimated that there are at least six steps of tumor progression and each may be acquired through a wide range of events.( 1 ) One important aspect is that once cancer metastasizes to the brain, the metastasized brain tumor becomes the direct cause of mortality in almost all cases. Brain tumors are classified under several different schemes according to cell morphology and the degree of malignant behavior. The majority of primary brain tumors arise from glial cells and are categorized broadly as gliomas, but are usually broken down into more specific subtypes such as astrocytoma, oligodendroglioma and ependymoma.( 2 ) Since 1993 the World Health Organization classification of brain tumors has been the leading system. It divides brain tumors into many subtypes and into four malignancy grades, namely grades I–IV.( 3 ) Grade I astrocytomas (pilocytic astrocytomas) are more common in children and are considered benign, having a much more favorable prognosis.( 4 ) Grade II gliomas are well‐differentiated tumors with increased cellularity and some cellular and nuclear polymorphism. The presence of mitotic activity characterises grade III gliomas (anaplastic gliomas), and endothelial cell proliferation and necrosis are signs of the most malignant form, grade IV gliomas.( 5 ) GBM is the most common and most malignant primary brain tumor in adults, but is relatively rare in children.( 6 ) Classically, GBM has been identified into one of two forms, primary or de novo tumors and secondary or progressive tumors that arise from lower‐grade gliomas.( 7 , 8 ) The incidence of GBM in Europe and North America is two to three cases per 100 000 people per year. Despite modern therapy, including microsurgical resection and adjuvant radio‐ and chemotherapy, 75% of patients die within 18 months of diagnosis.( 9 ) The histological classification of brain tumors is complex; hence, there are situations in which the World Health Organization four‐grade system is problematic, primarily because pathological diagnosis remains subjective.( 10 )
As key molecular entities, proteins are widely accepted to play a more direct role than DNA/RNA in dictating different cellular activities. Consequently, they are more pertinent in the study of human diseases.( 11 ) Quantitation of protein expression in a proteome provides the first clue into how the cell responds to changes in its surrounding environments. The resulting over‐ or underexpressed proteins are deemed to play important roles in the precise regulation of cellular activities that are directly related to a given exogenous stimulus.( 12 ) Proteomics, defined as the protein complement of a cell line, tissue or organism, is the natural successor to genomics. Its ultimate goal is to understand the structure and function of the proteins expressed by the human genome, towards the delineation of signaling networks and the regulation of normal cell function.( 13 ) The limitations in a proteomic analysis are of two kinds: (i) those related to the composition of the proteome to be analyzed, mainly concerning protein expression levels (which appear in all proteomics analyses); and (ii) limitations of the analytical methods.
Most diseases are manifested through changes in protein levels or functions and existing drug therapies typically aim to interfere with the activity of a specific protein. To discover novel disease biomarkers in brain cancer, large‐scale protein surveys identifying many proteins are needed. Differential protein spot analysis from 2‐D gels has maintained its value as the most accurate method to resolve and quantitate human proteins. In the first study on brain gliomas, the protein expression profiles of human astrocytes and human glioblastoma cell lines were compared.( 14 ) They found four proteins that were highly expressed in glioblastoma cells, namely Hsp27, brain specific transglutaminase, major vault protein and cystatin B. Iwadate and coworkers highlighted 25 proteins that were differentially expressed between astrocytomas of different grades.( 15 ) Interestingly, eight of the proteins increased in high‐grade gliomas were small G‐proteins, suggesting that aberrant G‐protein signaling might be involved in the malignant transformation of gliomas. Odreman and coworkers compared the protein pattern of low‐grade fibrillary astrocytomas to that of GBM by 2‐DE.( 10 ) Fifteen differentially expressed proteins, as well as 70 conserved spots, were identified. Among the proteins more highly expressed in GBM, they found peroxiredoxin 1 and 6, the transcription factor BTF3, and α‐B‐crystallin, whereas protein disulfide isomerase A3, the catalytic subunit of the cAMP‐dependent protein kinase, and the glial fibrillary acidic protein were increased in low‐grade astrocytomas.
A more recent study used a 2‐DE/MS approach to separate and identify differentially expressed proteins in human astrocytomas of different grades.( 16 ) Examination of the protein profiles of 27 astrocytoma samples of different grades revealed 72 distinct, differentially expressed proteins belonging to various functional groups such as cytoskeleton and intermediate filament proteins, HSP, enzymes and regulatory proteins. Based on the consistency of their differential expression, 29 distinct proteins were short listed and may have a role in the pathology of astrocytomas. Some were found to be differentially expressed in both grade III and IV astrocytomas, whereas others were associated with a particular grade. Further investigation is still required to reach a more comprehensive knowledge of the proteins that are selectively up‐ or downregulated in gliomas of different grades.
In the present large‐scale study, we combined a 2‐D DIGE approach using the mixed‐sample internal standard with sensitive protein identification using MALDI‐TOF MS and LC‐MS/MS, coupled with database interrogation to screen 50 brain samples, including different stages of brain cancer, for consistent changes in protein expression in the disease states. Remarkably, resolved protein spots were observed, permitting the identification of 211 spots and providing a step forward toward marker discovery for brain cancer.
Materials and Methods
Brain tissue samples. These investigations were approved by the Lund University Ethical Committee. Brain tissue samples were collected immediately after surgical resection, snap‐frozen in liquid nitrogen, and divided into three portions. One portion was stored at −80°C in the Biobank, whereas the second portion was fixed in 10% formaldehyde and embedded in paraffin for histological diagnosis. The third portion was cleaned of necrotic parts and kept at −80°C for proteomic analysis. Surgical specimens from epilepsy patients, collected and processed as above, served as experimental controls (non‐tumors). In the present study, seven non‐tumor (epilepsy), five grade II, four grade III, 24 primary GBM, four secondary GBM, two high‐malignancy and two low‐malignancy cases were selected (Table 1).
Table 1.
Description of human brain samples used throughout the current study
| Sample code | Group | Patient age (years) | Sex | |
|---|---|---|---|---|
| T1 | GBM Primary | GBM (IV) | 55 | F |
| T2 | GBM Primary | GBM (IV) | 49 | M |
| N3 | Non‐TC | Epilepsy | 42 | M |
| T4 | GBM Primary | GBM (IV) | 46 | F |
| T7 | Grade II | Oligodendroglioma (II) | 47 | M |
| T9 | Grade III | Oligoastrocytoma (II) | 49 | M |
| T10 | GBM Primary | GBM (IV) | 67 | M |
| T11 | GBM Secondary | 28 | M | |
| T12 | Grade III | Astrocytoma (III) | 77 | F |
| T13 | GBM Primary | GBM (IV) | 55 | M |
| T14 | Grade II | Oligoastrocytoma (II) | 31 | M |
| N15 | Non‐TC | Epilepsy | 37 | F |
| N16 | Non‐TC | Epilepsy | 47 | M |
| T18 | Grade II | Oligoastrocytoma (II) | 44 | F |
| T19 | GBM Primary | GBM (IV) | 59 | F |
| T21 | GBM Primary | GBM (IV) | 54 | F |
| T23 | GBM Primary | GBM (IV) | 62 | M |
| T24 | GBM Primary | GBM (IV) | 68 | F |
| T27 | GBM Secondary | GBM (IV) | 68 | M |
| T28 | High malignancy | Other | 49 | M |
| T30 | GBM Primary | GBM (IV) | 55 | F |
| T32 | GBM Secondary | GBM (IV) | 63 | M |
| T33 | GBM Primary | GBM (IV) | 59 | F |
| T34 | GBM Primary | GBM (IV) | 46 | F |
| T35 | GBM Primary | GBM (IV) | 71 | F |
| N36 | Non‐TC | Other | 55 | M |
| T37 | Grade III | Astrocytoma (II) | 40 | F |
| N38 | Non‐TC | Epilepsy | 8 | F |
| T39 | GBM Primary | GBM (IV) | 24 | F |
| T40 | Grade II | Astrocytom (II) | 32 | M |
| T43 | High malignancy | GBM (IV) | 68 | F |
| T44 | Low malignancy | Other | 22 | M |
| T45 | GBM Primary | GBM (IV) | 56 | F |
| T46 | GBM Primary | GBM (IV) | 43 | F |
| T47 | GBM Primary | GBM (IV) | 55 | M |
| T48 | Low malignancy | Other | 41 | F |
| T50 | GBM Primary | GBM (IV) | 46 | M |
| T51 | GBM Primary | GBM (IV) | 55 | M |
| T52 | GBM Primary | GBM (IV) | 56 | F |
| T53 | GBM Secondary | 14 | M | |
| T54 | GBM Primary | GBM (IV) | 58 | M |
| T55 | GBM Primary | GBM (IV) | 63 | F |
| T57 | GBM Secondary | GBM (IV) | 62 | M |
| T59 | GBM Primary | GBM (IV) | 54 | F |
| N60 | Non‐TC | Epilepsy | 24 | M |
| T61 | GBM Secondary | 33 | M | |
| T62 | GBM Primary | GBM (IV) | 62 | F |
| T63 | Grade II | Astrocytoma (II) | 32 | F |
| T64 | Grade III | Oligoastrocytom (II) | 42 | F |
| N65 | Non‐TC | Epilepsy | 28 | F |
GBM, glioblastoma multiform.
Sample preparation for 2‐D PAGE. Throughout the complete tissue dissection procedure (ball mill grinding method), tissue samples were kept on dry ice. Small tissue pieces of an appropriate size (∼5 × 5 × 4 mm) that gives approximately 100–150 mg were cut on a cryostat, placed in a cold ceramic tube, wrapped in tin foil and dropped immediately in liquid nitrogen. The ceramic tube was then taken from the liquid nitrogen and fixed rapidly in Mikrodismembrator U shaking ball mill (B. Braun Biotech) and run for 30–60 s at full speed. Tubes were removed from the shaker, and stored rapidly again in liquid nitrogen until processed. Lysis buffer (2% ASB‐16, 8 M urea, 5 mM magnesium acetate, 20 mM Tris‐base [pH 8.5]) corresponding to 10× the wet weight of the sample was added directly into the ceramic tubes. To obtain maximum solubilization, the suspensions were incubated at room temperature for 20 min, and then transferred to fresh microcentrifuge tubes. Insoluble components were sedimented by centrifugation for 20 min at 16 000g at 4°C. All sample preparations for gel analysis were carried out in a cold room. Protein extract (40–120 µL) was exchanged through a Desalting Spin Column (Pierce Biotechnology) that had been prewashed three to four times in sample buffer containing 4% CHAPS, 7 M urea, 2% thiourea and 0.5% DTT. Consequently, the desalted sample was subjected to protein determination using a protein assay kit according to the method of Lowry.( 17 ) Thiourea was added to the sample buffer prior to electrophoresis in order to avoid its effect on the protein assay. The desalted protein extracts were transferred quantitatively to a fresh microcentrifuge tube, then divided into small aliquots and kept at −80°C.
2‐D gel electrophoresis. CyDye DIGE Fluors (Cy2, Cy3 and Cy5) have an N‐Hydroxysuccinimide (NHS) ester reactive group, and are designed to attach covalently to the epsilon amino group of lysine via an amide linkage. The mixed internal standards (pool samples) were prepared by mixing equal amounts of protein from each individual homogenate.( 18 ) To determine and exclude non‐specific labeling, both a ‘forward’ (sample A labeled with Cy3, sample B labeled with Cy5) and a ‘reverse’ (sample B labeled with Cy5, sample A labeled with Cy3) labeling were done (Table S1). The pH of the reaction was set to 8.5 to ensure that there were suitable numbers of lysine residues with unprotonated NHS groups. Cyanine dyes were added at a ratio of 200 pmol : 25 µg protein to the protein extracts and vortexed, and the labeling reaction was carried out for 30 min on ice in the dark, after which lysine was added (1 µL per 200 pmol dye) and kept on ice for 10 min. Prior to isoelectric focusing, labeled samples were mixed and an equal volume of quenching buffer containing 4% CHAPS, 7 M urea, 2 M thiourea, 2% DTT, 1% (v/v) IPG buffer pH 3–10 (Amersham Biosciences) was added so that the final concentrations of DTT and IPG buffer were 1% and 0.5%, respectively. The samples were vortexed and incubated on ice for a further 15 min in the dark. Then the Cy2‐labeled internal pool was combined with the Cy3‐labeled sample extract and Cy5‐labeled sample extract. The IPG strips (Immobilized DryStrips 3–10 NL, 24 cm) were rehydrated in a rehydration buffer of 7 M urea, 2 M thiourea, 2% CHAPS, 1.2% (v/v) Destreak (Amersham Biosciences), 0.5% (v/v) IPG buffer and 0.002% bromophenol blue( 19 ) containing labeled samples. The IPG–isoelectric focusing was carried out using a ramping protocol with the IPGphor system (Amersham Bioscience) at 20°C and 50 µA per IPG strip as follows: 6 h at 30 V, 6 h at 60 V, 1 h at 300 V, 1 h at 600 V, 1 h at 1000 V, 1 h at 2000 V, 1 h at 3000 V, and 8 h at 8000 V. The strips were focused for a total of 75 000 Vh. Following focusing, each IPG strip was equilibrated on a rocking table with equilibration buffer A (50 mM Tris‐HCl [pH 8.8], 6 M urea, 30% glycerol, 1% SDS and 65 mM DTT) for 15 min, followed by rocking with equilibration buffer B (50 mM Tris‐HCl [pH 8.8], 6 M urea, 30% glycerol, 1% SDS and 240 mM idoacetamide). The 2‐D SDS‐PAGE was then carried out using a peltier‐cooled Ettan DALT Twelve electrophoresis unit (Amersham Bioscience) until the bromophenol blue front had just run off the base of the gel. The gels were rinsed for 15–20 min in a fixation solution containing 5% acetic and 30% ethanol, washed twice in distilled water for 5 min and kept in water in the dark until scanning.
Gel imaging and analysis. Labeled proteins were visualized using the Typhoon 9410 imager (Amersham Bioscience). Cy2 images were scanned using a 488‐nm laser and an emission filter of 520 nm, BP 40. Cy3 images were scanned using a 532‐nm laser and an emission filter of 580 nm, BP 40. Cy5 images were scanned using a 633‐nm laser and an emission filter of 670 nm, BP 30. All gels were scanned at 100 µM pixel resolution. Images were cropped to remove areas extraneous to the gel image using ImageQuant V5.0 (Amersham Bioscience). All of the images were analyzed using DeCyder software package V5.0 (Amersham Biosciences), a 2‐D analysis software platform designed specifically for use with DIGE. On individual gels, Cy2‐labeled images (from the pooled standard) were compared with either the Cy3 (Cy2 : Cy3) or Cy5 (Cy2 : Cy5) images from the individual brain samples using the DeCyder differential in‐gel analysis software module. Image pairs were processed to codetect and differentially quantify the protein spots in the images. The estimated number of spots for each codetection procedure was set to 2500. When calculating the abundance ratios for spot pairs in codetected sample images, the spot volumes of the component spot maps were normalized to compensate for differences in system gain (differences in laser intensity, fluorescence, filter transmittance, sample amount). The normalization was based on the assumption that the majority of all protein spots in the experiment had not changed from one image to the next. Following the normalization procedure, the volume ratios of spot pairs from codetected images were calculated. An advantage of sample multiplexing in DIGE is that detected spot boundaries from the same gel will overlay perfectly, and therefore gel warping is not required to match the spots within image pairs from the same gel. Gel‐to‐gel matching of the standard spot maps from each gel, followed by statistical analysis of protein abundance changes between samples, was then carried out using the DeCyder‐biological variation analysis software module. Molecular masses were determined by analyzing standard protein markers that covered the range 10–200 kDa. pI values were used as given by the supplier of the IPG strips. Electronic images of the gels were recorded using Adobe Photoshop software. The images were stored as tiff (approximately 5 Mbyte/file) and jpeg (∼150 kbyte/file) formats.
Selection of spots for MS. The following diagnostic groups were used: GBM, grade II, grade III, grade II + III, high malignancy, low malignancy, normal brain, primary GBM, secondary GBM, grade III + secondary GBM, and GBM + grade II + III. The composite groups were the union of the individual groups. All spots that had a t‐test P‐value below 0.0001 or a Wilcoxon rank sum test P‐value below 0.001 in any pairwise comparison were selected. Furthermore, the following six pairwise comparisons were considered especially important and were used to select more spots: (i) GBM versus normal brain; (ii) GBM + grade II + III versus normal brain; (iii) grade II + III versus normal brain; (iv) grade II versus normal brain; (v) GBM versus grade II + III; and (vi) grade II + III versus primary GBM. All spots within the top 100 ranked spots in a t‐test were selected. In addition, all spots that were up‐ or downregulated more than 2.5‐fold and had a t‐test P‐value below 0.01 or a Wilcoxon rank sum P‐value below 0.05 were selected as well. Several of the aforementioned criteria selected the same spots, and in total 374 spots were selected. The cut‐offs in the selection were tailored to get around 374 spots, which was the experimental limit.
Automatic spot picking and in‐gel digestion. Preparative gels were run, with each containing approximately 950 µg of unlabeled standard pool and a 50 µg spike of Cydye labeled pool to allow matching to the experimental set. The gels were poststained with homemade SyproRuby (bathophenantroline disulfonate).( 20 ) A spot cut list of proteins of interest was generated by the DeCyder‐biological variation analysis module covering proteins whose expression levels were changing. The protein spots were excised robotically with the 2‐mm picker head of the Ettan spot handling workstation (Amersham Biosciences) into 150 µL of water and then washed twice for 30 min in 100 µL 50% methanol, 50 mM ammonium bicarbonate and once with 100 µL 75% acetonitrile. The washing step ensures complete removal of protein revealers (Sypro dye) as well as SDS detergent. The suspension was sonicated to destroy the gel matrix using 10 pulses/s, each at maximal energy setting. A total of 7 µL porcine modified trypsin protease (Promega) (20 µg/µL trypsin in 20 mM ammonium bicarbonate) was added to the dried gel pieces, which were incubated at 37°C for 1 h. Tryptic peptides were then extracted from gel plugs in two cycles of 60 and 40 µL of 50% acetonitrile and 1% formic acid, respectively, using the Ettan Digester workstation, transferred into a 96‐well plate and dried by vacuum centrifugation. The plate was kept at −80°C until used either for MALDI or LC‐MS/MS.
MS analysis for protein identification. Dried peptides were reconstituted in 3 µL α‐cyano‐hydroxycinnamic acid matrix (2.5 µg/µL in 50% acetonitrile, 0.05% trifluoroacetic acid). The 96‐well plate was then transferred to a Micromass MassPrep Sample Handler where a 2‐µL aliquot of the peptide mixture was spotted onto MALDI MS targets (Micromass target plates). MALDI spectra were acquired in data‐dependent mode on a Micromass MALDI‐TOF HT (Waters). All of the spectra were obtained in positive reflector mode with delayed extraction using an accelerating voltage of 28 kV.
LC‐MS/MS was carried out using Micromass Qtof Ultima API (ESI‐MSMS from Waters) coupled to a CapLC (Waters). Dried peptides were reconstituted in 3 µL 0.1% formic acid for 1 h at room temperature. The auto sampler injected 6 µL of sample and the peptides were trapped on a precolumn (C18, 300 µM × 5 mM, 5 µM, 100 Å; LC‐Packings) and separated on a reversed‐phase analytical column (Atlantis, C18, 75 µM × 150 mM, 3 µM, 100 Å; Waters). The flow through the column was 200 nL/min. Solvent A consisted of 2% acetonitrile, 98% water with 0.1% formic acid. Solvent B consisted of 90% acetonitrile, 10% water and 0.1% formic acid. The high‐performance LC method used 5% solvent B for 3 min, 5–60% solvent B for 42 min, 60–80% solvent B for 5 min, 80% solvent B for 25 min, 80–85% solvent B for 1 min and 5% solvent B for 15 min. The total run time was 90 min. The MS analysis was made by dynamic data acquisition. The mass range (m/z) was from 400 to 1600 for MS and from 50 to 1800 for MS/MS. The ESI MS/MS tandem spectra were recorded in the automated MS to MS/MS switching mode, with an m/z‐dependent set of collision offset values. Only spectra from ions with charge state 2 and 3 were selected and fragmented, with argon used as the collision gas. The acquired spectra were processed to PKL files using the ProteinLynx global server (http://www.waters.com).
MS database searches were carried out against a non‐redundant IPI database (http://www.ensemble.org/IPI) using PIUMS software.( 21 ) MS searches were carried out without constraining protein molecular weight or isoelectric point, and allowed for carbamido methylation of cysteine, partial oxidation of methionine residues, and one missed trypsin cleavage. A protein hit was considered significant if the PIUMS quality score was = 4.7, which corresponds to an expectation value of 0.01. A search in IPI human was also done using the search engine Mascot Demon (http://www.matrixcscience.com) and the results from this search were compared with the results from PIUMS. Mascot compares the mass values of observed product ions with mass values calculated for theoretical product ions from peptide sequences present in a specified genomic database. From this comparison, a probability‐based score is calculated, which reflects the statistical significance of the match between the product ion spectrum and the sequences contained in the databases.( 22 ) The mascot ion score for a MS/MS match is based on the absolute probability that the observed match between the experimental data and the database sequence is a random event: score = −10*log10(probability). The threshold for significance was chosen as P < 0.05.
In the present study, we considered single peptide identification to be insufficient for protein identification due to the ‘golden match standard’. We required a minimum of two unique peptides at disparate sites within a protein to be the minimum for a positive identification; in other words, the protein sequence was identified only after mass spectrometric analysis of two or more unique peptides, each of whose probability scores met or exceeded the threshold (P < 0.05) for statistical significance. Proteins, genes, functions and associations with normal and disease states were checked and verified using the following: the National Center for Biotechnology Information (http://www.ncbi.nlm.nih.gov/entrez/query.fcgi?db=PubMed); ExPASy Expert Protein Analysis System (http://www.expasy.org); Online Mendelian Inheritance in Man (http://www.ncbi.nlm.nih.gov/entrez/query.fcgi?db=OMIM); and GeneCards (http://www.genecards.org/index.shtml) (websites accessed 1 January 2006).
Results
Protein separation and DIGE. Fifty human brain tissues (seven non‐tumors, five grade II, four grade III, 24 primary GBM, four secondary GBM, two low malignancy and two high malignancy) were run in duplicate by DIGE together with an internal pool sample on each gel, as can be seen in Table S1. The standard sample was a pool comprising equal amounts of each of the 50 brain tumors. The comparisons were carried out in duplicate with reciprocal labeling. The 150 images were acquired, and fully automated spot detection and quantification was carried out using Decyder software (Amersham). A master gel was chosen, to which the spots on each of the 49 remaining gels were matched followed by automated gel‐to‐gel matching and statistical analysis. The spot volume (corresponding to the sum of the pixel values within a spot boundary) was used as a measure of protein abundance. The expression values of the spots were quantified as the base 2 logarithm of the ratio between the spot volumes in the experimental and reference samples. The number of matched spots on the gels ranged from 712 to 1465, with 1465 being the highest number observed in the master gel. Analysis of variance (ANOVA) was applied to the matched spots and the data was filtered to retain spots with ANOVA P‐values of 0.05 or less. Representative 2‐D gel images of various histological brain cancer grades, separated on a non‐linear pH scale of 3–10 non‐linear and a 12% SDS‐PAGE are shown in Fig. 1.
Figure 1.
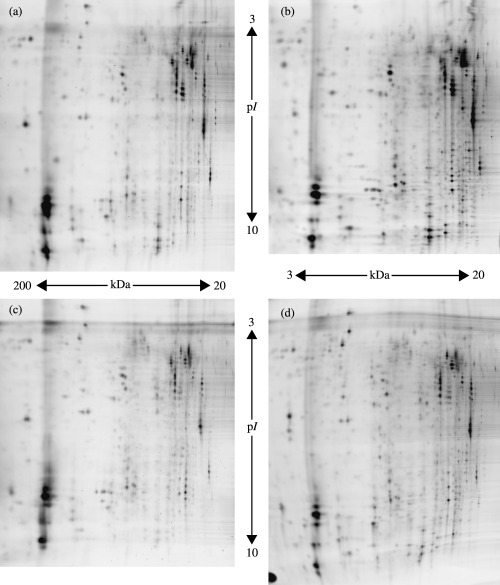
Representative 2‐D protein expression profiles of each histological brain cancer grade. (a) Primary glioblastoma multiform (GBM); (b) secondary GBM; (c) grade II; and (d) non‐tumor brain tissue.
The high sensitivity of DIGE permits the detection of as little as 1 fmol protein as well as protein differences as low as ±1.2‐fold, which is greater than two standard deviations. As a result, sample multiplexing in DIGE offers major advantages over standard techniques for comparative proteomic studies, as it together with the linear dynamic range of fluorescent protein labeling allows small differences to be detected accurately and quantified with statistical confidence, rather than merely the large changes that would be observed by the use of conventional ‘one sample per gel’ techniques. Reproducible results were obtained; the protein spots were occasionally distributed over the whole gel but were more concentrated in the pH range 4–7 (Fig. S1). Most of the protein spots were distributed in the molecular mass range of 20–120 kDa. A similar general pattern of protein spots was also observed throughout the entire experiment. The differences observed between tumors of the same grade were due to the heterogeneity present between gliomas of the same histological category and also to the varying levels of protein degradation resulting from tissue necrosis.( 10 )
Two central issues in comparative proteomic analysis are reproducibility and quantification. The main limitation of 2‐D gel electrophoresis arises from no two gels being exactly alike. DIGE alleviates this problem when comparing two or three samples. The data reported here originated from comparisons of 50 DIGE gels. The varying detection methods may give rise to different 2‐D images, as a result of the individual specificity of each detection method. For example, Cy fluorescent dyes bind the lysine residues of proteins whereas SyproRuby has a strong affinity for lysine, arginine and histidine residues and a weak affinity for tyrosine and tryptophan residues.( 23 )
Spot picking and MS/MS analysis. In order to identify proteins expressed significantly, pick gels were prepared for MS analysis. Each run contained 950 µg of unlabeled pool and a 25‐µg spike of Cy dye labeled pool. The gels were poststained with SyproRuby dye overnight, after which the excess dye was removed by washing in distilled water for 12 h. A comparison of the SyproRuby and CyDye images from the same gel revealed that certain spots were not exactly aligned, particularly in the lower molecular weight range of the gels. This is portrayed in Fig. S2. The reason for the misalignment is the minimal labeling of the proteins as well as the labeled protein having the additional mass of a covalently attached dye molecule (∼580 Da). However, this shift was not uniform for all proteins, suggesting that the dye labeling could alter the migration, or that more than one lysine residue could label a particular protein. Therefore, detection of proteins for excision and mass spectrometry required poststaining of the gels with an accurate protein stain (e.g. SyproRuby) that was compatible with MS.
A major challenge in proteomic research today is the identification of all of the proteins in a given biological system, as they exist in vivo. This is primarily due to the vast complexity and dynamic range of proteins, concurrent with techniques that lack the desired sensitivity of detection. Nonetheless, recent studies have indicated that the LC‐MS/MS approach may significantly improve the dynamic range of protein detection and identification in comparison to more traditional techniques such as 2‐D gels.( 24 ) In cases where MALDI‐TOF experiments resulted in ambiguous identification, LC‐MS/MS was used to confirm the amino acid sequence predicted from the putatively matched protein. To this end, protein extracts of glioma patients underwent global proteolysis with trypsin, and the resulting complex peptide mixture was subjected to LC. The separated molecules were fed directly into an ESI and tandem mass spectrometer (MS/MS). Briefly, ESI ionizes peptides by passing a peptide solution through a high‐voltage nozzle. Analyzers arranged in tandem use radiofrequency and direct‐current voltages to analyze the ions based on their mass and charge. The resulting full scan mass spectra is collected in real time in a fully automated fashion in order to identify the constituent peptides, and is followed by tandem MS and sequencing of selected peptides in each time interval.( 25 ) This MS to MS/MS cycle spans approximately 0.2 s, enabling a steady stream of peptide and fragment masses to be fed to a computer for an off‐line database search and protein identification. A representative MS/MS spectra obtained on the proteins targeted in the DIGE analysis is shown in Fig. S3. The processing of the ion peaks and a database search identified the picked spots as the astrocyte GFAP. The data suggested that protein identification could be achieved from small sample quantities. Mass spectra producing ambiguous results, indicating that there might be two or more proteins present in a single spot, did not allow us to identify the protein spot precisely, therefore it was classified as ‘unidentified’ in the present study.
Identification of protein spots. Proteomics can greatly advance the classification and diagnosis of diseases by delivering improvements in methodologies, reagents and protocols. Several proteomic approaches were described for the analysis of brain samples. Present studies in this research field are currently providing a first idea of the huge diversity of proteins expressed in the nervous system and how the variation in protein composition relates to injury and disease.( 26 ) A preliminary 2‐D map of the human brain was established in the late 1990s by the group of Fountoulakis,( 27 ) with 400 visible protein spots comprising approximately 200 different proteins. This map may be useful as a reference database for studying the changes in protein levels caused by various diseases. Based on the application of 2‐D techniques, several protein expression maps of healthy and diseased human brains have been established.( 27 , 28 ) These studies were basically restricted to 2‐D‐based protein pattern comparison between various primary brain tumors and healthy human cortexes,( 29 ) human glioma cell lines,( 30 ) neuroblastoma cell lines,( 31 ) and glioma cell lines of different species.( 32 )
A total of 374 spots that were significantly discriminating between at least two diagnostic groups were selected. Of these, 211 were associated with 91 unique proteins and were identified successfully by extensive MALDI‐TOF and LC‐MS/MS analysis. Table S2 shows a full list of all identified spots, their IPI numbers, protein names, spot numbers, molecular weights, pI and mascot scores. The positions of all diferentially expressed proteins on the gel are shown in Fig. 2a,b.
Figure 2.
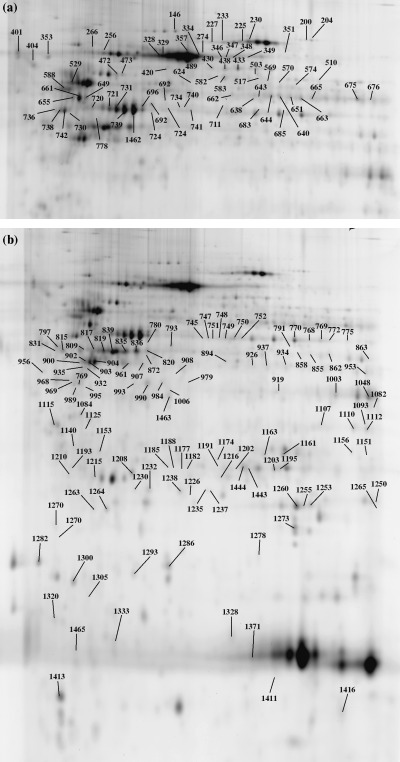
Two‐dimensional map illustrating the spot numbers of identified proteins in (a) the upper gel part and (b) the lower gel part. Spot distribution shows high intensity in the upper part of the master image. Spot numbers (from 1 to 1465) indicate all the proteins identified by mass spectrometry and the numbers refer to those reported in Table S2.
Identified proteins known as glioma markers. A series of proteins, known as generic brain tumor markers, were identified in the present study. These include: aconitate hydratase, actin cytoplasmic 1, annexin V, ATP synthase α‐chain, glyceraldehyde‐3‐phosphate, hemoglobin, lactate dehydrogenase B, peroxiredoxin 6, pyruvate kinase, tubulin B‐1 chain, protein‐l‐isoaspartate (d‐aspartate) O‐methyltransferase,( 10 ) heterogeneous nuclear ribonucleoprotein,( 33 ) enolase 1,( 10 , 33 ) galectin‐1, guanine nucleotide‐binding protein (GNBP), succinyl‐CoA 3‐ketoacid CoA transferase 1,( 14 ) ezrin, Hsp27,( 14 , 15 ) dihydropyrimidinase‐related protein (DRP)‐1, superoxide dismutase [Mn], triosephosphate isomerase,( 10 , 11 , 12 , 13 , 14 ) crystallin α‐B,( 10 , 14 , 15 ) glutamate dehydrogenase 1,( 10 , 15 ) ATPase, H+ transporting, tyrosine 3‐monooxygenase/tryptophan 5‐monooxygenase activation protein (also known as 14‐3‐3 protein gamma),( 16 ) tubulin β, vimentin,( 10 , 16 ) albumin, apolipoprotein A‐I,( 10 , 34 ) fatty acid‐binding protein (FABP) brain, ubiquitin carboxyl‐terminal hydrolase isozyme L1,( 10 , 14 , 34 ) GFAP,( 10 , 14 , 16 , 35 ) glucose‐regulated protein 78 kDa,( 15 , 36 ) glutathione S‐transferase P (GSTP),( 10 , 15 , 35 ) and HSP70.( 16 , 34 , 36 )
One main protein that was clearly up‐ and downregulated and present in multiple spots was GFAP (Fig. 3a,b). The electrophoretic, staircase‐like pattern of several isoforms and degradation products of intermediary filament proteins including GFAP is well established.( 37 , 38 ) GFAP is a known marker for neuronal decay and brain damage. It distinguishes astrocytes from other glial cells during the developmental stage of the central nervous system.( 39 ) GFAP belongs to the intermediate filament proteins and is considered a unique cell‐type marker.( 40 ) The levels of GFAP dynamically respond to aging as well as to neurodegenerative lesions and many studies have shown that the amount of GFAP generally increases in neurodegenerative diseases such as Alzheimer's disease.( 38 )
Figure 3.

Close‐up of isoforms of the (a,b) glial fibrillary acidic protein and (c,d) serum albumin. (a,c) Three‐dimensional view of isoforms; (b,d) partial view of dedicated 2‐D images. Images were generated by DeCyder software.
Identified proteins known as neurodegenerative disease markers. Neurodegenerative diseases are a varied assortment of central nervous system disorders characterized by the progressive loss of neural tissues. These disorders do not have cures as the neurons in the central nervous system cannot regenerate on their own after cell death or damage. Many of the proteins found in the present study turned out to be protein markers documented previously in neurodegenerative diseases. Examples of a few of these recently identified markers include: 14‐3‐3 protein epsilon,( 41 , 42 2) dihydrolipoyl dehydrogenase,( 43 ) glutathione synthetase,( 44 ) voltage‐dependent anion channel 1( 45 ) for Alzheimer's disease, serpina3 protein( 46 , 47 ) for Creutzfeldt–Jakob; UCH‐L1( 48 ) for Huntington's disease; DJ‐1 protein,( 49 ) UCH‐L1( 50 ) for Parkinson's disease; aconitase, actin, ATP synthase, creatine kinase, dihydropteridine reductase, enolase, fascin, gelsolin, glutamate dehydrogenase, glutathione transferase, GAPDH, HSP60, HSP70, moesin, pyruvate kinase, triosephosphate isomerase, vacuolar ATP synthase subunit E,( 51 ) ubiquinol cytochrome c reductase complex core protein 2,( 52 ) triosephosphate isomerase, and creatine kinase( 53 ) for schizophrenia.
The present study also pointed to the presence of other interesting proteins involved in neurodegenerative diseases, including apolipoprotein A‐I, of which high levels are found to be associated with neurodegeneration in Alzheimer's disease. The mitochondrial enzymes of the ATP synthase complex, subunits a and b, were also identified and these too have been associated with Alzheimer's disease. β‐Tubulin, a protein that has been implicated as a marker for both neurodegenerative and tumor disease states, was also identified. Consistent with previous studies, we have shown that the level of UCH‐L1, a neuronal de‐ubiquitinating enzyme whose mutation has been linked to an early onset of familial Parkinson's disease, was downregulated. UCH‐L1 is presumed to act as a recycling agent for ubiquitin by hydrolyzing the ubiquitinated peptides (i.e. the products of the proteasome). The RNA‐binding protein‐regulatory subunit oncogene (DJ‐1) was also detected. DJ‐1 is associated with PARK7, a monogenic form of human Parkinsonism. It was suggested that the DJ‐1 protein is involved in the oxidative stress response.( 54 ) Stathmin, a cytosolic protein that binds tubulin and destabilizes cellular microtubules, was also identified. The expression of stathmin is reduced in age‐related neurodegenerative conditions such as Alzheimer's disease in humans.( 55 ) Finally, we found that DRP2 was downregulated. DRP2, a specific oxidatively modified protein in Alzheimer's disease brain cells( 53 ) and whose expression is altered in Alzheimer's disease,( 56 ) performs two important functions in neurons. It modulates the activity of collapsin, a protein that elongates dendrites and directs them to adjacent neurons, and may also be involved in neuronal repair. It is normally highly expressed during brain development, but rarely in adult brains.
Neurodegenerative diseases are a varied assortment of central nervous system disorders characterized by the progressive loss of neural tissues. These disorders do not have cures because the neurons in the central nervous system cannot regenerate on their own after cell death or damage. It is worth mentioning that none of the patients had developed recognizable symptoms of any type of neurodegenerative disease.
Potential novel protein markers for glioma. Approximately 20 of the identified proteins have not, to our knowledge, been described previously as differentially expressed glioma markers. Alb protein, peroxiredoxin 4 and SH3 domain‐binding glutamic acid‐rich‐like protein 3 were upregulated in GBM versus non‐tumor tissues. However, aldolase C fructose‐biphosphate, creatine kinase, B chain dihydrolipoyl dehydrogenase, enolase 2, fumarate hydratase, HSP60, lactoylglutathione lyase, lucine aminopeptidase, Mu‐crystallin homolog, NADH‐UO 24, neurofilament triplet L protein, septin 2, stathmin and vacuolar ATP synthase subunit E were downregulated in GBM compared with non‐tumor tissues. The information on the identity of these differentially expressed proteins can be used for the development of novel markers required for brain cancer classification.
A grade‐wise distribution of the differentially expressed proteins is shown in Table S3. Fifteen proteins were identified as being overexpressed in GBM, whereas 32 were observed as being underexpressed. Notable among those found to be upregulated in our study are actin, cytoplasmic 1, annexin V, apolipoproteins A‐I, neurofilament‐66 and crystallin α B chain,( 10 ) serum albumin and vimentin.( 16 ) As mentioned earlier, GFAP was found to be both over‐ and underexpressed in GBM. Differential expression of other proteins, such as GAPDH, hemoglobin β chain and hypothetical protein FLJ45472, also displayed similar behavior. At the present time, no unequivocal explanation exists for this observation.
Potentially very useful proteins, preliminarily considered as potential novel glioma markers, were found to be either up‐ or downregulated. Among these, synuclein β is a non‐amyloid component of senile plaques found in Alzheimer's disease. It protects neurons from staurosporine and 6 hydroxy dopamine‐stimulated caspase activation in a p53‐dependent manner. Fumarate hydratase acts as a tumor suppressor, causing hereditary leiomyomatosis and renal cell cancer. Stathmin is involved in regulation of microtubules, and is present in much greater abundance in cells from patients with acute leukemia of different subtypes than in normal peripheral blood lymphocytes or cells from patients with chronic lymphoid or myeloid leukemia. DJ‐1 protects neurons against oxidative stress and cell death, and defects in its encoding gene are the cause of autosomal recessive early onset Parkinson disease. Finally, calcyclin‐binding protein participates in the ubiquitin‐mediated degradation of β‐catenin, and is localized in both the nucleus and cytoplasm of neuroblastoma cells after retinoic acid induction and calcium increase.
One of the most interesting proteins identified during the study, 14‐3‐3 gamma (also called stratifin), was found to be downregulated. The 14‐3‐3 protein exists primarily as a homo‐ and heterodimeric substance within all eukaryotic cells, and is known as a cell cycle regulator of the G2 phase. This substance is a target gene of the tumor suppressor p53 protein. It has been reported that downregulation of 14‐3‐3 gamma in several cancers is due to the hypermethylation of this gene.( 57 )
Isoforms. Three hundred and seventy four significant spots were selected, and 211 of these were identified successfully. These spots represented different isoforms of 91 unique proteins. A cluster of GFAP was visible in the upper left region of the 2‐D gels and was more represented in GBM (Fig. 3a,b). A group of serum albumin precursors was detected in the basic region of the gels (Fig. 3c,d). Serum albumins were also more abundant in GBM. These observations were in agreement with those reported previously.( 10 ) In general, the distribution of isoforms obtained in the present study was as follows: GFAP was represented by 37 isoforms, serum albumin by 15, hypothetical protein FLJ45472 by 13, enolase by six, vimentin by five, superoxide dismutase by five, LAP3 by four, hemoglobin by four, ATP synthase by four, creatine kinase by four, aldolase c by three, dihydrolipoyl dehydrogenase by three, glutamate dehydrogenase 1 by three, GAPDH, serotransferrin precursor by three, pyruvate kinase by three, and ubiquinol cytochrome c reductase complex core protein 2 by three isoforms.
There are two general classes of protein changes: abundance and isoform.( 58 ) Abundance changes can be the result of changes in the rate of synthesis or the rate of degradation. Isoform changes may be due to alternative splicing or post‐translational modification. Post‐translational modifications generally alter the pI of proteins. Phosphorylation, myristylation and methylation make proteins more acidic, causing a leftward shift on 2‐D gels. Esterification renders the proteins more basic, causing a rightward shift. Some modifications, such as glycosylation and prenylation, alter the molecular weight of the proteins. Proteolysis can change both the pI and the molecular mass of a protein. In the present study, examples of shifts in protein locations were observed in all possible directions. MS analysis for some proteins, such as GFAP, vimentin and superoxide dismutase, indicated a differential phosphorylation. Larger quantities of these proteins will be required in order to precisely determine the nature of their phosphorylation differences. Some proteins exhibited complex changes. These results show that isoform changes are likely to play a significant role in glioma development.
The functional role of the proteins identified exclusively in the brain tissues throughout this study (Table 2) are known from the biochemical pathways they are integrated in. However, as we learn more about the function and location of proteins, there is a reappraisal in some of their functional aspects. A protein does not have a single function. Indeed, most proteins seem to have several functions (e.g. in transport, regulation of enzyme activity or activation of biological systems), depending on the protein's location and the microenvironmental conditions. For instance, hemoglobin, which was found in the gliomas, not only transports oxygen and carbon dioxide but also plays a role as a potent nitric oxide detoxifier and oxygen scavenger, in addition to regulating blood pH and regional blood flow.( 59 )
Table 2.
List of unique identified proteins that were significantly different in expression
| Protein name† | IPI accession‡ | SwissProt§ | Entrez Protein¶ | Mr(kDa)/pI | Alternate name‡, ‡ |
|---|---|---|---|---|---|
| 14‐3‐3 protein epsilon | IPI00000816.1 | P62258 | gi|51702210 | 29.3/4.63 | |
| 14‐3‐3 protein gamma | IPI00220642.1 | P61981 | gi|48428721 | 28.5/4.79 | |
| 3‐Ketoacyl‐CoA thiolase, mitochondrial | IPI00001539.5 | P42765 | gi|57015371 | 42.5/11.01 | |
| Aconitate hydratase, mitochondrial precursor | IPI00017855.1 | Q99798 | gi|51702210 | 86.1/7.36 | Aconitase |
| Actin, cytoplasmic 1 | IPI00021439.1 | P60709 | gi|46397333 | 42.1/5.29 | |
| ALB protein | IPI00384697.1 | Q86YG0 | – | 48.6/5.97 | |
| Aldolase C, fructose biphosphate (Fragment) | IPI00418262.1 | P09972 | gi|113613 | 43.0/6.44 | Brain‐type aldolase |
| α‐1‐Antichymotrypsin precursor | IPI00032215.3 | P01011 | gi|112874 | 48.9/5.33 | Serpina3 Protein |
| Annexin V | IPI00329801.5 | P08758 | gi|113960′ | 35.8/4.92 | Annexin A5 |
| Annexin VI isoform 2 | IPI00002459.3 | – | gi|71773415 | 75.6/5.59 | |
| Apolipoprotein A‐I precursor | IPI00021841.1 | P02647 | gi|113992 | 30.8/5.55 | Apo‐AI |
| Aspartate aminotransferase, mitochondrial precursor | IPI00018206.1 | P00505 | gi|112983 | 47.8/9.14 | |
| ATP synthase α‐chain, mitochondrial precursor | IPI00440493.1 | P25705 | gi|114517 | 59.9/9.13 | ATPase alpha |
| ATP synthase β‐chain, mitochondrial precursor | IPI00303476.1 | P06576 | gi|114549 | 56.5/5.25 | ATPase beta |
| ATP synthase, H+ transporting, mitochondrial | IPI00220487.1 | O75947‐1 | – | 18.5/5.22 | |
| F0 complex, subunit D isoform A | |||||
| Beta‐globin | IPI00218816.1 | P68871 | gi|56749856 | 16.1/7.32 | |
| Calcyclin‐binding protein, Splice isoform 1 | IPI00395627.2 | Q9HB71 | gi|6576651 | 34.2/8.28 | CacyBP1 |
| Calreticulin precursor | IPI00020599.1 | P27797 | gi|117501 | 48.2/4.29 | |
| Coronin‐1 A | IPI00010133.1 | P31146 | gi|1706004 | 51.7/6.25 | |
| Creatine kinase, B‐chain | IPI00022977.1 | P12277 | gi|125294| | 42.9/5.34 | |
| Crystallin α B chain | IPI00021369.1 | P02511 | gi|117385 | 42.96.76 | |
| Dihydrolipoyl dehydrogenase, mitochondrial precursor | IPI00015911.1 | P09622 | gi|118674 | 54.7/7.59 | |
| Dihydropteridine reductase | IPI00014439.1 | P09417 | gi|118600 | 26.0/6.90 | |
| Dihydropyrimidinase related protein‐2 | IPI00257508.4 | Q16555 | gi|3122051 | 62.7/5.95 | DRP‐2 |
| Enolase 1 | IPI00215736.2 | P06733 | gi|119339 | 47.4/6.99 | |
| Enolase 2 | IPI00216171.1 | P09104 | gi|20981682 | 47.6/4.9 | |
| Ezrin (Fragment) | IPI00216311.5 | P15311 | gi|119717 | 69.3/5.95 | |
| F‐actin capping protein α‐1 subunit | IPI00005969.1 | P52907 | gi|1705650 | 33.1/5.45 | |
| Fascin | IPI00163187.6 | Q16658 | gi|2498357 | 55.7/6.82 | |
| Fatty acid‐binding protein, brain | IPI00215747.2 | O15540 | gi|3122076 | 14.9/5.41 | B‐FABP |
| Fatty acid‐binding protein, epidermal | IPI00007797.1 | Q01469 | gi|232081 | 15.5/6.82 | E‐FABP |
| Fumerate hydratase, mitochondrial precursor | IPI00296053.2 | P07954 | gi|1730117 | 54.8/8.85 | |
| Galectin‐3 (galactose‐specific lectin 3) | IPI00219220.4 | P17931 | gi|126678 | 26.2/8.60 | |
| Gelsolin precursor, plasma | IPI00377087.1 | Q5T0H7 | gi|55960304 | 80.9/5.58 | |
| Glial fibrillary acidic protein, astrocyte | IPI00025363.1 | P14136 | gi|121135 | 49.9/5.41 | |
| Glucose‐regulated protein precursor 78 kDa | IPI00003362.1 | P11021 | gi|14916999 | 72.4/5.06 | GRP 78 |
| Glutamate dehydrogenase 1, mitochondrial precursor | IPI00016801.1 | P00367 | gi|118541 | 61.7/7.66 | |
| Glutathione S‐transferase P | IPI00219757.7 | P09211 | gi|121746 | 24.8/5.44 | GSTP |
| Glutathione synthetase | IPI00010706.1 | P48637 | gi|1346191 | 52.5/5.66 | |
| Glyceraldehyde‐3‐phosphate dehydrogenase, liver | IPI00219018.1 | P04406 | gi|120649 | 36.2/8.58 | GAPDH‐L |
| Guanine nucleotide‐binding protein | IPI00026268.1 | P62873 | gi|51317302 | 38.2/5.6 | GNBP1 |
| G(I)/G(S)/G(T) β subunit 1 | |||||
| Haptoglobin precursor (HP protein) | IPI00019571.3 | P00738 | gi|123508 | 46.9/8.48 | |
| Heat shock 60 kDa protein, mitochondrial precursor | IPI00329351.3 | P10809 | gi|129379 | 61.3/4.58 | HSP60 |
| Heat shock 70 kDa protein 1B | IPI00033946.1 | P08107 | gi|462325 | 70.3/5.48 | HSP70 |
| Heat shock 27 kDa | IPI00025512.2 | P04792 | gi|19855073 | 22.8/5.98 | HSP27 |
| Heterogeneous nuclear ribonucleoprotein A1 isoform A | IPI00376990.3 | P09651 | gi|133254 | 34.2/9.26 | hnRNP A1 |
| Holiday junction DNA helicase ruvB | IPI00021187.1 | Q9Y265 | gi|28201891 | 50.5/6.02 | RuvB‐Like 1 |
| Hypothetical protein FLJ45472 | IPI00443478.1 | Q6ZQS3 | – | 49.5/5.84 | |
| Hypothetical protein FLJ45472 | IPI00443478.1 | Q6ZQS3 | – | 49.5/5.84 | |
| Ig gamma‐2 chain C region | IPI00399007.2 | P01859 | gi|121043 | 36.5/7.96 | |
| Inter‐α‐trypsin inhibitor heavy chain H4 precursor, splice isoform 2 | IPI00218192.1 | Q14624‐2 | gi|13432192 | 101.5/6.51 | ITIH4 |
| Lactate dehydrogenase B | IPI00219217.1 | P07195 | gi|126041 | 36.9/5.72 | LDH‐B |
| Lactoylglutathione lyase | IPI00220766.1 | Q04760 | gi|417246 | 20.9/5.24 | |
| Leucine aminopeptidase | IPI00220067.7 | P28838 | gi|12643394 | 56.5/6.29 | LAP3 protein |
| Moesin | IPI00219365.1 | P26038 | gi|127234 | 67.9/6.09 | |
| Mu‐crystallin homolog | IPI00000949.1 | Q14894 | gi|2498259 | 33.9/5.06 | |
| NADH‐ubiquinone oxidoreductase 24 kDa subunit, mitochondrial precursor | IPI00291328.3 | P19404 | gi|20455499 | 27.7/8.22 | NADH‐UO 24 |
| NADH‐ubiquinone oxidoreductase 75 kDa subunit, mitochondrial precursor | IPI00178677.3 | P28331 | gi|47117839 | 80.5/5.89 | NADH‐UO 75 |
| Neurofilament triplet L protein | IPI00237671.1 | P07196 | gi|62511894 | 61.5/4.63 | NF‐L |
| NG,NG‐dimethylarginine dimethylaminohydrolase 1 | IPI00220342.1 | O94760 | gi|6831528 | 31.4/5.52 | DDAHI |
| Peroxiredoxin 4 | IPI00011937.1 | Q13162 | gi|3024727| | 30.7/5.86 | Prx‐4 |
| Peroxiredoxin 6 | IPI00220301.1 | P30041 | gi|1718024 | 25.1/5.99 | Prx‐6 |
| Phosphoglycerate kinase 1 | IPI00169383.1 | P00558 | gi|52788229 | 44.9/8.30 | |
| Phosphoglycerate mutase 1, brain | IPI00385244.2 | Q6P6D7 | gi|130348 | 28.8/6.75 | |
| Phosphoprotein‐enriched astrocytes 15 | IPI00014850.2 | Q15121 | Q15121 | 15.1/4.92 | PEA‐15 |
| Proliferation‐associated protein 2G4 | IPI00299000.1 | Q9UQ80 | gi|13632817| | 44.1/6.12 | PAP2G4 |
| Protein‐l‐isoaspartate (d‐aspartate) O‐methyltransferase, splice isoform 2 | IPI00024989.4 | P22061‐2 | gi|2507187 | 27.6/6.78 | PIMT |
| Pyruvate kinase, isozymes M1/M2 | IPI00220644.5 | P14618‐2 | gi|20178296 | 58.8/7.6 | RUVB‐LIKE 1 |
| Pyruvate kinase, isozymes M1/M2, splice isoform M1 | IPI00220644.5 | P14618 | gi|20178296| | 58.7/7.95 | PK M1/M2 |
| RNA binding protein regulatory subunit oncogene | IPI00298547.1 | Q99497 | gi|56404943 | 20.1/6.33 | DJ‐1 protein |
| Septin 2 | IPI00014177.1 | Q15019 | gi|2500769 | 41.7/6.14 | |
| Septin 11 | IPI00019376.1 | Q9NVA2 | gi|50401687 | 49.7/6.38 | |
| Serotransferrin precursor | IPI00022463.1 | P02787 | gi|136191 | 79.3/6.81 | Transferrin |
| Serum albumin precursor | IPI00022434.1 | P02768 | gi|113576 | 71.3/5.92 | |
| SH3 domain‐binding glutamic acid‐rich‐like protein 3 | IPI00010402.1 | Q9H299 | gi|24638222 | 10.5/4.82 | SH3 BP‐1 |
| Stathmin | IPI00240029.5 | P16949 | gi|134973 | 17.2/5.77 | |
| Succinyl‐CoA : 3‐ketoacid CoA‐transeferase 1, mitochondrial precursor | IPI00026516.1 | P55809 | gi|2492998 | 56.6/7.13 | Scot‐S |
| Superoxide dismutase [Cu‐Zn] | IPI00218733.1 | P00441 | gi|134611 | 16.2/5.70 | SOD‐ZN |
| Superoxide dismutase [Mn], mitochondrial precursor | IPI00022314.1 | P04179 | gi|134665 | 24.9/8.35 | SOD‐Mn |
| Synuclein β | IPI00399236.2 | Q16143 | gi|2501105 | 28.3/11.86 | |
| Thioredoxin‐dependent peroxide reductase, mitochondrial precursor | IPI00024919.1 | P30048 | gi|2507171 | 28.0/7.68 | Peroxiredoxin 3 |
| Transgelin | IPI00216138.3 | Q01995 | gi|3123283 | 22.5/8.88 | 22 kDa actin‐ binding protein |
| Transgelin 2 | IPI00024057.1 | P37802 | gi|586000 | 22.5/8.45 | |
| Triosephosphate isomerase | IPI00328807.3 | P60174 | gi|39932641 | 26.8/6.51 | TIM |
| Tubulin β | IPI00013475.1 | Q13885 | gi|74762137 | 50.3/4.77 | |
| Tubulin β‐2C chain | IPI00007752.1 | P68371 | gi|55977480 | 50.3/4.79 | |
| Ubiquinol‐cytochrome‐c reductase complex core protein 2, mitochondrial precursor | IPI00305383.1 | P22695 | gi|21903482 | 48.6/8.73 | UQCRC2 |
| Ubiquitin carboxyl‐terminal hydrolase isozyme L1 | IPI00018352.1 | P09936 | gi|136681 | 25.2/5.33 | UCH‐L1 |
| Vacuolar ATP synthase subunit E | IPI00003856.1 | P36543 | gi|549207 | 26.2/7.70 | V‐ATPase E subunit |
| Vimentin | IPI00418471.1 | P08670 | gi|55977767 | 53.6/5.06 | |
| Voltage‐dependent anion‐selective channel protein 1 | IPI00216308.1 | P21796 | gi|130683 | 30.9/8.63 | VDAC1 |
Protein name and
accession number as in the International Protein Index at http://www.ebi.ac.uk/IPI/.
Accession number as in SwissProt at http://c.expasy.org/.
Accession number as in Entrez Protein at http://www.ncbi.nlm.nih.gov/entrez/query.fcgi?db=Protein.
Gene map locus at http://www.ncbi.nlm.nih.gov/entrez/query.fcgi?db=OMIM.
Discussion
In cancer research, detection of a biomarker refers to a substance or process that is indicative of the presence of cancer in the body.( 60 ) Despite the many technological advances, extremely few reliable tumor markers have been described for malignant brain tumors. The reasons for this are numerous, including the relative low incidence of malignant gliomas in the population, the lethality of most malignant gliomas, the difficulty in obtaining tissue samples to screen for potential tumor markers, and the limitations imposed by the blood–brain barrier to obtain serum samples of any potential tumor marker.( 61 ) The development of high‐throughput systems to assess proteins has enhanced the importance of biomarkers and made it possible to assess a broad profile of proteins to detect patterns or signatures of biological states of a disease. However, it is not easy to find one single protein that serves as a tumor‐specific surrogate biomarker.( 62 ) As a result, groups of biomarkers are being measured and followed in order to detect a ‘pattern’ of physiological events that reflect the growth of a malignancy and the response of the host. Changes in the expression levels of a group of several proteins may serve as a more suitable indicator of the presence or progression of a disease than a change in the level of a single protein.( 62 ) Once biomarkers are identified, diagnostic tests can be designed utilizing antibodies raised against these specific targets. This is done by protein expression profiling of clinical specimens obtained from diseased as well as normal individuals.( 63 )
The aim of the current study was to identify differentially expressed proteins of human brain cancer as well as to deepen our understanding of the differences between human brain gliomas at the protein levels. Therefore, in a study of this kind, large sample numbers are needed to cover the complex nature of brain cancer and the potential heterogeneity between samples. Fifty brain tissues were separated using 20 × 24 cm 2‐D gels in duplicate following the dye reversal approach together with an internal pool sample on each gel. To the best of our knowledge, this is one of the largest proteomic studies carried out on human brain cancer. Considering that the crucial factor for gel‐based comparative proteome analysis is reproducibility, a novel fluorescence‐based multiplexing technique (DIGE) was applied for protein labeling in 2‐D gels for protein separation, detection and determination of differences in the protein profiles. The images were cropped, and spot detection and alignment were carried out using Decyder software. The preliminary analysis to assess sample variation was carried out using 2500 as an estimated spot number per gel. Subsequently, the spot matching was corrected visually until most gels showed a reasonably high degree of accordance.
Two‐dimension gel electrophoresis has been used extensively for the separation of complex protein mixtures since it was first introduced in 1975.( 64 ) Unfortunately, due to variations between gels and images, these are rarely directly superimposable and warping is required to overlay and compare them. Furthermore, one protein may be represented in multiple spots, such as the unmodified and post‐translationally modified forms of the same protein. A fundamental improvement in 2‐D PAGE technology took place with the development of 2‐D DIGE.( 65 ) This technique enabled various samples to be run on the same gel by prelabeling the samples with covalent fluorophores (Fig. S4). The labeling conditions ensured that less than 5% of molecules for each protein were labeled. A pair of samples is mixed in addition to an internal standard pool and then subjected to 2‐D separation. Peptide mass mapping using MALDI‐TOF MS to provide accurate mass determination of peptide molecular ions (M + H, <20 p.p.m. mass error) from individual trypsin digests is an extremely powerful approach to protein identification that often leads to statistically significant, unambiguous matches without the need for additional amino acid sequence information from MS/MS.( 66 )
DNA microarray technology is a relatively new method for analyzing gene expression and it has been used recently in brain cancer research.( 67 ) With DNA microarray technology it is possible to map genes that are up‐ or downregulated in tissues or cells involved in brain cancer disease, something that might contribute to the identification of new pathological mechanisms or therapeutic targets. However, all regulatory mechanisms are not operated at the transcriptional level. Hence, one of the disadvantages of DNA microarray technology is that the detected mRNA levels do not always correlate with the actual protein levels in the sample. Two‐dimensional electrophoresis, together with MS analysis, is a powerful method to profile protein expression in different samples.
Furuta and coworkers isolated and sequenced 11 proteins expressed exclusively in one of the two types of GBM.( 33 ) Five of these proteins (tenascin‐X precursor, enolase 1, centrosome‐associated protein 350, EGFR, and a previously unnamed protein) were expressed only by primary GBM. In the primary GBM, one protein, EGFR, was identified by 2‐DGE and confirmed by immunohistochemistry and western blotting. This highlights the central role played by the EGFR–Ras–MAPK pathway in the genesis of these tumors. In a recent study,( 10 ) the protein pattern of low‐grade fibrillary astrocytomas was compared to that of GBM by 2‐D electrophoresis. Among the proteins more highly expressed in GBM, they found peroxiredoxin 1 and 6, the transcription factor BTF3, and α‐B‐crystallin, whereas protein disulfide isomerase A3, the catalytic subunit of the cAMP‐dependent protein kinase, and the glial fibrillary acidic protein were increased in low‐grade astrocytomas.
In summary, evidence has been provided that use of the recently developed 2‐D DIGE technique combined with MS (MALDI‐TOF and LC‐MS/MS methods) may enable a proteome‐wide analysis of proteins expressed in normal and cancerous tissues. The emerging data is expected to provide valuable information regarding the still unknown molecular mechanisms promoting the malignant conversion of normal brain cells. Furthermore, it may be an aid in the identification of biomarkers of disease development and progression, and novel therapeutic targets for brain cancer. Based on these mapping data, future investigations will focus on the biological meaning of the identified proteins as valuable markers for diagnosis and prognosis, or even therapeutic approaches.
Conclusion
The present study describes the most extensive effort, published to date, characterizing the brain cancer proteome. To this day, 2‐D‐based methods have been most successful in identifying individual disease‐specific protein biomarkers. We have used a 2‐D DIGE technology to simultaneously screen paired brain cancers and normal brain tissues for changes in protein abundance, followed by protein identification by MS and database interrogation. Approximately 211 distinct protein spots, associated with 91 unique proteins, were identified throughout this study. Due to isoforms and protein modifications such as glycosylation and phosphorylation, the number of proteins was lower than the number of protein spots. Approximately 20 of these 91 unique proteins have not, to our knowledge, been reported previously as differentially expressed in glioma. They thus provide novel information on the differences existing between normal brain cells and astrocytomas. Several of the novel proteins that were identified are currently under validation as brain cancer biomarkers through immunoblotting and immunohistochemical analysis. Once validated, characterization of the function and biology of the specific proteins may permit their use as diagnostic and prognostic markers as well as therapeutic targets in predicting responses to therapy, and in identifying new molecular targets for therapy. We also hope to provide comprehensive maps of brain proteomes, that should prove to be useful reference databases for the study of changes in protein expression levels associated with the varying stages of gliomas as well as with neurodegenerative disorders.
Supporting information
Fig. S1.
Fig. S2.
Fig. S3.
Fig. S4.
Table S1. Forward and reverse fluorescent labeling (DIGE) of brain tissue samples
Table S2. Full list of identified proteins that are significantly different in expression
Table S3. Grade‐wise expression patterns for differentially expressed proteins between GBM and not tumor
Please note: Blackwell Publishing are not responsible for the content or functionality of any supplementary materials supplied by the authors. Any queries (other than missing material) should be directed to the corresponding author for the article.
Supporting info item
Supporting info item
Supporting info item
Supporting info item
Supporting info item
Supporting info item
Supporting info item
Supporting info item
Supporting info item
Acknowledgments
A. A. Khalil was supported by an EMBO World Fellowship Program as well as the Rausing Foundation. WE gratefully acknowledge Protein Tech Department for providing laboratory space and instrumentation and Dr M. Kroch for statistical assistance. Special thanks for The Royal Physiographic Society in Lund, Swedish Society for Children Cancer, Wenner‐Gren Foundation, and Gunnar Nilsson Foundation.
References
- 1. Hanahan D, Weinberg RA. The hallmark of cancer. Cell 2000; 100: 57 – 70. [DOI] [PubMed] [Google Scholar]
- 2. Preston‐Martin S, Mack WJ. Neoplasms of the nervous system. In: Schottenfeld D, Fraumeni JF, eds. Cancer Epidemiology and Prevention, 2nd edn. New York: Oxford University Press, 1996; 1231 – 81. [Google Scholar]
- 3. Kleihues P, Louis DN, Scheithauer BW et al. The WHO classification of tumors of the nervous system. J Neuropathol Exp Neurol 2002; 61: 215 – 25. [DOI] [PubMed] [Google Scholar]
- 4. Shaw EG, Arussel R, Scheithauer BW. Low‐grade hemispheric astrocytomas. In: Black PM, Loeffle JS, eds. Cancer of the Nervous System. Massachusetts: Blackwell Science, 1997; 441 – 63. [Google Scholar]
- 5. Kleihues P, Burger PC, Scheithauer BW. The new WHO classification of brain tumors. Brain Pathol 1993; 3: 255 – 68. [DOI] [PubMed] [Google Scholar]
- 6. Di Sapio A, Morra I, Pradatto L, Guido M, Schiffer D, Mauro A. Molecular genetic changes in a series of neuroepithelial tumors of childhood. J Neuro-Oncol 2002; 59: 117 – 22. [DOI] [PubMed] [Google Scholar]
- 7. Lacroix M, Abi‐Said D, Fourney DR et al. A multivariate analysis of 416 patients with glioblastoma multiforme: prognosis, extent of resection, and survival. J Neurosurg 2001; 95: 190 – 8. [DOI] [PubMed] [Google Scholar]
- 8. Kapoor GS, O’Rourke DM. Mitogenic signaling cascades in glial tumors. Neurosurg 2003; 52: 1425 – 34. [DOI] [PubMed] [Google Scholar]
- 9. Stark AM, Nabavi A, Mehdorn HM, Blomer U. Glioblastoma multiforme − report of 267 cases treated at a single institution. Surg Neurol 2005; 63: 162 – 9. [DOI] [PubMed] [Google Scholar]
- 10. Odreman F, Vindigni M, Gonzales ML et al. Proteomic studies on low‐ and high‐grade human brain astrocytomas. J Proteome Res 2005; 4: 698 – 708. [DOI] [PubMed] [Google Scholar]
- 11. Hu Y, Huang X, Chen GYJ, Yao SQ. Recent advances in gel‐based proteome profiling techniques. Mol Biotech 2004; 28: 63 – 76. [DOI] [PubMed] [Google Scholar]
- 12. Hu Y, Wang G, Chen GYJ, Fu X, Yao SQ. Proteome analysis of Saccharomyces cerevisiae under metal stress by two‐dimensional differential gel electrophoresis. Electrophoresis 2003; 24: 1458 – 70. [DOI] [PubMed] [Google Scholar]
- 13. Petricoin EF, Zoon KC, Kohn EC, Barrett JC, Liotta LA. Clinical proteomics: translating bench side promise into bedside reality. Nat Rev Drung Discov 2002; 1: 683 – 95. [DOI] [PubMed] [Google Scholar]
- 14. Zhang R, Tremblay TL, Mcdermid A, Thibault P, Stanimirovic D. Identification of differentially expressed proteins in human glioblastoma cell lines and tumors. GLIA 2003; 42: 194 – 208. [DOI] [PubMed] [Google Scholar]
- 15. Iwadate Y, Sakaida T, Hiwasa T et al. Molecular classification and survival prediction in human gliomas based on proteome analysis. Cancer Res 2004; 64: 2496 – 501. [DOI] [PubMed] [Google Scholar]
- 16. Chumbalkar VC, Subhashini C, Dhople VM et al. Differential protein expression in human gliomas and molecular insights. Proteomics 2005; 5: 1167 – 77. [DOI] [PubMed] [Google Scholar]
- 17. Lowry OH, Rosebrough NJ, Farr AL, Randall RJ. Protein measurement with the folin phenol reagent. J Biol Chem 1951; 193: 265 – 75. [PubMed] [Google Scholar]
- 18. Alban A, David SO, Bjorkesten L et al. A novel experimental design for comparative two‐dimensional gel analysis: two‐dimensional difference gel electrophoresis incorporating a pooled internal standard. Proteomics 2003; 3: 36 – 44. [DOI] [PubMed] [Google Scholar]
- 19. Rabilloud T, Valette C, Lawrence JJ. Sample application by in‐gel rehydration improves the resolution of two‐dimensional electrophoresis with immobilized pH gradients in the first dimension. Electrophoresis 1994; 15: 1552 – 8. [DOI] [PubMed] [Google Scholar]
- 20. Lamanda A, Zahn A, Röder D, Langen H. Improved Ruthenium II tris (bathophenantroline disulfonate) staining and destaining protocol for a better signal‐to‐background ratio and improved baseline resolution. Proteomics 2004; 4: 599 – 608. [DOI] [PubMed] [Google Scholar]
- 21. Samuelsson J, Dalevi D, Levander F, Rognvaldsson T. Modular, scriptable and automated analysis tools for high‐throughput peptide mass fingerprinting. Bioinformatics 2004; 20: 3628 – 35. [DOI] [PubMed] [Google Scholar]
- 22. Perkins DN, Pappin DJC, Creasy DM, Cottrell JS. Probability‐based protein identification by searching sequence databases using mass spectrometry data. Electrophoresis 1999; 20: 3551 – 67. [DOI] [PubMed] [Google Scholar]
- 23. Mori Y, Kondo T, Yamada T, Tsuchida A, Aoki T, Hirohashi S. Two‐dimensional electrophoresis database of fluorescence‐labeled proteins of colon cancer cells. J Chromato B 2005; 823: 82 – 97. [DOI] [PubMed] [Google Scholar]
- 24. Wu SL, Amato H, Biringer R, Choudhary G, Shieh D, Hancock WS. Targeted proteomics of low‐level proteins in human plasma by LC/MS: using human growth hormone as a model system. J Proteome Res 2002; 1: 459 – 65. [DOI] [PubMed] [Google Scholar]
- 25. Baker H, Patel V, Molinolo AA et al. Proteome‐wide analysis of head and neck squamous cell carcinomas using laser‐capture microdissection and tandem mass spectrometry. Oral Oncol 2005; 41: 183 – 99. [DOI] [PubMed] [Google Scholar]
- 26. Markus K, Schmidt O, Schaefer H, Hamacher M, Hall A, Meyer HE. Proteomics − Application to the brain. Int Rev Neurbiol 2004; 61: 287 – 311. [DOI] [PubMed] [Google Scholar]
- 27. Langen HP, Berndt P, Roder D, Cairns N, Lubec G, Fountoulakis M. Two‐dimensional map of human brain proteins. Electrophoresis 1999; 20: 907 – 16. [DOI] [PubMed] [Google Scholar]
- 28. Tsuji T, Shimohama S. Analysis of the proteomic profiling of brain tissue in Alzheimer's diseases. Dis Markers 2001; 17: 247 – 57. [DOI] [PMC free article] [PubMed] [Google Scholar]
- 29. Narayan RK, Heydorn WE, Greed GJ, Jacobwitz DM. Protein patterns in various malignant human brain tumors by two‐dimensional gel electrophoresis. Cancer Res 1986; 46: 4685 – 94. [PubMed] [Google Scholar]
- 30. Muller A, Henn W, Unteregger G. Nuclear and DNA‐binding proteins in human brain tumors. Electrophoresis 1991; 12: 515 – 23. [DOI] [PubMed] [Google Scholar]
- 31. Wimmer K, Kuick R, Thorval D, Hanash SM. Two‐dimensional separations of the genome and proteome of neuroblastoma cells. Electrophoresis 1996; 17: 1741 – 51. [DOI] [PubMed] [Google Scholar]
- 32. Honda C, Tabuchi K, Nishimoto A. Analysis of the water‐soluble protein fraction of glioma cells by two‐dimensional electrophoresis. Neurol Med Chir (Tokyo) 1989; 29: 465 – 70. [DOI] [PubMed] [Google Scholar]
- 33. Furuta M, Weil RJ, Vortmeyer AO et al. Protein patterns and proteins that identify subtypes of glioblastoma multiforme. Oncogene 2004; 23: 6806 – 14. [DOI] [PubMed] [Google Scholar]
- 34. Hiratsuka T, Mukae H, Iiboshi H et al. Increased concentrations of human β‐defensins in plasma and bronchoalveolar lavage fluid of patients with diffuse panbronchiolitis. Thorax 2003; 58: 425 – 30. [DOI] [PMC free article] [PubMed] [Google Scholar]
- 35. Vogel TW, Zhuang Z, Li J et al. Proteins and protein pattern differences between glioma cell lines and glioblastoma multiforme. Clin Cancer Res 2005; 11: 3624 – 32. [DOI] [PubMed] [Google Scholar]
- 36. Myung JK, Krapfenbauer K, Weitzdoerfer R, Peyrl A, Fountoulakis M, Lubec G. Expressional pattern of chaperones in neuronal, glial, amnion, mesothelial, and bronchial epithelial cell lines. Molec Genet Metab 2003; 80: 444 – 50. [DOI] [PubMed] [Google Scholar]
- 37. Porchet R, Probst A, Bouras C, Dráberova E, Dráber P, Riederer BM. Analysis of glial acidic fibrillary protein in the human entorhinal cortex during aging and in Alzheimer's disease. Proteomics 2003; 3: 1476 – 85. [DOI] [PubMed] [Google Scholar]
- 38. Korolainen MA, Auriola S, Nyman TA, Alafuzoff I, Pirttilä T. Proteomic analysis of glial fibrillary acidic protein in Alzheimer's disease and aging brain. Neurobiol Dis 2005; 20: 858 – 70. [DOI] [PubMed] [Google Scholar]
- 39. Greber S, Lubec G, Cairns N, Fountoulakis M. Decreased levels of synaptosomal associated protein 25 in the brain of patients with Down syndrome and Alzheimer's disease. Electrophoresis 1999; 20: 928 – 34. [DOI] [PubMed] [Google Scholar]
- 40. Elobeid A, Bongcam‐Rudloff E, Westermark B, Nister M. Effects of inducible glial fibrillary acidic protein on glioma cell motility and proliferation. J Neurosci Res 2000; 60: 245 – 56. [DOI] [PubMed] [Google Scholar]
- 41. Umahara T, Uchihara T, Tsuchiya K et al. 14‐3‐3 proteins and zeta isoform containing neurofibrillary tangles in patients with Alzheimer's disease. Acta Neuropathol (Berl) 2004; 108: 279 – 86. [DOI] [PubMed] [Google Scholar]
- 42. Castellani RJ, Colucci M, Xie Z et al. Sensitivity of 14‐3‐3 protein test varies in subtypes of sporadic Creutzfeldt–Jakob disease. Neurology 2004; 63: 436 – 42. [DOI] [PubMed] [Google Scholar]
- 43. Brown AM, Gordon D, Lee H et al. Association of the dihydrolipoamide dehydrogenase gene with Alzheimer's disease in an Ashkenazi Jewish population. Am J Med Genet B Neuropsych Genet 2004; 13: 60 – 6. [DOI] [PubMed] [Google Scholar]
- 44. Cecchi C, Latorraca S, Sorbi S et al. Glutathione level is altered in lymphoblasts from patients with familial Alzheimer's disease. Neurosci Lett 1999; 275: 152 – 4. [DOI] [PubMed] [Google Scholar]
- 45. Yoo BC, Fountoulakis M, Cairns N, Lubec G. Changes of voltage‐dependent anion‐selective channel proteins VDAC1 and VDAC2 brain levels in patients with Alzheimer's disease and Down syndrome. Electrophoresis 2001; 22: 172 – 9. [DOI] [PubMed] [Google Scholar]
- 46. Salvatore M, Seeber AC, Nacmias B, Petraroli R, Sorbi S, Pocchiari M. Alpha1 antichymotrypsin signal peptide polymorphism in sporadic Creutzfeldt–Jakob disease. Neurosci Lett 1997; 227: 140 – 2. [DOI] [PubMed] [Google Scholar]
- 47. Lin JJ, Yueh KC, Chang CY, Chen CH, Lin SZ. The homozygote AA genotype of the alpha1‐antichymotrypsin gene may confer protection against early‐onset Parkinson's disease in women. Parkinsonism Rel Disord 2004; 10: 469 – 73. [DOI] [PubMed] [Google Scholar]
- 48. Naze P, Vuillaume I, Destee A, Pasquier F, Sablonniere B. Mutation analysis and association studies of the ubiquitin carboxy‐terminal hydrolase L1 gene in Huntington's disease. Neurosci Lett 2002; 328: 1 – 4. [DOI] [PubMed] [Google Scholar]
- 49. Huai Q, Sun Y, Wang H et al. Crystal structure of DJ‐1/RS and implication on familial Parkinson's disease. FEBS Lett 2003; 549: 171 – 5. [DOI] [PubMed] [Google Scholar]
- 50. Ardley HC, Scott GB, Rose SA, Tan NG, Robinson PA. UCH‐L1 aggresome formation in response to proteasome impairment indicates a role in inclusion formation in Parkinson's disease. J Neurochem 2004; 90: 379 – 91. [DOI] [PubMed] [Google Scholar]
- 51. Swatton JE, Prabakaran S, Karp NA, Lilly KS, Bahn S. Protein profiling of human postmortem brain using 2‐dimensional fluorescence difference gel electrophoresis (2‐D DIGE). Mol Psychiatry 2004; 9: 128 – 43. [DOI] [PubMed] [Google Scholar]
- 52. Johnston‐Wilson NL, Sims CD, Hofmann JP et al. Disease‐specific alterations in frontal cortex brain proteins in schizophrenia, bipolar disorder, and major depressive disorder. Molec Psych 2000; 5: 142 – 9. [DOI] [PubMed] [Google Scholar]
- 53. Castegna A, Aksenov M, Thongboonkerd V et al. Butterfield, proteomic identification of oxidatively modified proteins in Alzheimer's disease brain: Part II. Dihydropyrimidinase‐related protein II, α‐enolase and heat shock cognate 71. J Neurochem 2002; 82: 1524 – 32. [DOI] [PubMed] [Google Scholar]
- 54. Neumann M, Muller V, Gorner K, Kretzschmar HA, Haass C, Kahle PJ. Pathological properties of the Parkinson's disease‐associated protein DJ‐1 in α‐synucleinopathies and tauopathies: relevance for multiple system atrophy and Pick's disease. Acta Neuropathol 2004; 107: 489 – 96. [DOI] [PubMed] [Google Scholar]
- 55. Mori N, Morii H. SCG10‐related neuronal growth‐associated proteins in neuronal development, plasticity, degeneration, and aging. J Neurosci Res 2002; 70: 264 – 73. [DOI] [PubMed] [Google Scholar]
- 56. Lubec G, Nonaka M, Krapfenbauer K, Gratzer M, Cairns N, Fountoulakis M. Expression of the dihydropyrimidinase related protein 2 (DRP‐2) in Down syndrome and Alzheimer's disease brain is downregulated at the mRNA and dysregulated at the protein level. J Neural Transm Suppl 1999; 57: 161 – 77. [DOI] [PubMed] [Google Scholar]
- 57. Yafee MB. How do 14‐3‐3 proteins work? Gatekeeper phosphorylation and the molecular anvil hypothesis. FEBS Lett 2002; 513: 53 – 7. [DOI] [PubMed] [Google Scholar]
- 58. Gong L, Puri M, Ünlü M et al. Drosophila ventral furrow morphogenesis: a proteomic analysis. Development 2004; 131: 643 – 56. [DOI] [PubMed] [Google Scholar]
- 59. Imai K. The haemoglobin enzyme. Nature 1999; 401: 437 – 9. [DOI] [PubMed] [Google Scholar]
- 60. Wagner PD, Verma M, Srivastava S. Challenges for biomarkers in cancer detection. Ann NY Acad Sci 2004; 1022: 9 – 16. [DOI] [PubMed] [Google Scholar]
- 61. Sampath P, Weaver CE, Sungarian A, Cortez S, Alderson L, Stopa EG. Cerebrospinal fluid (vascular endothelial growth factor) and serologic (recoverin) tumor markers for malignant glioma. Cancer Control 2004; 11: 174 – 80. [DOI] [PubMed] [Google Scholar]
- 62. Stroncek DF, Burns C, Martin BM, Rossi L, Marincola FM, Panelli MC. Advancing cancer biotherapy with proteomics. J Immunother 2005; 28: 183 – 92. [DOI] [PubMed] [Google Scholar]
- 63. Ray AJ, Chan DW. Cancer proteomics: serum diagnostics for tumor marker discovery. Ann NY Acad Sci 2004; 1022: 286 – 94. [DOI] [PubMed] [Google Scholar]
- 64. O’Farrell PH. High‐resolution two‐dimensional electrophoresis of proteins. J Biol Chem 1975; 250: 4007 – 21. [PMC free article] [PubMed] [Google Scholar]
- 65. Ünlü M, Morgan MA, Minden JS. Difference gel electrophoresis: a single gel method for detecting changes in protein extracts. Electrophoresis 1997; 18: 2071 – 7. [DOI] [PubMed] [Google Scholar]
- 66. Friedman DB, Hill S, Keller JW et al. Proteome analysis of human colon cancer by two‐dimensional difference gel electrophoresis and mass spectrometry. Proteomics 2004; 4: 793 – 811. [DOI] [PubMed] [Google Scholar]
- 67. Mischel PS, Cloughesy TF, Nelson SF. DNA‐microarray analysis of brain cancer: molecular classification for therapy. Nature Rev Neurosci 2004; 5: 782 – 92. [DOI] [PubMed] [Google Scholar]
Associated Data
This section collects any data citations, data availability statements, or supplementary materials included in this article.
Supplementary Materials
Fig. S1.
Fig. S2.
Fig. S3.
Fig. S4.
Table S1. Forward and reverse fluorescent labeling (DIGE) of brain tissue samples
Table S2. Full list of identified proteins that are significantly different in expression
Table S3. Grade‐wise expression patterns for differentially expressed proteins between GBM and not tumor
Please note: Blackwell Publishing are not responsible for the content or functionality of any supplementary materials supplied by the authors. Any queries (other than missing material) should be directed to the corresponding author for the article.
Supporting info item
Supporting info item
Supporting info item
Supporting info item
Supporting info item
Supporting info item
Supporting info item
Supporting info item
Supporting info item