

Abstract
Hypermethylation of CpG island loci within gene promoter regions is a frequent event in colorectal cancer that is often associated with transcriptional silencing and has been referred to as CIMP+. DNA hypomethylation can occur in concert with CIMP+, although these two phenomena appear not to be related in colorectal cancer. The authors investigated here whether the methylation level of LINE‐1 repeats, a surrogate marker for genomic methylation, was associated with the level of CpG island methylation in colorectal cancers and in matching normal colonic mucosa from 178 patients. The MethyLight assay was used to quantitate the methylation of CpG islands within the MLH1, P16(INK4A), TIMP3, DAPK, APC, ER and MYOD genes. A real‐time, methylation‐specific polymerase chain reaction assay was also used to quantitate the methylation of LINE‐1 repeats. In colorectal cancer, no associations were seen between methylation levels in LINE‐1 repeats and CpG island loci, including a new CpG island panel that was recently proposed for CIMP+. In normal colonic mucosa, however, the methylation level of LINE‐1 repeats was inversely correlated with CpG‐island methylation of the MLH1, P16, TIMP3, APC, ER and MYOD genes. The methylation level of LINE‐1 repeats in normal colonic mucosa also showed significant associations with common polymorphisms in the methylene tetrahydrofolate reductase and methylene tetrahydrofolate dehydrogenase genes involved in methyl group metabolism. Further investigation of genomic and CpG island methylation in normal colonic mucosa and the possible influences of environmental and genetic factors may provide new insights into the development of CIMP+ colorectal cancer. (Cancer Sci 2007; 98: 1454–1460)
Abbreviations:
- CIMP+
CpG island methylator phenotype
- CRC
colorectal cancer
- DNMT3B
DNA methyl transferase
- MS
methionine synthase
- MSI
microsatellite instability
- MTHFD1
methylene tetrahydrofolate dehydrogenase
- MTHFR
methylene tetrahydrofolate reductase
- PCR
polymerase chain reaction
- PCR‐F‐SSCP
PCR and fluorescent single strand conformation polymorphism analysis
- PMR
percentage of methylated reference
- SNP
single‐nucleotide polymorphism
- TILS
tumor‐infiltrating lymphocytes
- TS
thymidylate synthase
Genomic hypomethylation and CpG island hypermethylation are common events in CRC.( 1 , 2 ) The former has been postulated to contribute to tumorigenesis by activating the expression of proto‐oncogenes and favoring the development of chromosomal instability.( 3 , 4 , 5 ) In contrast, regional hypermethylation of CpG islands in gene promoter regions is often associated with transcriptional silencing.( 1 , 6 ) A small subgroup of CRC show concurrent hypermethylation of a large number of CpG islands and this has been termed CIMP, for CpG island methylator phenotype.( 7 ) CIMP+ tumors have subsequently been shown to have characteristic phenotypic features including frequent location in the proximal colon, infiltrating lymphocytes and BRAF mutation.( 8 , 9 , 10 ) These features occur independently of the closely related MSI+ phenotype;( 10 ) however, their association with CIMP+ depends upon the CpG islands used to define this phenotype.( 11 , 12 ) There is increasing evidence to suggest that CIMP+ tumors arise from premalignant precursors termed sessile serrated adenomas.( 13 )
Contrary to expectation, the two phenomena of genomic hypomethylation and CpG island hypermethylation show no relationship in CRC,( 14 , 15 , 16 ) ovarian cancer,( 17 ) or Wilm's tumor,( 18 ) and have therefore been postulated to play different roles in carcinogenesis. The molecular mechanisms responsible for these altered epigenetic states in CRC are unknown. No specific pathological features have been associated with the extent of global methylation in CRC,( 14 ) although lower global methylation levels have been reported in MSI– tumors,( 5 ) and in tumors from male patients,( 15 ) and older patients.( 16 ) Factors associated with CpG island methylation in CRC include sex, age and tumor site,( 8 , 9 , 10 ) dietary folate intake,( 19 ) tumor folate levels,( 20 ) and a polymorphism in methionine synthase.( 21 )
The levels of genomic and CpG island methylation in normal colonic mucosa have received much less attention than CRC. Advancing age, but not sex or site of tissue origin, has been associated with hypomethylation in colonic mucosa.( 14 ) The colonic mucosa from CRC patients has also been reported to show lower global methylation levels compared with control individuals.( 22 ) The same group later showed that supplementation with folic acid increased the global methylation level in the colonic mucosa of patients with adenoma.( 23 ) CpG island methylation of the estrogen receptor,( 24 ) and MLH1 ( 25 ) genes in normal colonic mucosa was shown to increase with age. Recent work by the authors’ group confirmed that ER and MLH1 methylation increased with advancing age, but also found this to be a more widespread phenomenon.( 26 ) Sex and a polymorphism in the DNMT3B gene have also been shown to influence CpG island methylation in normal colonic mucosa. Unlike CRC, there have so far been no reports on the relationship, if any, between genomic and CpG island methylation in normal colonic mucosa.
In the present study, the methylation level of LINE‐1 repetitive elements were measured in a large series of unselected CRC and their matching normal colonic mucosa. These samples have previously been characterized for CpG island methylation, the concentrations of folate intermediates and common polymorphisms in methyl group metabolism genes.( 12 , 20 , 26 ) The authors have now also used a new CpG island marker panel( 11 ) to classify the CRC samples as CIMP+. Methylation of LINE‐1 repetitive elements provided a surrogate marker for global methylation,( 27 ) and was quantitatively analyzed using real‐time methylation‐specific PCR.
Materials and Methods
Tissue samples. Tumor samples were obtained from a consecutive series of 205 CRC patients undergoing elective surgery at the Colorectal Unit of the Royal Adelaide Hospital, Australia. Corresponding normal colonic mucosa was available for 178 of these patients. Samples of normal mucosa were taken as far away as possible from the tumor site and were morphologically normal in sections used to evaluate the status of that margin in routine histology. The normal sample was usually the distal resection margin for proximal colon cancers or the proximal resection margin for left colon and rectal cancers. The mucosal layer from the normal tissue sample was manually scraped and collected into a tube. All samples were snap‐frozen in liquid nitrogen within 20–40 min after resection and stored at –70°C prior to DNA extraction. The clinical and pathological features of this tumor series have been described previously.( 20 , 26 ) The concentrations of intracellular folate intermediates CH2FH4 and FH4 were measured as reported earlier using a competitive binding assay with recombinant thymidylate synthase (gift from Taiho Pharmaceuticals, Tokyo, Japan) and [3H]fluoro‐dUMP to form a ternary complex with cytosolic CH2FH4.( 20 )
Quantitative GpG island methylation analysis using MethyLight. Tumor DNA was converted with sodium bisulfite prior to the analysis of CpG island methylation for the MLH1, P16(INK4A), TIMP3, P14(ARF), DAPK, APC, ER and MYOD genes using the fluorescent‐based, real‐time PCR MethyLight assay as described previously.( 20 , 26 ) Oligonucleotide sequences for primers and probes were identical to those described in these earlier studies. The PMR value was calculated using DNA that was fully methylated with SssI methylase as the positive control reference. A PMR cut‐off value of 4 has previously been validated and was used here to define positive methylation in tumor DNA for MLH1, P16, TIMP3, P14 and APC. A lower cut‐off value (PMR > 1) was used for DAPK because of the relatively low methylation levels observed for this gene, while the higher cut‐off value of PMR = 10 was used for ER and MYOD. In addition to these genes, methylation was also evaluated for the new CIMP panel of markers comprising CACNA1G, IGF2, NEUROG1, RUNX3 and SOCS1, where PMR values were derived using the ALU normalization control reaction.( 11 ) Simultaneous methylation at three or more of these sites was considered to represent CIMP+. CpG‐island‐specific methylation in normal colonic mucosa was classified as none, low or high. These groupings correspond to PMR readings of 0, ≤ median positive value, or > median positive value, respectively, as described in an earlier study by the present group.( 26 ) The mean, range and median values for each CpG island were also given in that study.( 26 )
Quantitative methylation analysis of LINE‐1. Methylated and unmethylated LINE‐1 sequence was quantitatively evaluated using real‐time PCR and using bisulfite treated DNA as the template. Primers used were:
-
1
LINEa: unmethylated LINE‐1 forward primer, TGTGTGTGAGTTGAAGTAGGGT;
-
2
LINEb: unmethylated LINE‐1 reverse primer, ACCCAATTTTCCAAATACAACCATCA;
-
3
LINEc: methylated LINE‐1 forward primer, CGCGAGTCGAAGTAGGGC;
-
4
LINEd: methylated LINE‐1 reverse primer, ACCCGATTTTCCAAATACGACCG.
The plasmid pTA/LINEa–d containing both unmethylated and methylated LINE‐1 amplicon was created prior to measurements for use as a constant reference. PCR products for unmethylated and methylated LINE‐1 sequences were cloned with pGEM‐T Easy Vector system (Promega, Madison, WI, USA) and designated as pTA/LINEa–b and pTA/LINEc–d, respectively. The unmethylated LINE‐1 sequence was digested from pTA/LINEa–b with SacII and SpeI, while the methylated LINE‐1 sequence was digested from pTA/LINEc–d with SpeI and EcoRI. The digested fragments were subcloned into pGEM‐T Easy Vector between the SacII and EcoRI sites so that the resulting plasmid pTA/LINEa–d had both unmethylated and methylated LINE‐1 sequences arranged in tandem. This plasmid, pTA/LINEa–d, was used as a standard for the measurement of both unmethylated and methylated LINE‐1, and serial dilutions were used to obtain accurate and reproducible results. Real‐time PCR was conducted using the ABI‐PRISM 7700 Sequence Detection System (Applied Biosystems, Foster, CA, USA) and SYBR Premix Ex Taq (TaKaRa Bio, Otsu, Japan) following the protocol provided by the manufacturer. Real‐time reactions for unmethylated and methylated LINE‐1 sequence were performed simultaneously in one 96‐well plate. The percentage of methylated LINE‐1 was calculated using the formula: 100 × methylated reaction/(unmethylated reaction + methylated reaction).
Microsatellite instability and mutation analysis for BRAF and KRAS. MSI status was determined by screening for instability at nine microsatellite loci that included both mononucleotide (BAT25, BAT26, BAT40) and dinucleotide (D2S123, D10S197, D17S579, D18S34, D5S346, D17S250) repeats. Tumors showing instability at two or more loci were considered to be MSI+. PCR‐F‐SSCP was used to screen for hot‐spot mutations in the BRAF (V600E) and KRAS (codons 12 and 13) oncogenes as described previously by the authors’ laboratory.( 28 , 29 )
Genotyping. PCR and PCR‐RFLP were used to genotype the 28 bp tandem repeat in the enhancer region of TS and the G/C SNP within the triple repeat allele, respectively.( 30 ) The sizes of HaeIII‐digested PCR products were estimated using 3% agarose gels. Genotyping for the MTHFR C677T and A1298C SNP was carried out using PCR‐F‐SSCP as described earlier.( 31 ) PCR‐RFLP was used to genotype for SNP in the MTHFD1 (G1958A), MS (A2756G) and DNMT3B (C46359T) genes using the restriction enzymes MspI (Promega, Sydney, Australia), HaeIII (Promega) and AvrII (New England BioLabs, Brisbane, Australia), respectively, as described earlier.( 20 , 21 , 26 )
Statistical analysis. Univariate associations between CIMP+ and categorical data were evaluated using the Pearson chi‐squared statistic. Fisher's exact test was used when expected frequencies fell below five. Student's t‐test was used to examine associations between CIMP status and continuous variables and also to compare LINE‐1 repeat methylation levels between different subgroups defined by clinical, pathological, molecular and genotypic features. All P‐values shown are two‐tailed with P < 0.05 taken as significant, with a Bonferroni correction used for multiple comparisons involving the variables of CpG island methylation and polymorphisms of methyl group metabolism genes. Statistical analyses were carried out using the SPSS software package (Version 15; Chicago, IL, USA) and STATA (Version 9.3).
Results
CpG island methylation in colorectal tumors. The authors have previously reported methylation levels for CpG islands within the P16, MLH1, P14, TIMP3, DAPK, APC, ER and MYOD genes in this tumor series.( 12 , 20 , 26 ) In the current study the MethyLight assay was used to evaluate methylation for a new panel of CpG island markers (CACNA1G, IGF2, NEUROG1, RUNX3 and SOCS1) recently proposed for the classification of CIMP+ tumors.( 11 ) As shown in Table 1, 17% of tumors were classified as CIMP+ using this new panel. CIMP+ tumors were strongly associated with proximal site, MSI+, BRAF mutation, mucinous histology, presence of infiltrating lymphocytes and higher intratumoral folate concentrations. No significant associations were seen with age, sex or KRAS mutation.
Table 1.
Associations between CIMP+ defined using a new panel of CpG island markers( 11 ) and clinicopathological and molecular features of colorectal cancer
| Feature | Total | CIMP– (0–2 sites) | CIMP+ (3–5 sites) | P‐value | |||
|---|---|---|---|---|---|---|---|
| n | % | n | % | n | % | ||
| Total | 205 | 100 | 171 | 83 | 34 | 17 | |
| Sex | |||||||
| Male | 124 | 60 | 106 | 62 | 18 | 53 | |
| Female | 81 | 40 | 65 | 38 | 16 | 47 | NS |
| Tumor site † | |||||||
| Proximal | 92 | 46 | 64 | 38 | 28 | 85 | |
| Distal | 110 | 54 | 105 | 62 | 5 | 15 | <1 × 10⁻⁵ |
| Mucinous ‡ | |||||||
| Yes | 33 | 17 | 19 | 12 | 14 | 42 | |
| No | 160 | 83 | 141 | 88 | 19 | 58 | <0.0001 |
| TILS § | |||||||
| Yes | 20 | 10 | 10 | 6 | 10 | 29 | |
| No | 184 | 90 | 160 | 94 | 24 | 71 | <0.0001 |
| Microsatellite instability | |||||||
| Positive | 28 | 14 | 13 | 8 | 15 | 44 | |
| Negative | 177 | 86 | 158 | 92 | 19 | 56 | <0.0001 |
| BRAF ¶ | |||||||
| Mutant | 17 | 9 | 4 | 2 | 13 | 42 | |
| Wild‐type | 181 | 91 | 163 | 98 | 18 | 58 | <1 × 10⁻⁵ |
| KRAS †† | |||||||
| Mutant | 82 | 41 | 73 | 43 | 9 | 29 | |
| Wild‐type | 119 | 59 | 97 | 57 | 22 | 71 | NS |
| Mean age (years, ± SD) | 68.8 ± 13.9 | 68.7 ± 13.1 | 69.6 ± 17.5 | NS | |||
| [CH2FH4] ‡‡ (± SD) | 1.64 ± 1.39 | 1.45 ± 1.27 | 2.48 ± 1.64 | 0.02 | |||
| [FH4] ‡‡ (± SD) | 2.13 ± 1.68 | 1.93 ± 1.53 | 3.01 ± 2.05 | 0.04 | |||
unknown for three cases;
‡ unknown for 12 cases;
§ unknown for one case;
¶ unknown for seven cases;
†† unknown for four cases;
‡‡ unknown for 108 cases. NS, not significant; TILS, tumor‐infiltrating lymphocytes.
Of the 34 CIMP+ tumors identified by the new panel of markers, 15 were also MSI+. The features of CIMP+ tumors in the absence of the MSI+ phenotype were evaluated by removing these 15 MSI+ cases. Despite the smaller sample size (n = 19), significant associations remained with proximal tumor site (P =0.002), BRAF mutation (P = 0.0004) and mucinous histology (P = 0.023), with a trend apparent for infiltrating lymphocytes (P = 0.065). As reported previously by the present group for other CpG‐island markers,( 20 ) no significant associations were observed here between CIMP+ defined by the new CpG island panel and common polymorphisms in several major genes involved in methyl group metabolism (TS, MTHFR, MTHFD1, MS or DNMT3B).
LINE‐1 methylation in colorectal tumors. The LINE‐1 methylation level in 205 colorectal tumor samples was 76.4 ± 10.7 (mean ± SD; range 24.5–96.1). No significant associations were found with patient age, sex, tumor site, histological grade or the presence of infiltrating lymphocytes (Fig. 1), although higher LINE‐1 methylation levels were observed in tumors with an absence of nodal involvement (P = 0.047) or with mucinous histology (P = 0.02).
Figure 1.

LINE‐1 methylation levels in colorectal tumors according to clinicopathological features. Q‐values represent quartiles for patient age from youngest (1) to oldest (4). Sex: F, female; M, male. Site: P, proximal colon; D, distal colon and rectum. Grade: W/M, well to moderate differentiation; P, poorly differentiated. Shaded areas represent 25 and 75 percentile values, while error bars represent 5 and 95 percentile values.
The LINE‐1 methylation level in tumor DNA was not associated with individual CpG island methylation for P16, MLH1, APC, TIMP3, DAPK, P14, ER or MYOD, or with CIMP+ status defined by the new panel of markers (results not shown). Furthermore, no associations were observed with the molecular features of MSI+, mutations in KRAS or BRAF, tumor folate concentrations or with any of the common polymorphisms in genes involved in methyl group metabolism (TS, MTHFR, MTHFD1, MS or DNMT3B).
LINE‐1 methylation in normal colonic mucosa. The LINE‐1 methylation level in 178 normal colonic mucosal samples was 84.0 ± 5.0 (mean ± SD; range 54.9–95.4). This was correlated with LINE‐1 methylation in the matching tumor sample (P =0.007, Spearman's rho) but was significantly higher (difference = 7.57, P < 0.0001, paired t‐test). Higher LINE‐1 methylation levels were observed in normal colonic mucosa from the youngest quartile of patients compared with the oldest quartile (P = 0.011); however, this failed to reach significance across the entire age range (P = 0.069; Fig. 2). No correlations were observed with patient sex or with the anatomical site (Fig. 2) or CIMP+ status of corresponding tumors.
Figure 2.

LINE‐1 methylation levels in normal colonic mucosa according to patient age and sex, and to the anatomical site of the tumor. Shaded areas represent 25 and 75 percentile values, while error bars represent 5 and 95 percentile values. Sex: F, female; M, male. Site: Dis, distal colon and rectum; Prox, proximal colon.
The authors have previously used the MethyLight assay to quantify CpG island methylation in this cohort of normal colonic mucosal samples.( 26 ) In the present study, significantly lower LINE‐1 methylation levels were observed in cases that were earlier classified as showing relatively high levels of CpG island methylation (Fig. 3). This was seen for all seven genes investigated and was particularly strong for MLH1, TIMP3, APC and ER, which showed significant associations after Bonferroni correction.
Figure 3.
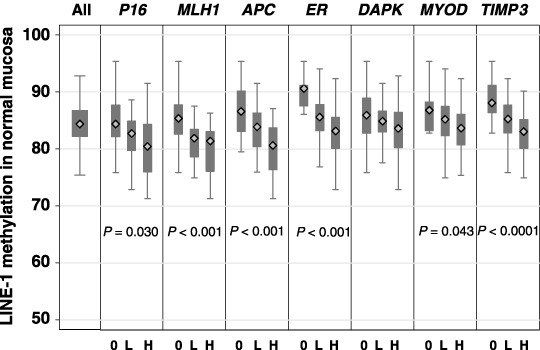
LINE‐1 methylation levels in normal colonic mucosa according to CpG island methylation levels. For each CpG island, the level of methylation in normal mucosa was been classified into three groups: 0, no detectable methylation; L, less than or equal to the median of positive values; H, greater than the median positive value. Shaded areas represent 25 and 75 percentile values, while error bars represent 5 and 95 percentile values.
Several common polymorphisms in genes involved in methyl group metabolism (MS, MTHFR, MTHFD1, DNMT3B and TS) were investigated here for possible associations with the level of LINE‐1 methylation in normal colonic tissue. The MTHFR 677TT/1298AA high‐activity haplotype and the combined MTHFD11958AG/AA genotype group were associated with significantly higher levels of LINE‐1 methylation (P = 0.033 and P = 0.009, respectively), the former after Bonferroni correction (Fig. 4). The DNMT3B 46359TT genotype also showed a trend for association with a high level of LINE‐1 methylation (Fig. 4), but common variants in MS (A2756G) and TS (28 bp repeat and G/C SNP) showed no correlation.
Figure 4.
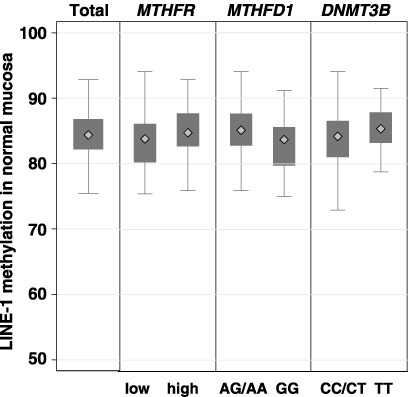
LINE‐1 methylation levels in normal colonic mucosa according to common polymorphisms in methyl group metabolism genes. MTHFR: low‐ and high‐activity haplotypes for C677T and A1298C.
Discussion
Alu and LINE‐1 repetitive elements are heavily methylated in normal human tissues.( 32 ) Loss of methylation of these repetitive elements is believed to account for much of the genomic hypomethylation observed in human cancers.( 17 , 33 ) Indeed, real‐time PCR measurement of Alu and LINE‐1 methylation demonstrated a significant correlation with genome‐wide 5‐methylcytosine content,( 27 ) indicating that analysis of these repeats may serve as a surrogate marker of the genomic methylation level. Similar to other reports that have evaluated global methylation in CRC,( 14 , 15 , 16 ) no correlations were seen here between the level of LINE‐1 methylation and CpG island hypermethylation, including the presence of CIMP+ defined by the new marker panel. The current results provide further confirmation that genomic hypomethylation and CpG island hypermethylation in CRC are independent events and may contribute separately to tumorigenesis in this cancer type. The factors responsible for these aberrant epigenetic changes remain to be identified and may in fact be unrelated somatic events. Common polymorphisms in the methyl group metabolism genes TS, MTHFR, MTHFD1, MS and DNMT3B were not associated with the level of LINE‐1 methylation in CRC, supporting an earlier study showing lack of association between polymorphisms in MTHFR and MS and the level of genomic methylation.( 21 )
Previous workers have reported significant associations between global methylation levels in CRC and patient age,( 15 ) sex,( 16 ) or tumor MSI status.( 5 ) However, these associations were not observed in the present study based on the methylation of LINE‐1 repeats as a surrogate marker for genome‐wide methylation. Differences in the analytical methods used could account for these discordances. Matsuzaki et al.( 5 ) evaluated the methylation of LINE‐1 repeats using COBRA, whereas Frigola et al.( 15 ) and Suzuki et al.( 16 ) evaluated the methylation of unspecified repeats using AIMS and MS‐AFLP, respectively. These assays may not, however, provide accurate measures of global hypomethylation. Weisenberger et al. found that a combined measure of methylation in the Alu and Sat2 repeats correlated most closely with global methylation,( 27 ) suggesting that further study in this area using other DNA repeat markers is warranted.
As expected, LINE‐1 methylation levels were higher in adjacent normal colonic mucosa (84.0 ± 5.0) compared with colorectal tumors (76.4 ± 10.7; P = 0.007). In agreement with a previous report,( 14 ) older age was associated with a trend for lower levels of LINE‐1 methylation in normal colonic mucosa (Fig. 2). Also in support of that study but in contrast to Frigola et al.( 15 ) no association was seen here between the level of LINE‐1 methylation in normal colonic mucosa and sex.
The major and novel finding of the present work is that the level of LINE‐1 methylation was inversely related to CpG island methylation in normal colonic mucosa (Fig. 3). This was observed for all seven CpG islands examined, including those previously described as Type A (ER and MYOD), Type C (P16 and MLH1) or the methylation of which in CRC is inversely associated with CIMP+ (APC).( 12 ) The authors have reported earlier that CpG island methylation in normal colonic mucosa increases with advancing age.( 26 ) This was first described in 1994 for a CpG island in ER,( 24 ) and in 2001 for a CpG island in MLH1.( 25 ) Thus, the authors conclude from the above results that the level of LINE‐1 methylation in normal colonic mucosa decreases with advancing age but in parallel there is a general increase in the level of CpG island methylation. Whether or not these two epigenetic changes in normal colonic mucosa are linked by a common mechanism remains to be determined.
The authors have previously reported that increased CpG island methylation in normal colonic mucosa was associated with the presence of CIMP+ CRC.( 26 ) Because of the strong inverse associations observed here between LINE‐1 methylation and CpG island methylation in normal colonic mucosa (Fig. 3), an association between LINE‐1 methylation in this tissue and the presence of CIMP+ tumors may have been expected but was not found. One possible explanation for this may be that CpG island methylation patterns are retained during tumor progression whereas LINE‐1 methylation levels are unstable. Under this hypothesis, the association between LINE‐1 methylation and CpG island methylation found in normal colonic mucosa is lost in CRC from advanced stages. Analysis of early stage CRC or premalignant tissue such as colonic polyps may be required to address this issue.
The concentration of folate intermediates acting as methyl donors for nucleotide synthesis is significantly elevated in tumors with CIMP‐related CpG island methylation.( 20 ) In the present study the authors were unable to test for possible associations with either LINE‐1 or CpG island methylation in normal colonic mucosa because insufficient tissue was available for folate measurement. Previous studies have shown that dietary folate supplementation increases the level of global methylation in normal colonic mucosa,( 22 , 23 ) and that depletion of dietary folate leads to reversible global hypomethylation of lymphocyte DNA.( 34 , 35 ) The effects of dietary folate intake on CpG island methylation in normal colonic mucosa are not yet known. However, if the pattern observed for aging is repeated, the authors hypothesize that dietary folate supplementation would lead to higher global methylation but lower CpG island methylation levels. Conversely, folate depletion would lead to lower global methylation but increased CpG island methylation. Together with the previous observation by the present group that increased CpG island methylation in normal colonic mucosa is associated with CIMP+ tumors,( 26 ) this could explain the protective effect of dietary folate intake on CRC risk.( 36 )
Apart from age and dietary folate, genetic factors are likely to play a major role in determining both global and CpG island methylation levels in normal colonic mucosa. Indeed, a recent study of differentially methylated regions in the IGF2/H19 locus of twins found that between 75 and 80% of the variation could be attributed to heritable factors.( 37 ) The authors have previously shown that an SNP in the DNMT3B gene was associated with CpG island methylation in normal colonic mucosa.( 26 ) In the present study it was found that SNP in the methyl group metabolism genes MTHFR and MTHFD1 were significantly associated with LINE‐1 methylation level in normal colonic mucosa, with the SNP in DNMT3B showing a trend (P = 0.07) for association (Fig. 4). To the authors’ knowledge, an association between genomic methylation and the MTHFD1 G1958A SNP has not previously been reported. The present finding of lower LINE‐1 methylation in the normal colonic mucosa of individuals with the MTHFR low‐activity haplotype concurs with previous global methylation data in various normal tissues,( 21 ) and white blood cells.( 38 , 39 ) It is tempting to speculate that individuals with the MTHFR 677TT genotype might also show high CpG island methylation levels in normal colonic mucosa, particularly in older and folate‐replete individuals.
CIMP+ was originally proposed to describe a subgroup of CRC that show frequent and concordant hypermethylation of CpG islands in ‘Type C’ loci.( 7 ) These loci were defined as having low CpG island methylation levels in normal tissue but very high levels in tumor tissue. CIMP+ tumors have been reported to have characteristic clinical and pathological features,( 8 , 9 , 10 ) although this was not observed by all workers.( 15 , 40 ) It now appears clear, however, that the choice of CpG island markers is of critical importance in defining the CIMP+ subgroup.( 11 , 12 ) In the present study the new panel of five CpG island markers recently proposed by Weisenberger et al.( 11 ) was used to classify CIMP+ tumors. In the present cohort of 205 unselected CRC, 17% were classified as CIMP+ (Table 1) compared to 18% by Weisenberger et al.( 11 ) Similar to their study, the same strong associations between CIMP+ and proximal tumor site, MSI+ status and BRAF mutation were found (Table 1). Mucinous histology, the presence of infiltrating lymphocytes and higher folate concentrations were other significant characteristics of CIMP+ tumors defined by the new panel of markers. Importantly, the associations between CIMP+ and the features of BRAF mutation and mucinous histology remained significant following removal of MSI+ tumors from the analysis, suggesting these characteristics are more closely linked to aberrant CpG island methylation than to deficient DNA mismatch repair.
In conclusion, the major finding of the present study is that the level of LINE‐1 methylation in normal colonic mucosa is inversely associated with CpG island methylation. With advancing age, the former decreases while the latter increases. Genetic variants in the methyl group metabolism genes MTHFR and MTHFD1 also appear to influence the level of LINE‐1 methylation in normal colonic mucosa. Further studies are required to determine the role of additional genetic factors and of dietary folate intake on both genome‐wide and CpG island methylation. This may lead to a better understanding of the causes that underlie aberrant DNA methylation in CRC generally and of the CIMP+ subgroup in particular.
Acknowledgments
This work was funded by a Grant‐in‐Aid for Scientific Research on Priority Areas from the Ministry of Education, Culture, Sports, Science and Technology of Japan.
References
- 1. Jones PA, Baylin SB. The fundamental role of epigenetic events in cancer. Nat Rev Genet 2002; 3: 415–28. [DOI] [PubMed] [Google Scholar]
- 2. Laird PW. Cancer epigenetics. Hum Mol Genet 2005; 14: R65–76. [DOI] [PubMed] [Google Scholar]
- 3. Ehrlich M. DNA methylation in cancer: too much, but also too little. Oncogene 2002; 21: 5400–13. [DOI] [PubMed] [Google Scholar]
- 4. Eden A, Gaudet F, Waghmare A, Jaenisch R. Chromosomal instability and tumours promoted by DNA hypomethylation. Science 2003; 300: 455. [DOI] [PubMed] [Google Scholar]
- 5. Matsuzaki K, Deng G, Tanaka H et al . The relationship between global methylation level, loss of heterozygosity, and microsatellite instability in sporadic colorectal cancer. Clin Cancer Res 2005; 11: 8564–9. [DOI] [PubMed] [Google Scholar]
- 6. Issa JP. CpG island methylator phenotype in cancer. Nat Rev Cancer 2004; 4: 988–93. [DOI] [PubMed] [Google Scholar]
- 7. Toyota M, Ahuja N, Ohe‐Toyota M et al . CpG island methylator phenotype in colorectal cancer. Proc Natl Acad Sci USA 1999; 96: 8681–6. [DOI] [PMC free article] [PubMed] [Google Scholar]
- 8. Hawkins N, Norrie M, Cheong K et al . CpG island methylation in sporadic colorectal cancers and its relationship to microsatellite instability. Gastroenterology 2002; 122: 1376–87. [DOI] [PubMed] [Google Scholar]
- 9. Van Rijnsoever M, Grieu F, Elsaleh H et al . Characterisation of colorectal cancers showing hypermethylation at multiple CpG islands. Gut 2002; 51: 797–802. [DOI] [PMC free article] [PubMed] [Google Scholar]
- 10. Samowitz WS, Albertsen H, Herrick J et al . Evaluation of a large, population‐based sample supports a CpG island methylator phenotype in colon cancer. Gastroenterology 2005; 129: 837–45. [DOI] [PubMed] [Google Scholar]
- 11. Weisenberger DJ, Siegmund KD, Campan M et al . CpG island methylator phenotype underlies sporadic microsatellite instability and is tightly associated with BRAF mutation in colorectal cancer. Nat Genet 2006; 38: 787–93. [DOI] [PubMed] [Google Scholar]
- 12. Iacopetta B, Grieu F, Li W et al . APC gene methylation is inversely correlated with features of the CpG island methylator phenotype in colorectal cancer. Int J Cancer 2006; 119: 2272–8. [DOI] [PubMed] [Google Scholar]
- 13. Jass JR. Serrated adenoma of the colorectum and the DNA‐methylator phenotype. Nat Clin Pract Oncol 2005; 2: 398–405. [DOI] [PubMed] [Google Scholar]
- 14. Bariol C, Suter C, Cheong K et al . The relationship between hypomethylation and CpG island methylation in colorectal neoplasia. Am J Pathol 2003; 162: 1361–71. [DOI] [PMC free article] [PubMed] [Google Scholar]
- 15. Frigola J, Sole X, Paz MF et al . Differential DNA hypermethylation and hypomethylation signatures in colorectal cancer. Hum Mol Genet 2005; 14: 319–26. [DOI] [PubMed] [Google Scholar]
- 16. Suzuki K, Suzuki I, Leodolter A et al . Global DNA demethylation in gastrointestinal cancer is age dependent and precedes genomic damage. Cancer Cell 2006; 9: 199–207. [DOI] [PubMed] [Google Scholar]
- 17. Ehrlich M, Woods CB, Yu MC et al . Quantitative analysis of associations between DNA hypermethylation, hypomethylation, and DNMT RNA levels in ovarian tumours. Oncogene 2006; 25: 2636–45. [DOI] [PMC free article] [PubMed] [Google Scholar]
- 18. Ehrlich M, Jiang G, Fiala E et al . Hypomethylation and hypermethylation of DNA in Wilms tumours. Oncogene 2002; 21: 6694–702. [DOI] [PubMed] [Google Scholar]
- 19. Van Engeland M, Weijenberg MP, Roemen GM et al . Effects of dietary folate and alcohol intake on promoter methylation in sporadic colorectal cancer: the Netherlands cohort study on diet and cancer. Cancer Res 2003; 63: 3133–7. [PubMed] [Google Scholar]
- 20. Kawakami K, Ruszkiewicz A, Bennett G et al . The folate pool in colorectal cancers is associated with DNA hypermethylation and with a polymorphism in methylene tetrahydrofolate reductase. Clin Cancer Res 2003; 9: 5860–5. [PubMed] [Google Scholar]
- 21. Paz MF, Avila S, Fraga MF et al . Germ‐line variants in methyl‐group metabolism genes and susceptibility to DNA methylation in normal tissues and human primary tumours. Cancer Res 2002; 62: 4519–24. [PubMed] [Google Scholar]
- 22. Pufulete M, Al‐Ghnaniem R, Leather AJ et al . Folate status, genomic DNA hypomethylation, and risk of colorectal adenoma and cancer: a case control study. Gastroenterology 2003; 124: 1240–8. [DOI] [PubMed] [Google Scholar]
- 23. Pufulete M, Al‐Ghnaniem R, Khushal A et al . Effect of folic acid supplementation on genomic DNA methylation in patients with colorectal adenoma. Gut 2005; 54: 648–53. [DOI] [PMC free article] [PubMed] [Google Scholar]
- 24. Issa JP, Ottaviano YL, Celano P et al . Methylation of the oestrogen receptor CpG island links ageing and neoplasia in human colon. Nat Genet 1994; 7: 536–40. [DOI] [PubMed] [Google Scholar]
- 25. Nakagawa H, Nuovo GJ, Zervos EE et al . Age‐related hypermethylation of the 5′ region of MLH1 in normal colonic mucosa is associated with microsatellite unstable colorectal cancer development. Cancer Res 2001; 61: 6991–5. [PubMed] [Google Scholar]
- 26. Kawakami K, Ruszkiewicz A, Bennett G et al . DNA hypermethylation in the normal colonic mucosa of patients with colorectal cancer. Br J Cancer 2006; 94: 593–8. [DOI] [PMC free article] [PubMed] [Google Scholar]
- 27. Weisenberger DJ, Campan M, Long TI et al . Analysis of repetitive element DNA methylation by MethyLight. Nucl Acids Res 2005; 33: 6823–36. [DOI] [PMC free article] [PubMed] [Google Scholar]
- 28. Li WQ, Kawakami K, Ruszkiewicz A et al . BRAF mutations are associated with distinctive clinical, pathological and molecular features of colorectal cancer independently of microsatellite instability status. Mol Cancer 2006; 5: 2. [DOI] [PMC free article] [PubMed] [Google Scholar]
- 29. Wang C, Van Rijnsoever M, Grieu F et al . Prognostic significance of microsatellite instability and Ki‐ras mutation type in stage II colorectal cancer. Oncology 2003; 64: 259–65. [DOI] [PubMed] [Google Scholar]
- 30. Kawakami K, Watanabe G. Identification and functional analysis of single nucleotide polymorphism in the tandem repeat sequence of thymidylate synthase gene. Cancer Res 2003; 63: 6004–7. [PubMed] [Google Scholar]
- 31. Grieu F, Joseph D, Norman P, Iacopetta B. Development of a rapid genotyping method for single nucleotide polymorphisms and its application in cancer studies. Oncol Rep 2004; 11: 501–4. [PubMed] [Google Scholar]
- 32. Lander ES, Linton LM, Birren B et al . Initial sequencing and analysis of the human genome. Nature 2001; 409: 860–921. [DOI] [PubMed] [Google Scholar]
- 33. Kaneda A, Tsukamoto T, Takamura‐Enya T et al . Frequent hypomethylation in multiple promoter CpG islands is associated with global hypomethylation, but not with frequent hypermethylation. Cancer Sci 2004; 95: 58–64. [DOI] [PMC free article] [PubMed] [Google Scholar]
- 34. Jacob RA, Gretz DM, Taylor PC et al . Moderate folate depletion increases plasma homocysteine and decreases lymphocyte DNA methylation in postmenopausal women. J Nutr 1998; 128: 1204–12. [DOI] [PubMed] [Google Scholar]
- 35. Rampersaud GC, Kauwell GP, Hutson AD et al . Genomic DNA methylation decreases in response to moderate folate depletion in elderly women. Am J Clin Nutr 2000; 72: 998–1003. [DOI] [PubMed] [Google Scholar]
- 36. Kim YI. Folate and DNA methylation: a mechanistic link between folate deficiency and colorectal cancer? Cancer Epidemiol Biomarkers Prev 2004; 13: 511–19. [PubMed] [Google Scholar]
- 37. Heijmans BT, Kremer D, Tobi EW et al . Heritable rather than age‐related environmental and stochastic factors dominate variation in DNA methylation of the human IGF2/H19 locus. Hum Mol Genet 2007; 16: 547–54. [DOI] [PubMed] [Google Scholar]
- 38. Stern LL, Mason JB, Selhub J, Choi SW. Genomic DNA hypomethylation, a characteristic of most cancers, is present in peripheral leukocytes of individuals who are homozygous for the C677T polymorphism in the methylene tetrahydrofolate reductase gene. Cancer Epidemiol Biomark Prev 2000; 9: 849–53. [PubMed] [Google Scholar]
- 39. Friso S, Choi SW, Girelli D et al . A common mutation in the 5, 10‐methylene tetrahydrofolate reductase gene affects genomic DNA methylation through an interaction with folate status. Proc Natl Acad Sci USA 2002; 99: 5606–11. [DOI] [PMC free article] [PubMed] [Google Scholar]
- 40. Yamashita K, Dai T, Dai Y et al . Genetics supersedes epigenetics in colon cancer phenotype. Cancer Cell 2003; 4: 121–31. [DOI] [PubMed] [Google Scholar]