

Abstract
Pro‐inflammatory cytokines and chemokines are involved in promoting tumorigenesis by facilitating tumor proliferation and metastasis. The serum levels of interleukin (IL)‐6, IL‐1β, and tumor necrosis factor‐alpha (TNF‐α) are significantly elevated in patients with renal cell carcinoma (RCC). However, the mechanisms of how these cytokines participate in the progression of RCC remains unknown. In the present study, we investigated the effects of tumor‐derived cytokines on invasion and the epithelial‐mesenchymal transition (EMT) of RCC cells. We found that expression of IL‐1β, IL‐6, TNF‐α, hypoxia‐inducible factor‐alpha (HIF‐1α), and matrix metalloproteinase‐2 (MMP2) were significantly elevated in high malignancy A498 cells compared to low malignancy 786‐O cells. The invasion ability of A498 was three‐fold higher than that of 786‐O cells. The invasiveness of 786‐O cells was markedly enhanced by adding conditioned medium derived from A498 cells. This phenomenon was significantly inhibited by immunodepletion of TNF‐α followed by MMP2, IL‐6, or IL‐1β from A498 conditioned medium. Synergistic inhibition was also noted after simultaneous immunodepletion of TNF‐α, IL‐1β, and IL‐6. RCC cell lines with higher malignancy produced more TNF‐α, which was correlated with their stronger invasive ability. The invasiveness of 786‐O cells was significantly promoted by TNF‐α in a dose‐dependent manner. Moreover, TNF‐α induced the EMT of 786‐O cells by repressing E‐cadherin, promoting vimentin expression, and activating MMP9 activity. Our findings demonstrate that pro‐inflammatory cytokines, especially TNF‐α, can enhance invasion and the EMT of renal cancer cells, which provides a therapeutic target to prevent and treat advanced RCC. (Cancer Sci 2008; 99: 905–913)
Renal cell carcinoma (RCC) arises from the renal tubular epithelium and account for 85% of renal cancers.( 1 ) Four types of RCC have been delineated clinically and the genes responsible for them have been characterized. Overall, 75% of RCC are the clear cell type (ccRCC), while the other 25% are made up of the papillary, chromophobe, and oncocytic types.( 2 ) Defects in the von Hippel–Lindau (VHL) gene appear to be responsible for 60% of sporadic ccRCC. A quarter of patients present with locally invasive or metastatic RCC. A third of the patients after resection of the tumor will have a recurrence. Moreover, systemic theraputic treatments of advanced RCC are largely ineffective and do not improve patient survival.( 1 , 2 ) Therefore, defining the factors involved in disease progression and metastasis will provide molecular targets for the development of effective therapies.
A complex network of pro‐inflammatory cytokines, chemokines, and their receptors influences the development of primary tumors and metastasis.( 3 , 4 ) CXCR4 is most commonly found in malignant cells from different cancer types.( 4 ) In addition to CXCR4, CCR3 has been found to be up‐regulated in 28% RCC tissues and correlates with a higher grade of malignancy.( 5 ) Furthermore, the levels of IL‐6, IL‐1β, and TNF‐α in serum are significantly higher and correlated with tumor size in RCC.( 6 ) IL‐6 blood level is significantly higher in patients with lymph node invasion and distant metastases, while TNF‐α level is significantly higher as the stage of the RCC increases.( 6 , 7 ) Therefore, IL‐6 may be one of the factors associated with poor prognosis of patients with RCC. In addition, TNF‐α may be useful as marker for the early diagnosis of RCC.( 6 ) However, little is known about how these cytokines affect RCC migration and progression.
The epithelial‐mesenchymal transition (EMT) is a process in which polarized epithelial cells are converted into motile mesenchymal cells. Alterations in adhesion, morphology, cellular architecture, and migration capacity are the major events that occur during this process.( 8 ) Common molecular markers for the EMT include increased expression of vimentin, nuclear localization of β‐catenin, and increased production of transcriptional factors that inhibit E‐cadherin production. Phenotypic markers for EMT comprise an increased capacity for migration and three‐dimensional invasion as well as resistance to apoptosis.( 9 ) The EMT occurs during critical phases of normal embryonic development in many animal species. However, this important developmental program has a more sinister role in tumor progression. EMT is involved in the progression of non‐invasive adenomas into malignant metastatic carcinomas.( 8 , 9 , 10 )
In this study, an invasion assay and two human ccRCC cell lines with a VHL mutation and different levels of malignancy were used to define the tumor‐derived factors involved in the progression of renal cancer. TNF‐α, IL‐1, IL‐6, and matrix metalloproteinase‐2 (MMP2), which are secreted by advanced RCC cells, were shown to promote invasion of RCC. Furthermore, tumor‐derived TNF‐α was the major factor correlated with malignancy and is involved in the EMT of kidney cancer.
Materials and Methods
Antibodies and reagents. Anti‐human IL‐1β mAb was purchased from Becton Dickinson (Bedford, MA, USA) and anti‐IL‐6 and anti‐TNF‐α from Janssen Biochimica (Geel, Belgium). Anti‐MMP2 and anti‐CCL2 were obtained from Santa Cruz Biotechnology (Santa Cruz, CA, USA) and anti‐E‐cadherin from BD Biosciences (San Jose, CA, USA). Anti‐vimentin and anti‐β‐actin came from Sigma (St Louis, MO, USA) and the recombinant human TNF‐α was purchased from Invitrogen (Camarillo, CA, USA).
Cell lines. The human renal cell carcinoma cell lines (A498, 786‐O, Caki‐1, ACHN) were purchased from the Bioresource Collection and Research Center (BCRC; Hsinchu, Taiwan) and cultured according to the BCRC instructions.
Reverse transcription–polymerase chain reaction (RT‐PCR). Total RNA was extracted from RCC cells using the Ultraspec‐II RNA isolation system (BIOTECX Laboratory, Houston, TX, USA) or RNeasy kit (Qiagen, Hilden, Germany). Each extracted sample (5 µg) was reversely transcribed into cDNA in a reverse transcriptional buffer (30 µL) containing 50 mM Tris‐HCl, 75 mM KCl, 3 mM MgCl2, 0.5 µg oligo‐dT primer, 0.5 mM dNTP, 32 U RNasin, 10 mM DTT, and 40 U MMLV reverse transcriptase (Promega, Madison, WI, USA) at pH 8.3 and 42°C for 1 h. The reverse transcription product (5 µL) was added to PCR buffer containing 10 mM Tris‐HCl, 1.5 mM MgCl2, 50 mM KCl, 0.1% Triton X‐100, 100 ng forward primer, 100 ng reverse primer, 0.2 mM dNTP, and 2 U DNA polymerase (Promega). PCR was then performed in a HYBAID OminGene DNA Thermal Cycler (Teddington, UK) with a program of denaturing at 95°C for 1 min, annealing at 60°C or 64°C for 1 min, and primer extension at 72°C for 2 min. The amplification was carried out for 25 or 30 cycles. The reaction was stopped with a final extension at 72°C for 10 min.
For transcript quantification purposes by real‐time PCR (qPCR), the SYBR Green Mix containing Thermo‐Start DNA Polymerase was used according to the manufacturer's instructions. A hot‐start phase was applied at 95°C for 10 min for all primers. cDNA was amplified for 45 cycles at 95°C for 10 s, 60°C for 10 s, and 72°C for 25 s. At each cycle, accumulation of PCR products was detected by monitoring the increase in fluorescence by dsDNA‐binding SYBR Green. The threshold cycles (CT) were recorded for all samples for both the target gene and the reference gene glyceraldehyde‐3‐phosphate dehydrogenase (GAPDH). Melt curve analysis was done for each run. Relative gene expression of the target gene was calculated as ΔCT, determined by subtracting the CT of reference gene from the CT of target gene. The differential expression of the target gene in experimental versus control samples was shown as ΔΔCT, determined by subtracting the ΔCT of experimental from the ΔCT of control sample. The forward and reverse primers for IL‐1β, IL‐6 exon 3, TNF‐α, vascular endothelial growth factor (VEGF), transforming growth factor‐beta (TGF‐β), LIM Kinase‐1 (LIMK‐1), LIMK‐2, hypoxia‐inducible factor‐alpha (HIF‐1α), matrix metalloproteinase 2 (MMP2), Slug (SNAI2), ZEB1 (transcription factor 8 [TCF8]) and GAPDH were synthesized by Mission Biotech (Taipei, Taiwan) (Table 1).
Table 1.
Sequences of the primer pairs used in reverse transcription–polymerase chain reactions
| Forward primer/reverse primer | |
|---|---|
| IL‐1β | 5′‐GAATGTGGACTCAATCCC‐3′ |
| 5′‐ACTGCTACTTCTTGCCC‐3′ | |
| IL‐6 exon 3 | 5′‐GCTTTAAGGAGTTCCTGC‐3′ |
| 5′‐GGTAAGCCTACACTTTCCA‐3′ | |
| TNF‐α | 5′‐GTAGCCCATGTTGTAGCA‐3′ |
| 5′‐CTCGGCAAAGTCGAGATA‐3′ | |
| VEGF | 5′‐ACTGCTGTGGACTTGAG‐3′ |
| 5′‐CAGGTGAGAGTAAGCGA‐3′ | |
| TGF‐β | 5′‐GACATCAACGGGTTCAC‐3′ |
| 5′‐GAAGTTGGCATGGTAGC‐3′ | |
| HIF‐1α | 5′‐CCAGTTACGTTCCTTCG‐3′ |
| 5′‐ACACGTTAGGGCTTCT‐3′ | |
| MMP2 | 5′‐GCAAGTTTCCATTCCGC‐3′ |
| 5′‐GTCGTCATCGTAGTTGGC‐3′ | |
| LIMK‐1 | 5′‐GCTTTGCCAAGGACAT‐3′ |
| 5′‐AATCCTCGCACGTTGA‐3′ | |
| LIMK‐2 | 5′‐CTCGCTCCTCACATGCAGAATG‐3′ |
| 5′‐CAAGGTGCGTTTCTTGGTGGT‐3′ | |
| GAPDH | 5′‐ACCACAGTCCATGCCATCAC‐3′ |
| 5′‐TCCACCACCCTGTTGCTGTA‐3′ | |
| Slug | 5′‐TGTTGCAGTGAGGGCAAGAA‐3′ |
| 5′‐GACCCTGGTTGCTTCAAGGA‐3′ | |
| ZEB1 | 5′‐GCCAATAAGCAAACGATTCTG‐3′ |
| 5′‐TTTGGCTGGATCACTTTCAAG‐3′ | |
| GAPDH (qPCR) | 5′‐CAACTACATGGTTTACATGTTC‐3′ |
| 5′‐GCCAGTGGACTCCACGAC‐3′ |
GADPH, glyceraldehyde‐3‐phosphate dehydrogenase; IL, interleukin; HIF, hypoxia‐inducible factor; LIMK, LIM Kinase; MMP, matrix metalloproteinase; TGF, transforming growth factor; TNF, tumor necrosis factor; VEGF, vascular endothelial growth factor; ZEB, transcription factor 8 (TCF 8).
Tumor cell invasion assay. Invasion assays were performed in 24‐well Transwell chambers (Corning, Acton, MA, USA) containing polycarbonate filters with 8‐µm pores coated with Matrigel (BD Biosciences, Bedford, MA, USA). Briefly, tumor cells (3 × 10⁴ in 0.5% fetal bovine serum [FBS]‐cultured medium) were plated in the upper chamber and complete cultured medium (10% FBS), or conditioned medium collected from A498 (ACM) or 786‐O (7 CM) cells was added in the lower chamber. After incubating at 37°C in a humidified 5% CO2 atmosphere for 24 h, the cells in the upper chamber were fixed with methanol and the matrigel were mechanically removed with a cotton swab. The cells adhering to the outer surface of the membrane were stained with Liu's stain (Muto, Tokyo, Japan) according to the instructions from the manufacturer. The invading cells were examined, counted, and photographed at 100 × magnification under a microscope. Ten fields were counted per filter in each group and each experiment was repeated in triplicate.
Immunodepletion of tumor‐cell conditioned medium. To prepare the tumor cell‐conditioned medium, tumor cells (5 × 10⁵/5 mL) were cultured in complete cultured medium (10% FBS) for 3 days. After centrifugation to remove cells and collect the supernatant, A498 tumor cell‐conditioned medium (ACM) (1 mL) was then immunodepleted by adding 2.5 µg isotype‐matched control antibody or IL‐1β or TNF‐α or IL‐6 or MMP2 or CCL‐2 antibodies and 15 µL protein A‐sepharose (GE Healthcare Bio‐Sciences, Uppsala, Sweden). After mixing for 24 h at 4°C, the immuno‐complexes were precipitated by centrifugation at 2500 r.p.m. for 15 min. The supernatants were collected and used as immunodepleted‐conditioned medium in an invasion assay.
TNF‐α enzyme immunoassay. RCC cell lines (1 × 10⁵/mL) were cultured at 37°C in 5% CO2 in complete medium for 72 h. The cultured supernatant and total proteins (50 µg) of these cells were collected and the concentrations of TNF‐α then measured by commercially available EIA kits (BD Biosciences, San Diego, CA, USA).
Western blotting. 786‐O cells (3 × 10⁵/5 mL) were cultured in complete medium for 24 h and then treated with or without TNF‐α (50 ng/mL) for 2 or 4 days. Protein concentrations of the cell lysates were measured using the Bio‐Rad protein assay kit (Hercules, CA, USA). Proteins (60 µg) of cell lysates were separated by 10% SDS‐PAGE and Western blotted with anti‐E‐cadherin, anti‐vimentin, and anti‐β‐actin antibodies.
Gelatin zymography. 786‐O cells (1 × 10⁵/mL) were cultured with or without TNF‐α (50 ng/mL) in 0.1% FBS‐cultured medium for 24 h. Culture supernatants were collected and concentrated by ultrafiltration (Vivascience, Stonehouse, UK). The protein concentration of cultured supernatants was measured with the Bio‐Rad protein assay kit. Culture supernatants were then resuspended in a sample buffer containing 0.1 M Tris–HCl (pH 6.8), 50% glycerol, 10% SDS, and 0.00125% (w/v) bromophenol blue, and loaded without boiling in 10% acrylamide/bisacrylamide (29.2:0.8) separating gel containing 1 mg/mL gelatin. After electrophoresis, the gels were soaked twice in 0.25% Triton X‐100 for 15 min at room temperature. Then, the gel slab containing gelatin was incubated at 37°C for 20 h in the development buffer containing 0.01 M CaCl2 and 0.05 M Tris‐HCl (pH 8.0). The gel was fixed for 15 min in solution containing 50% methanol and 10% acetic acid. The gel was then stained for 2 h in 0.5% (w/v) Coomassie blue R‐250 and destained in 10% acetic acid.
Statistical analysis. Data were expressed as mean ± SD and statistical significance was assessed by the Student's t‐test.
Results
Expression of IL‐1β, IL‐6, TNF‐α, HIF‐1α, and MMP2 were significantly elevated in RCC cell lines with higher malignancy. In order to determine the correlation between the cytokine profiles and the invasion ability of RCC cells, we investigated the gene expression profiles of two human VHL‐null RCC cell lines. These were A498 with a high malignancy and 786‐O with a low malignancy. The level of mRNA expression of pro‐inflammatory cytokines, chemokines, and metalloproteinases (MMP) in these two cell lines were determined by RT‐PCR (Fig. 1a). The expression of IL‐1β IL‐6, TNF‐α, hypoxia‐inducible factor (HIF)‐1α, and MMP2 were significantly elevated in A498 cells (Fig. 1b). We also used RT‐qPCR to confirm and quantify the expression of MMP2 in RCC cells (data not shown). MMP2 mRNA was expressed in the 786‐O cells (CT = 23, ΔCT = 7.1) but lower than A498 cells (32‐fold). In addition, CCL2 chemokine was up‐regulated (six‐fold) and CXCL5 was down‐regulated in A498 cells, as detected by Taqman quantitative RT‐PCR (data not shown). However, there were no significant changes in the expression of VEGF, TGF‐β, and LIM Kinase (LIMK) between the two cell lines.
Figure 1.

Expression of pro‐inflammatory cytokines, chemokines, and metastasis‐relative genes in A498 and 786‐O cells. (a) The mRNA expression was analyzed by polymerase chain reaction (PCR) and quantified by ImageQuant software. Twenty‐five cycles of PCR were for detection of matrix metalloproteinase‐2 (MMP2), transforming growth factor‐beta (TGF‐β), and glyceraldehyde‐3‐phosphate dehydrogenase (GAPDH). Thirty cycles of PCR were for detection of other genes. (b) The gene expression level was calculated as (intensity of RT‐PCR product of each gene)/(intensity of RT‐PCR product of GAPDH). The bars showed the mean ± SD of three independent experiments. (*P < 0.05, **P < 0.01).
High malignant RCC cells had superior invasion ability and secreted chemoattractants into the conditioned medium. We further examined the invasion ability of A498 and 786‐O cells by means of matrigel transwell assay. The number of invaded A498 cells (310 cells/field) was three‐fold higher than with 786‐O cells (100 cells/field) (Fig. 2). However, these different cancer cell lines may have different genetic backgrounds and so have different malignant potential. Since A498 cells expressed higher levels of secretory cytokines than 786‐O cells, we thought that cultured medium derived from these two cell lines may contain different chemoattractants. To test this hypothesis, we investigated the invasiveness of 786‐O cells cultured where conditioned medium derived from either 786‐O or A498 cells was present. Indeed, invasion by 786‐O cells was markedly increased in the presence of A498 conditioned medium (ACM, 798 cells/field) compared to cells cultured with 786‐O conditioned medium (7 CM, 14 cells/field) (P < 0.01) (Fig. 2). Thus, ACM possessed a stronger chemoattractive effect than does 786‐O conditioned medium.
Figure 2.
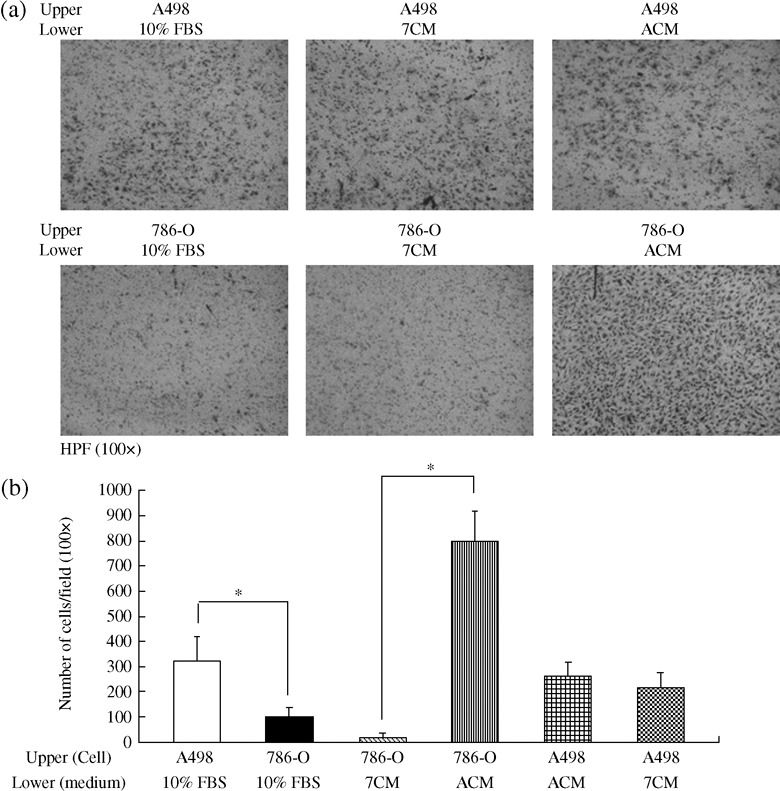
The effect of cultured and conditioned media on the invasion of renal cell cancer (RCC) cell lines. (a) A498 and 786‐O cells (3 × 10⁴ cells in 0.5% FBS) were cultured in the upper chamber for 24 h along with complete cultured medium (10% fetal bovine serum) or conditioned medium collected from A498 cells (ACM) and 786‐O cells (7 CM) in the lower chamber. Cells that had passed to the undersurface of the filters were stained with Liu's stain and photographs were taken under a microscope at a 100 × magnification. (b) The number of invaded cells in 10 random fields was counted per filter in each group and the experiment was repeated three separate times. Data were expressed as mean ± SD and statistical significance was assessed by the Student's t‐test. (*P < 0.01).
TNF‐α, IL‐1β IL‐6, and MMP2 were the chemoattractants in the conditioned medium of high malignant RCC cells. To investigate the molecules responsible for chemoattractive effects in ACM, several chemokines and pro‐inflammatory cytokines were removed from the ACM by immuno‐precipitation with specific antibodies. In contrast to depletion of CCL2 in ACM, removal of MMP2 from ACM significantly inhibited 786‐O cell invasion (22%, Fig. 3). After the immunodepletion of TNF‐α from ACM, the 786‐O cell invasion attracted by ACM was inhibited (35%, Fig. 4). This inhibition rate was significantly higher than those at the removal of IL‐1β (19%) or IL‐6 (14%). Eliminating both IL‐1β and IL‐6 from ACM also led to a 34% reduction of 786‐O invaded cells. A significant increase in the reduction rate was observed in 786‐O cells attracted by ACM without IL‐1β, IL6, and TNF‐α (43%). These results indicate that the proimflammotry cytokines play an important role in mediating the invasion ability of RCC cells. Among currently investigated cytokines, it would seem that TNF‐α has the greatest potential as a chemoattractant inducing RCC cell invasion.
Figure 3.

The effect of CCL2 and matrix metalloproteinase‐2 (MMP2) on the invasiveness of the 786‐O cell. (a) The 786‐O cells (3 × 10⁴ cells) were seeded onto the upper surfaces of membranes of Matrigel‐coated inserts and the Ab‐immunodepletion of CCL2 (αCCL2 ACM) or MMP2 (αMMP2 ACM) or Ab control (IgG1 ACM) from A498 conditioned medium were added to the lower chamber. After 24 h, the cells adherent to the outer surface of the membrane were fixed, stained, and photographed. (b) The invading cells were examined and counted by microscopy at 100 × magnification. Ten fields were counted per filter in each group and the experiment was repeated two separate times. Statistical significance was assessed by the Student's t‐test. (*P < 0.05).
Figure 4.
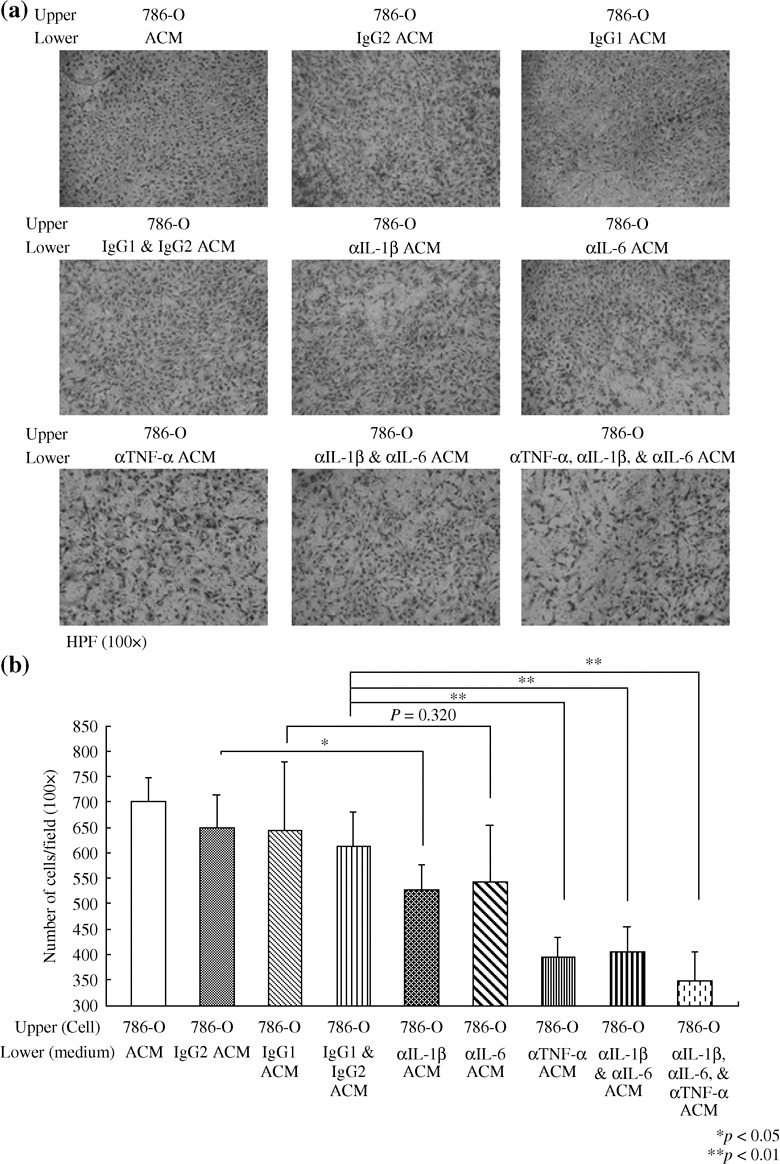
The effect of pro‐inflammatory cytokines on the invasion of 786‐O cells. (a) The A498 conditioned medium (ACM) was immunodepleted with interleukin‐1beta (IL‐1β) (αIL‐1β ACM), IL‐6 (αIL‐6 ACM), and tumor necrosis factor‐alpha (TNF‐α) (αTNF‐α ACM), or mouse isotype antibody control (IgG1 ACM, IgG2 ACM, and IgG1 and IgG2 ACM). Invasion assays were performed as for Figure 3. Invading 786‐O cells were stained and photographed at 100 × microscopic field. (b) Each bar represents the mean ± SD of 10 fields of each group from two independent experiments. * denotes P < 0.05. ** denotes P < 0.01.
TNF‐α production was positively correlated with the invasive phenotype of RCC cells. To further investigate the relationship between TNF‐α production and the invasion ability of RCC cells, a number of other human RCC cell lines, which were wild‐type for VHL, were analyzed. The correlation between TNF‐α secretion and cell invasion was determined by ELISA (Fig. 5a) and the Matrigel invasion assay (Fig. 5b,c). A498 and ACHN cells showed grade IV malignancy and produced high levels of TNF‐α (56.7 and 41.9 pg/mL), which correlated with greater invasiveness (262 and 179 cells/field, respectively). In contrast, Caki‐1 cells, which were grade III and 786‐O cells, which were grade II, produced low levels of TNF‐α (6.5 and 9 pg/mL) and this correlated with lower invasiveness (122 and 76 cells/field). Therefore, TNF‐α production was positively correlated with the invasion ability of RCC cells, and the different invasive phenotypes of the RCC cells were irrespective of the VHL genotypic status.
Figure 5.
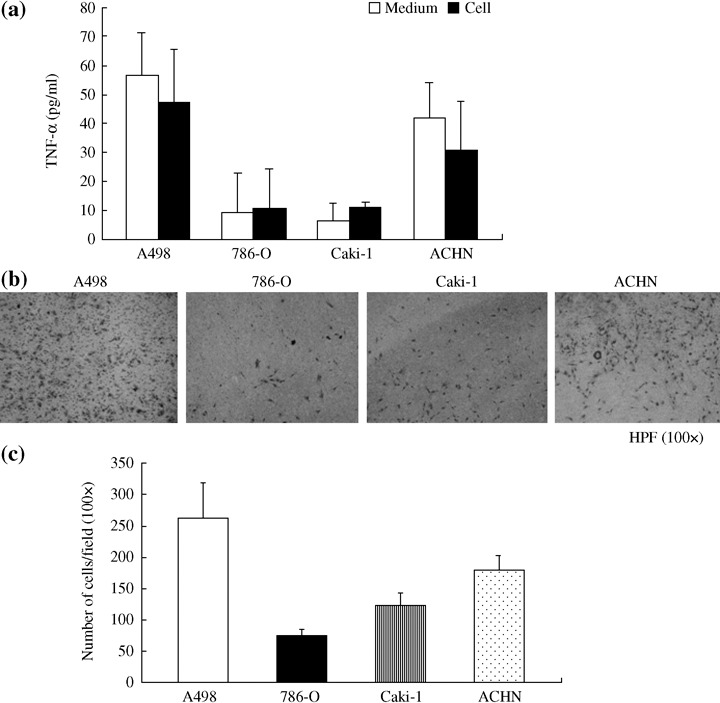
The correlation between tumor necrosis factor‐alpha (TNF‐α) secretion and cell invasiveness. (a) The levels of TNF‐α in the cells and cultured supernatants were determined by ELISA. The results represent the mean ± SD of cell‐free cultured supernatants and cell lysates (50 µg). (b) RCC cell lines (A498, 786‐O, Caki‐1, and ACHN) were seeded 3 × 10⁴ cells to the upper side of Matrigel‐coated insert and attracted by completed cultured medium (10% fetal bovine serum) for 24 h. Cells penetrated to the lower surface were counted under a microscope at 100 × magnification. (c) Ten fields were counted per filter in each group. Values are the mean ± SD of duplicate determinations.
TNF‐α promoted invasion ability and the epithelial‐mesenchymal transition of RCC. In order to further prove that TNF‐α induced invasive effects on RCC cells, we added different concentrations of recombinant TNF‐α into 786‐O conditioned medium (Fig. 6). The 786‐O cells penetrating to the lower chamber were significantly increased by the addition of TNF‐α in a dose‐dependent manner. Furthermore, the invasion of A498 cells was also potentiated by TNF‐α (data not shown). Next, in order to investigate the molecular mechanism of TNF‐α‐mediated invasion ability of RCC cells, we examined the effects of TNF‐α on the EMT and MMP activity, which are both well‐known mechanisms responsible for cancer metastasis. TNF‐α treatment resulted in down‐regulation of the epithelial marker E‐cadherin and increasing expression of the mesenchymal marker vimentin (Fig. 7a) in a time‐dependent manner. Expression of E‐cadherin transcriptional repressors, Slug, and ZEB1, were up‐regulated at 12, 24, and 48 h by TNF‐α treatment (Fig. 7b). In addition, MMP9, but not MMP2, activity was dramatically enhanced in the cells treated with TNF‐α (Fig. 7c). These results indicate that TNF‐α plays an essential role in the regulation of the invasion of RCC cells through the induction of EMT and MMP activity.
Figure 6.

The motility of 786‐O cell attracted by tumor necrosis factor‐alpha (TNF‐α) as a dose‐dependent manner. (a) 786‐O cells (3 × 10⁴ cells) were coated with Matrigel on the upper side of the filter and different concentrations of TNF‐α (5, 15, and 50 ng/mL in 7 CM) or conditioned medium collected from 786‐O (7 CM) were placed in the lower chamber for invasion assay. Following incubation for 24 h, invading cells were stained and counted under a microscope at 100 × magnification. (b) Each bar represents the mean ± SD of 10 fields of each group from three independent experiments where significant differences from control are represented by asterisks. (*P < 0.05, **P < 0.01).
Figure 7.
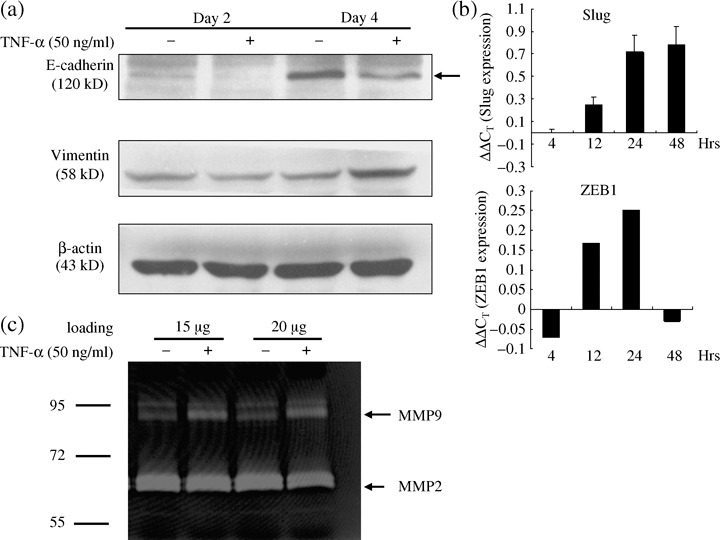
Tumor necrosis factor‐alpha (TNF‐α) induced epithelial to mesenchymal transition in renal cell carcinoma cells. (a) 786‐O cells were treated with TNF‐α (50 ng/mL) for 2 or 4 days. The total protein (60 µg) of cells were immunoblotted with anti‐E‐cadherin, anti‐vimentin, and β‐actin antibodies. (b) 786‐O cells were treated with TNF‐α (50 ng/mL) for different time, and the expression of Slug, ZEB1, and GAPDH were detected by reverse transcription–quantitative polymerase chain reaction (RT‐qPCR). (c) 786‐O cells were treated with TNF‐α (50 ng/mL) for 24 h and matrix metalloproteinase (MMP) activities in the cultured supernatants were detected by gelatin zymography. Different protein concentrations of culture supernatants were loaded. The experiment was repeated three separate times.
Discussion
Inflammation is an intricate biological response that involves complicated interactions between different cell types and is mediated by a plethora of cytokines and chemokines. Normal inflammation is usually self‐limiting. However, dysregulated inflammation has been suggested to be critical to tumor progression.( 3 , 11 ) The balance between cytokines and chemokines contributes to different neoplastic outcomes. Tumors that produce little in the way of cytokines or an overabundance of anti‐inflammatory cytokines show limited inflammation and vascularization, and this results in restricted tumor growth. In contrast, tumors that produce abundant proinflammatory chemokines undergo neovascularization and rapid tumor growth.( 3 ) Therefore, tumor progression can be attributed to persistent and unresolved inflammation. One of the key molecules mediating the inflammatory processes that contribute to tumor progression is TNF‐α.( 12 )
The major source of TNF‐α is activated macrophages. TNF‐α can also be produced by a variety of other cells, including fibroblasts, astrocytes, Kupffer cells, smooth muscle cells, keratinocytes, and tumor cells. TNF‐α released from cancer and stromal cells can trigger various types of mediator synthesis, including reactive oxygen intermediates, nitric oxide synthase, cyclooxygenase, MMP, cell adhesion molecules, and cytokines.( 12 ) TNF‐α also induces expression of the chemokine CXCR4, which may contribute to the dissemination of ovarian cancer.( 13 ) Additionally, TGF‐β‐induced EMT is accelerated by TNF‐α in a human colorectal cancer model.( 14 ) MCF10A immortalized breast epithelial cells chronically exposed to TNF‐α exhibit the EMT‐like phenotype.( 15 ) In RCC, inflammatory reactions are correlated with a poor patient prognosis. The serum TNF‐α levels in RCC patients are significantly higher at each progression stage of RCC.( 6 , 7 ) It has also been found that the TNF‐α‐308 G/G genotype is found at higher frequency in the patients with kidney cancer.( 16 ) Furthermore, TNF‐α and its receptors (TNFR) have been detected in normal and RCC cells. Infliximab, a chimeric antihuman TNF‐α antibody, has been an effective for therapy of RCC patients in two phase II studies.( 17 ) In addition, the expression of TNFRI was also detected in 786‐O and A498 RCC cells by using RT‐PCR (data not shown). However, the detailed molecular mechanism of TNF‐α involvement in RCC tumor progression remains unknown. In present study, we have demonstrated that tumor‐derived TNF‐α is the major cytokine that promotes invasion and EMT of RCC. TNF‐α was not only overexpressed in RCC cells with high malignant potential but there was also increased secretion into the conditioned medium. Thus, chronic TNF‐α production by tumor cells sustained tumor promotion and progression in kidney cancer.
In addition to TNF‐α, IL‐1β, and IL‐6 were also higher in the serum of patients with RCC and might contribute to the chronic inflammatory tumor microenvironment. IL‐6 is known to be an autocrine growth factor for RCC and may be one factor indicating a poor prognosis.( 6 , 7 ) Increased production of IL‐6 in RCC is partially due to p53 mutations.( 18 ) In addition, plasma membrane‐associated sialidase (NEU3) activated by IL‐6 may contribute to the expression of a malignant phenotype in RCC.( 19 ) However, truncated IL‐6 with antagonist properties has been found in RCC.( 20 ) Even though the IL‐6 blood level was significantly higher in patients with lymph node invasion and distant metastases, there was only a 14% reduction of invasion after removal of IL‐6 from the supernatant of advanced RCC in the present study (Fig. 4). On the other hand, the major source of IL‐6 in RCC may be the stromal cells. These results suggest that RCC cancer cells show enhanced invasion ability in the presence of increased levels of cytokines, especially TNF‐α. The increased cytokines can be either secreted by the RCC cancer cells themselves in an autocrine manner or obtain by them from the tumor microenviroments by a paracrine pathway.
MMPs proteolytically degrade components of the extracellular matrix and participate in the remodeling of basement membranes and extracellular matrix during normal and abnormal angiogenesis. MMPs are generally abundantly expressed in virtually all human cancers.( 21 ) Expression of MMPs in tumors has been correlated with invasion capacity, metastasis, and the risk of recurrence.( 22 ) In RCC, increased expression of the MMP2 and MMP9 proteins correlates with poor prognostic variables.( 23 ) Furthermore, in RCC, MMP9 appears to be regulated at the transcriptional level, whereas MMP2 is regulated at the post‐transcriptional level.( 24 ) Poor survival with a high frequency of metastases in ccRCC is associated with MMP9 activity.( 25 , 26 ) Thus, MMP9 may be a candidate predictor of disease‐free survival in RCC.( 24 ) In this study, tumor‐derived MMP2 was constitutively highly expressed and was involved in invasion by RCC (3, 7). MMP9 mRNA and activity secreted by RCC was shown to be time‐dependently promoted by TNF‐α and may be also involved in the development of RCC (Figs 7 and data not shown). Therefore, both MMP2 and MMP9 would seem to be engaged in the promotion and progression of RCC.
Chemokines comprise a family of small secreted proteins that act in either a paracrine or autocrine fashion. Chemokines exhibit pleiotropic effects on immunity, regulate angiogenesis, and mediate organ‐specific metastases of cancer.( 4 , 27 ) In this study, CCL2 expression were significantly elevated in A498 compared to 786‐O cells (data not shown). CCL2 expression has been found to correlate with tumor progression in breast cancer and esophageal squamous‐cell carcinoma.( 28 , 29 ) In a xenograft model of human melanoma, a low level of CCL2 resulted in tumor growth. In contrast, a high level of CCL2 secretion by the melanoma cells induced tumor destruction.( 30 ) Moreover, high serum levels of CCL2 were a good prognostic indicator and were associated with a lower proliferative index in patients undergoing surgical resection of pancreatic cancers.( 31 ) Therefore, although immunodepletion of CCL2 from ACM had no effect on the invasion of RCC (Fig. 3), the role of CCL2 in tumorigenesis of RCC needs further investigation.
Clear cell renal carcinoma is characterized by a mutation of the VHL gene. The VHL protein forms a complex with elongin and Cul‐2 to target HIF‐1α and ‐2α for ubiquitin‐mediated degradation.( 32 ) HIF is a key transcriptional regulator of angiogenesis by hypoxia.( 33 ) In the absence of the wild‐type VHL protein, HIF‐α accumulates and is able to dimerize with HIF‐β, and the pair transcriptionally activates many genes, including VEGF, EGFR, PDGF, GLUT‐1 glucose transporter, and TGF‐α.( 1 , 2 , 34 ) HIF‐1β plays a predominant role in VEGF secretion in RCC cells. However, a loss of HIF‐1β protein expression is a common event in RCC cell lines. This is associated not only with truncated HIF‐1α mRNA transcripts but also with transcriptional silencing. Therefore, the HIF‐2α protein regulates VEGF production in these RCC cells.( 35 ) These results are shown in Figure 1, which suggests that HIF‐1α expression is different between A498 and 786‐O, but that VEGF and TGF did not differ. In addition, HIF‐1 has been found to contribute to the EMT in VHL‐null RCC by indirect repression of E‐cadherin gene.( 36 ) Thus, the role of HIF‐2 in the TNF‐α‐induced EMT of 786‐O cells is under investigation.
Well‐differentiated epithelial cells possess extensive junctional networks and restricted motility. E‐adherin represents the best‐characterized molecular marker expressed in the epithelial cells and regulates the establishment of the adherens junctions. In contrast to well‐differentiated epithelial cells, mesenchymal cells do not establish stable intercellular junctions. Mesenchymal cells have increased vimentin and cytoskeletal proteins to facilitate pseudopod formation, cytoskeletal remodeling, and cell invasiveness.( 8 , 9 ) For most carcinoma, progression toward malignancy is accompanied by loss of epithelial differentiation and a shift towards a mesenchymal phenotype.( 10 ) Although there are several lines of evidence to suggest that many invasive and metastatic carcinoma have not undergone a complete transition to a mesenchymal phenotype, EMT represents a fundamentally important process conducive to dissemination and metastatic spread.( 37 ) In this study, we demonstrated that TNF‐α directly increased transcriptional repressors to down‐regulate E‐cadherin and promote vimentin expression (Fig. 7). As a result, up‐regulated EMT and MMP9 activity were correlated with the increased invasion ability of RCC induced by TNF‐α (Fig. 6).
In summary, in this study a combination of an invasion assay, different grades of RCC, and immunodepletion formed a successful strategy to identify the tumor‐derived factors that affect the progression of RCC. TNF‐α, IL‐1, IL‐6, and MMP2 were secreted by advanced RCC cells, and these factors were demonstrated to promote invasion by low grade RCC. Tumor‐derived TNF‐α was the major factor that correlated with malignancy and this protein was involved in the EMT of kidney cancer. Understanding the roles of pro‐inflammatory cytokines in the process of tumor promotion will assist in the development of novel cancer therapeutics for use against RCC.
Acknowledgments
This work was supported in part by grants from the National Science Council (95–2320‐B‐010‐022‐MY3), Yen Tjing Ling Medical Research Foundation (CI 95‐8) and Taipei City Hospital, ROC.
References
- 1. Linehan WM, Vasselli J, Srinivasan R et al . Genetic basis of cancer of the kidney: disease‐specific approaches to therapy. Clin Cancer Res 2004; 10: 6282s–9s. [DOI] [PubMed] [Google Scholar]
- 2. Cohen HT, McGovern FJ. Renal‐cell carcinoma. New Eng J Med 2005; 353: 2477–90. [DOI] [PubMed] [Google Scholar]
- 3. Coussens LM, Werb Z. Inflammation and cancer. Nature 2002; 420: 860–7. [DOI] [PMC free article] [PubMed] [Google Scholar]
- 4. Balkwill F. Cancer and the chemokine network. Nature Rev 2004; 4: 540–50. [DOI] [PubMed] [Google Scholar]
- 5. Johrer K, Zelle‐Rieser C, Perathoner A et al . Up‐regulation of functional chemokine receptor CCR3 in human renal cell carcinoma. Clin Cancer Res 2005; 11: 2459–65. [DOI] [PubMed] [Google Scholar]
- 6. Yoshida N, Ikemoto S, Narita K et al . Interleukin‐6, tumor necrosis factor α and interleukin‐1β in patients with renal cell carcinoma. Br J Cancer 2002; 86: 1396–400. [DOI] [PMC free article] [PubMed] [Google Scholar]
- 7. Dosquet C, Schaetz A, Faucher C et al . Tumor necrosis factor‐α, interleukin‐1β and interleukin‐6 in patients with renal cell carcinoma. Eur J Cancer 1994; 30: 162–7. [DOI] [PubMed] [Google Scholar]
- 8. Thiery JP, Sleeman JP. Complex networks orchestrate epithelial‐mesenchymal transitions. Nature Rev 2006; 7: 131–42. [DOI] [PubMed] [Google Scholar]
- 9. Lee JM, Dedhar S, Kalluri R, Thompson EW. The epithelial‐mesenchymal transition: new insights in signaling, development and disease. J Cell Biol 2006; 172: 973–81. [DOI] [PMC free article] [PubMed] [Google Scholar]
- 10. Thiery JP. Epithelial‐mesenchymal transitions in tumor progression. Nature Rev 2002; 2: 442–54. [DOI] [PubMed] [Google Scholar]
- 11. Karin M. Inflammation and cancer. the long reach of Ras. Nature Med 2005; 11: 20–1. [DOI] [PubMed] [Google Scholar]
- 12. Szlosarek P, Charles KA, Balkwill FR. Tumor necrosis factor‐α as a tumor promoter. Eur J Cancer 2006; 42: 745–50. [DOI] [PubMed] [Google Scholar]
- 13. Kulbe H, Hagemann T, Szlosarek PW, Balkwill FR, Wilson JL. The inflammatory cytokine tumor necrosis factor‐α regulates chemokine receptor expression on ovarian cancer cells. Cancer Res 2005; 65: 10355–62. [DOI] [PubMed] [Google Scholar]
- 14. Bates RC, Mercurio AM. Tumor necrosis factor‐α stimulates the epithelial‐to‐mesenchymal transition of human colonic organoids. Mol Biol Cell 2003; 14: 1790–800. [DOI] [PMC free article] [PubMed] [Google Scholar]
- 15. Chua HL, Bhat‐Nakshatri P, Clare SE et al . NF‐kB represses E‐cadherin expression and enhances epithelial to mesenchymal transition of mammary epithelial cells: potential involvement of ZEB‐1 and ZEB‐2. Oncogene 2007; 26: 711–24. [DOI] [PubMed] [Google Scholar]
- 16. Basturk B, Yavascaoglu I, Vuruskan H, Goral G, Oktay B, Oral HB. Cytokine gene polymorphisms as potential risk and protective factors in renal cell carcinoma. Cytokine 2005; 30: 41–5. [DOI] [PubMed] [Google Scholar]
- 17. Harrison ML, Obermueller E, Maisey NR et al . Tumor necrosis factors as a new target for renal cell carcinoma: two sequential phase II trials of infliximab at standard and high dose. J Clin Oncol 2007; 25: 4542–9. [DOI] [PubMed] [Google Scholar]
- 18. Angelo LS, Talpaz M, Kurzrock R. Autocrine interleukin‐6 production in renal cell carcinoma: evidence for the involvement of p53. Cancer Res 2002; 62: 932–40. [PubMed] [Google Scholar]
- 19. Ueno S, Saito S, Wada T et al . Plasma membrane‐associated sialidase is up‐regulated in renal cell carcinoma and promotes interleukin‐6‐induced apoptosis suppression and cell motility. J Biol Chem 2006; 281: 7756–64. [DOI] [PubMed] [Google Scholar]
- 20. Alberti L, Bachelot T, Duc A, Biota C, Blay JY. A spliced isoform of interleukin 6 mRNA produced by renal cell carcinoma encodes for an interleukin 6 inhibitor. Cancer Res 2005; 65: 2–5. [PubMed] [Google Scholar]
- 21. Rundhaug JE. Matrix metalloproteinases and angiogenesis. J Cell Mol Med 2005; 9: 267–85. [DOI] [PMC free article] [PubMed] [Google Scholar]
- 22. Vihinen P, Kahari V‐M. Matrix metalloproteinases in cancer: prognostic markers and therapeutic targets. Int J Cancer 2002; 99: 157–66. [DOI] [PubMed] [Google Scholar]
- 23. Kallakury BVS, Karikehalli S, Haholu A et al . Increased expression of matrix metalloproteinases 2 and 9 and tissue inhibitors of metalloproteinases 1 and 2 correlate with poor prognostic variables in renal cell carcinoma. Clin Cancer Res 2001; 7: 3113–9. [PubMed] [Google Scholar]
- 24. Cho NH, Shim HS, Rha SY et al . Increased expression of matrix metalloproteinase 9 correlates with poor prognostic variables in renal cell carcinoma. 2003; 44: 560–6. [DOI] [PubMed] [Google Scholar]
- 25. Kawata N, Nagane Y, Hirakata H et al . Significant relationship of matrix metalloproteinase 9 with nuclear grade and prognostic impact of tissue inhibitor of metalloproteinase 2 for incidental clear cell renal cell carcinoma. Urology 2007; 69: 1049–53. [DOI] [PubMed] [Google Scholar]
- 26. Kawata N, Nagane Y, Igarashi T et al . Strong significant correlation between MMP‐9 and systemic symptoms in patients with localized renal cell carcinoma. Urology 2006; 68: 523–7. [DOI] [PubMed] [Google Scholar]
- 27. Strieter RM, Burdick MD, Gomperts BN, Belperio JA, Keane MP. CXC chemokines in angiogenesis. Cytokine Growth Factor Rev 2005; 16: 593–608. [DOI] [PubMed] [Google Scholar]
- 28. Saji H, Koike M, Yamori T et al . Significant correlation of monocyte chemoattractant protein‐1 expression with neovascularization and progression of breast carcinoma. Cancer 2001; 92: 1085–91. [DOI] [PubMed] [Google Scholar]
- 29. Ohta M, Kitadai Y, Tanaka S et al . Monocyte chemoattractant protein‐1 expression correlation with macrophage infiltration and tumor vascularity in human esophageal squamous cell carcinoma. Int J Cancer 2002; 102: 220–4. [DOI] [PubMed] [Google Scholar]
- 30. Nesbit M, Schaider H, Miller TH, Herlyn M. Low‐level monocyte chemoattractant protein‐1 stimulation of monocytes leads to tumor formation in nontumorigenic melanoma cells. J Immunol 2001; 166: 6483–90. [DOI] [PubMed] [Google Scholar]
- 31. Monti P, Leone BE, Marchesi F et al . The CC chemokine MCP‐1/CCL2 in pancreatic cancer progression: regulation of expression and potential mechanisms of antimalignant activity. Cancer Res 2003; 63: 7451–61. [PubMed] [Google Scholar]
- 32. Ivan M, Kaelin WG Jr. The von Hippel‐Lindau tumor suppressor protein. Curr Opin Genet Dev 2001; 11: 27–34. [DOI] [PubMed] [Google Scholar]
- 33. Pugh CW, Ratcliffe PJ. Regulation of angiogenesis by hypoxia: role of the HIF system. Nature Med 2003; 9: 677–84. [DOI] [PubMed] [Google Scholar]
- 34. Linehan WM, Zbar B. Focus on kidney cancer. Cancer Cell 2004; 6: 223–8. [DOI] [PubMed] [Google Scholar]
- 35. Shinojima T, Oya M, Takayanagi A et al . Renal cancer cells lacking hypoxia inducible factor (HIF)‐1α expression maintain vascular endothelial growth factor expression through HIF‐2α. Carcinogenesis 2007; 28: 529–36. [DOI] [PubMed] [Google Scholar]
- 36. Krishnamachary B, Zagzag D, Nagasawa H et al . Hypoxia‐inducible factor‐1‐dependent repression of E‐cadherin in von Hippel‐Lindau tumor suppressor‐null renal cell carcinoma mediated by TCF3, ZFHX1A and ZFHX1B. Cancer Res 2006; 66: 2725–31. [DOI] [PubMed] [Google Scholar]
- 37. Christiansen JJ, Rajasekaran AK. Reassessing epithelial to mesenchymal transition as a prerequisite for carcinoma invasion and metastasis. Cancer Res 2006; 66: 8319–26. [DOI] [PubMed] [Google Scholar]