Abstract
The suppressor of cytokine signaling (SOCS) proteins, negative regulators of interferon (IFN)‐induced signaling pathways, is involved in IFN resistance of tumor cells. To improve the growth inhibitory effect of IFN‐β and IFN‐γ on a murine melanoma cell line, B16‐BL6, and a murine colon carcinoma cell line, Colon26 cells, SOCS‐1 and SOCS‐3 gene expression in tumor cells was downregulated by transfection of plasmid DNA expressing short hairpin RNA targeting one of these genes (pshSOCS‐1 and pshSOCS‐3, respectively). Transfection of pshSOCS‐1 significantly increased the antiproliferative effect of IFN‐γ on B16‐BL6 cells. However, any other combinations of plasmids and IFN had little effect on the growth of B16‐BL6 cells. In addition, transfection of pshSOCS‐1 and pshSOCS‐3 produced little improvement in the effect of IFN on Colon26 cells. To understand the mechanism underlining these findings, the level of SOCS gene expression was measured by real time polymerase chain reaction. Addition of IFN‐γ greatly increased the SOCS‐1 mRNA expression in B16‐BL6 cells. Taking into account the synergistic effect of pshSOCS‐1 and IFN‐γ on the growth of B16‐BL6 cells, these findings suggest that IFN‐γ‐induced high SOCS‐1 gene expression in B16‐BL6 cells significantly interferes with the antiproliferative effect of IFN‐γ. These results indicate that silencing SOCS gene expression can be an effective strategy to enhance the antitumor effect of IFN under conditions in which the SOCS gene expression is upregulated by IFN. (Cancer Sci 2008; 99: 1650–1655)
Cytokine‐supported tumor immunotherapy is one of the most promising strategies for cancer therapy.( 1 ) Interferons (IFN) and other cytokines are important therapeutic cytokines that exert antitumor activity against a variety of tumor cells,( 2 , 3 , 4 ) and some of them have already been used as anticancer agents in clinical practice. We have shown that IFN‐based cancer gene therapy is an effective approach to suppressing tumor cell growth in mice.( 4 ) Furthermore, sustained expression of IFN was shown to be highly effective in inhibiting experimental pulmonary metastasis of colon carcinoma cells.( 5 )
One of the major problems associated with cytokine‐supported tumor immunotherapy is the development of cytokine resistance, which has often been observed in cytokine‐based tumor therapy. Resistance of tumor cells to cytokines has been reported for interleukin‐6 (IL‐6),( 6 ) transforming growth factor‐β1,( 7 ) IFN( 8 ) and tumor necrosis factor‐α.( 9 ) Because these cytokines induce various changes in tumor cells, cytokine resistance could be the consequence of changes in protein expression.
The suppressor of cytokine signaling (SOCS) proteins compose a family of negative regulators of cytokine signaling that inhibit cytokine action by inhibiting the Janus kinases (JAK)/signal transducer and activators of transcription factor (STAT) pathways.( 10 ) SOCS gene expression is also regulated by the cytokine signaling pathway, and the induced SOCS proteins work as a negative feedback mechanism to protect cells from excess activation of cytokine signaling. Up to now, eight structurally‐related SOCS family members have been identified. Of those, SOCS‐1 and SOCS‐3 have been well‐characterized, and are the most potent negative regulators of the signals induced by IFN family proteins and IL‐6.( 11 ) Recently, a high level of SOCS‐1 and SOCS‐3 gene expression was observed in tumor cells compared with normal cells, and the level of SOCS‐1 expression in primary melanomas correlated well with their invasion level. Moreover, it has been found that a forced expression of SOCS‐3 in chronic myelogenous leukemia cells and T‐cell lymphoma cells endowed them with resistance to IFN‐α‐mediated growth inhibition.( 12 , 13 ) These lines of evidence suggest that a high level of SOCS‐1 or SOCS‐3 gene expression in tumor cells may be the key issue in the cytokine resistance.
In the present study, overcoming IFN resistance of tumor cells was examined by downregulating SOCS‐1 or SOCS‐3 gene expression using RNA interference (RNAi), a post‐transcriptional gene silencing event in which small interfering RNA (siRNA) degrade target mRNA in a sequence‐specific manner.( 14 , 15 , 16 ) Short hairpin RNA (shRNA)‐expressing plasmid DNA (pDNA), not siRNA, was selected because shRNA‐expressing pDNA produce a more sustained gene silencing effect than siRNA (Yuki Takahashi et al., unpublished data, 2007). The results of IFN treatment following the transfection of pDNA expressing shRNA targeting SOCS‐1 or SOCS‐3 provided experimental evidence that increased SOCS gene expression is associated with IFN resistance in tumor cells, and that silencing SOCS gene expression can be a promising strategy to enhance the sensitivity of tumor cells to IFN‐mediated growth inhibition.
Materials and Methods
Plasmid DNA and IFN shRNA‐expressing pDNA driven by human U6 promoter were constructed from the piGENE hU6 vector (iGENE Therapeutics, Tsukuba, Japan) according to the manufacturer's instructions. Target sites in the murine genes encoding SOCS‐1 and SOCS‐3 were as follows: SOCS‐1 for sites 1–3 were 5′‐CTACCTGAGTTCCTTCCCC‐3′, 5′‐GCCAGGACCTGAATTCCAC‐3′ and 5′‐GACCTGAATTCCACTCCTA‐3′, respectively; SOCS‐3 for sites 1–3 were 5′‐GGGGAATCTTCAAACTTTC‐3′, 5′‐GGCAGGACCTGGAATTCGT‐3′ and 5′‐GAAGAGAGCTATACTGGTG‐3′, respectively. These pDNA transcribe stem loop‐type RNA with loop sequences of ACG UGU GCU GUC CGU. pshLuc and pshGFP, shRNA‐expressing pDNA targeting firefly luciferase mRNA and GFP mRNA were constructed as reported previously.( 17 ) The empty piGENE hU6 vector was used as a control pDNA throughout the present study.
pGL4.74 (hRluc/TK) (phRL‐TK), a pDNA that expresses sea pansy luciferase under the control of herpes simplex virus TK promoter, was purchased from Promega (Madison, WI, USA). Three copies of the IFN stimulation response element (ISRE) (5′‐CGAAGTACTTTCAGTTTCATATTAGG‐3′) were subcloned into the Bgl II/Hind III site of pLuc‐MCS (Stratagene, La Jolla, CA, USA) to construct an IFN responsive reporter pDNA, pISRE‐Luc.
Each pDNA was amplified in the DH5α strain of Escherichia coli and purified using a Qiagen Endofree Plasmid Giga Kit (Qiagen, Hilden, Germany).
Mouse IFN‐β and ‐γ were kind gifts from Dr Yoshihiko Watanabe (Graduate School of Pharmaceutical Sciences, Kyoto University).
Cell culture. A murine melanoma cell line, B16‐BL6, a murine lung carcinoma cell line, LLC, and a murine colon carcinoma cell line, Colon26, were obtained from the Cancer Chemotherapy Center of the Japanese Foundation for Cancer Research (Tokyo, Japan). A murine myoblast cell line, C2C12, was obtained from the RIKEN Cell Bank (Ibaraki, Japan). A murine dendritic cell line, DC2.4, was a gift from Dr Kenneth Rock (Department of Pathology, University of Massachusetts Medical School, MA, USA).( 18 ) A murine renal cell carcinoma cell line, Renca, a murine bladder tumor cell line, MBT‐2, a murine neuroblastoma cell line, and SA1, a murine Fibrosarcoma cell line, were kind gifts from Dr Yoshihiko Watanabe, Kyoto University. Colon26 and DC2.4 cells were cultured in RPMI‐1640 medium supplemented with 10% fetal bovine serum (FBS) and penicillin/streptomycin/L‐glutamine (PSG) at 37°C and 5% CO2. The other cell lines were cultured in Dulbecco's modified Eagle's minimum essential medium (Nissui Pharmaceutical, Tokyo, Japan) supplemented with 10% FBS and PSG at 37°C and 5% CO2.
In vitro transfection. Cells were plated on culture plates and incubated overnight. Transfection of pDNA was performed using Lipofectamine 2000 (Invitrogen, Carlsbad, CA, USA) according to the manufacturer's instructions. In brief, 1 µg pDNA was mixed with 3 µg Lipofectamine 2000 at a final concentration of 2 µg pDNA/mL, and the resulting complex was added to the cells.
mRNA quantification. Total RNA was isolated using MagExtractor MFX‐2100 and a MagExtractor RNA kit (Toyobo, Osaka, Japan) following the manufacturer's protocol. To eliminate DNA contamination, the total RNA was treated with DNase I (Takara Bio, Otsu, Japan) prior to reverse transcription (RT). RT was performed using a SuperScript II (Invitrogen) and dT‐primer following the manufacturer's protocol. For quantitative mRNA expression analysis, real time polymerase chain reaction (PCR) was carried out with total cDNA using a LightCycler instrument (Roche Diagnostics, Basel, Switzerland). The sequences of the primers used for amplification were as follows: glyceraldehyde 3‐phosphate dehydrogenase (GAPDH) forward, 5′‐CTGCCAAGTATGATGACATCAAGAA‐3′, reverse, 5′‐ACCAGGAAATGAGCTTGACA‐3′; SOCS‐1 forward, 5′‐GTGGTTGTGGAGGGTGAGAT‐3′, reverse, 5′‐CCCAGACACAAGCTGCTACA‐3′; and SOCS‐3 forward, 5′‐AAGGGAGGCAGATCAACAGA‐3′, reverse, 5′‐TGGGACAGAGGGCATTTAAG‐3′. Amplified products were detected online via intercalation of the fluorescent dye SYBR green (LightCycler‐FastStart DNA Master SYBR Green I kit, Roche Diagnostics). The cycling conditions were as follows: initial enzyme activation at 95°C for 10 min, followed by 55 cycles at 95°C for 10 s, 60°C for 5 s and 72°C for 15 s. Gene‐specific fluorescence was measured at 72°C. The mRNA expression of target genes was normalized by using the mRNA level of GAPDH.
IFN‐dependent reporter gene expression assay. Tumor cells seeded on culture plates were transfected with pISRE‐Luc (0.8 µg/mL), phRL‐TK (0.2 µg/mL) and a control pDNA, pshSOCS‐1, pshSOCS‐3 or pshGFP (1 µg/mL) using Lipofectamine 2000 as described above. Four hours after transfection, cells were washed with PBS and further incubated with the culture medium supplemented with or without the indicated concentration of IFN‐β or IFN‐γ for an additional 20 h. Then, cells were lysed with Promega Passive Lysis Buffer. Samples were mixed with a Dual‐Luciferase Reporter System (Promega) and the chemiluminescence produced was measured in a luminometer (Lumat LB9507, EG and G Berthold, Bad Wildbad, Germany). Firefly luciferase activity was used as an indicator of ISRE‐dependent transcription, and sea pansy luciferase activity was used to normalize the transfection efficiency. The ratios of the IFN‐added cells were normalized to give x‐fold values relative to those of the unstimulated group cultured in the absence of IFN.
Growth inhibition of tumor cells by IFN. B16‐BL6 and Colon26 cells were plated on 24‐well culture plates (at a density of 1 × 10³ cells/well and 2 × 10³ cells/well, respectively). The medium was replaced with growth medium containing IFN‐β (10, 102, 103 IU/mL) or IFN‐γ (100, 10, 102, 103 IU/mL) and cultured for 5 days. The number of cells was evaluated by MTT assay as described previously.( 19 )
To evaluate the IFN‐mediated growth inhibitory effect on cells subjected to shRNA‐expressing pDNA transfection, cells were harvested by trypsinization at 24 h after the transfection and plated again at a density of 1 × 10⁴ cells/well on new 24‐well plates, and treated with the indicated concentrations of IFN for 4 days, and cell numbers were determined by MTT assay.
Statistical analysis. Differences were statistically evaluated by Student's t‐test. P < 0.05 was considered to be statistically significant.
Results
mRNA expression of SOCS‐1 and SOCS‐3 in murine cell lines. Quantitative RT‐PCR was performed to determine the mRNA expression levels of SOCS‐1 and SOCS‐3 in tumor cell lines, B16‐BL6 and Colon26 cells, and in normal cell lines, DC2.4 and C2C12 cells. As shown in Fig. 1(a), the constitutive mRNA expression level of SOCS‐1 in Colon26 was higher than those in the other cell lines. SOCS‐1 mRNA expression in DC2.4 cells was much lower than that in the other cell lines. The constitutive mRNA expression level of SOCS‐3 in Colon26 and C2C12 cells were higher than those in B16‐BL6 and DC2.4 cells (Fig. 1b).
Figure 1.
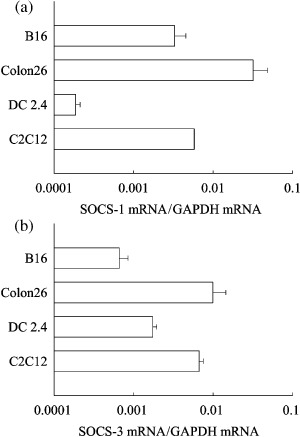
mRNA expression of SOCS‐1 and SOCS‐3 in murine cell lines. (a) SOCS‐1 and (b) SOCS‐3 mRNA in B16‐BL6, Colon26, DC2.4 or C2C12 cells was determined by quantitative reverse transcription polymerase chain reaction. The results are expressed as the mean ± standard deviation of three independent determinations. GAPDH, glyceraldehyde 3‐phosphate dehydrogenase.
Sensitivity of B16‐BL6 and Colon26 cells to IFN‐β and IFN‐γ. To investigate the growth inhibitory effects of IFN‐β and IFN‐γ on B16‐BL6 and Colon26 cells, cells were added with various concentrations of IFN and cultured for 5 consecutive days. Without addition of IFN, the proliferation rates of B16‐BL6 cells and Colon26 cells were not significantly different to each other. Both IFN‐β and IFN‐γ inhibited the proliferation of B16‐BL6 and Colon26 cells in a concentration‐dependent manner (Fig. 2). B16‐BL6 cells required higher concentrations of IFN for the inhibition compared with Colon26 cells, indicating that B16‐BL6 cells are more resistant to IFN‐mediated growth inhibition than Colon26 cells.
Figure 2.
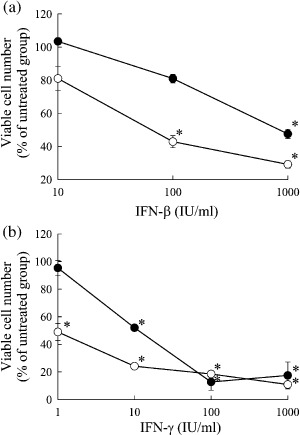
Anti‐proliferative effect of interferons (IFN) against tumor cells. B16‐BL6 ( ) and Colon26 (
 ) cells plated on 24‐well culture plates (at a density of 1 × 10³ cells/well and 2 × 10³ cells/well, respectively) were cultured with the indicated concentrations of (a) IFN‐β or (b) IFN‐γ for 5 days. The number of cells were evaluated by MTT assay. The results are expressed as the mean ± standard deviation of three independent determinations. *P < 0.05 for Student's t‐test compared with the cells cultured with no IFN.
Silencing of SOCS gene expression for the enhancement of growth inhibitory effect of IFN. Transfection of B16‐BL6 and Colon26 cells with shRNA‐expressing pDNA reduced the corresponding target gene expression at the mRNA level (Fig. 3). For each target gene, one of the shRNA‐expressing pDNA was selected for the following studies based on the inhibitory effect in the real‐time PCR analysis (site 1 for SOCS‐1 and site 2 for SOCS‐3, respectively), and named pshSOCS‐1 and pshSOCS‐3, respectively.
Figure 3.
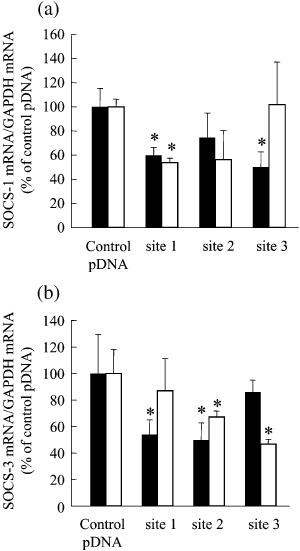
Effect of transfection of tumor cells with shRNA‐expressing plasmid DNA (pDNA) on SOCS mRNA expression. Tumor cells seeded on culture plates were transfected with control plasmid DNA (pDNA), pshLuc, pshSOCS‐1 (sites 1, 2 and 3) or pshSOCS‐3 (sites 1, 2 and 3). Three different sequences in the SOCS‐1 gene (site 1, CTACCTGAGTTCCTTCCCC; site 2, GCCAGGACCTGAATTCCAC; site 3, GACCTGAATTCCACTCCTA) and in the SOCS‐3 gene (site 1, GGGGAATCTTCAAACTTTC; site 2, GGCAGGACCTGGAATTCGT; site 3, GAAGAGAGCTATACTGGTG) were targeted. (a) SOCS‐1 and (b) SOCS‐3 mRNA in B16‐BL6 ( ) and Colon26 (
 ) cells was determined 48 h after transfection. The results are expressed as the mean percentage ± standard deviation (percentage of the control group) of three independent determinations. *P < 0.05 for Student's t‐test compared with their corresponding control groups. GAPDH, glyceraldehyde 3‐phosphate dehydrogenase.
Because we found that transfection of pshSOCS‐1 and pshSOCS‐3 reduces the target gene expression, the effects of SOCS gene silencing on the antiproliferative effect of IFN were examined. To this end, IFN‐β or IFN‐γ were added to the cell medium 2 days after the transfection of shRNA‐expressing pDNA. The number of viable cells was determined by MTT assay 4 days after the initiation of IFN treatment (Fig. 4). Transfection of Colon26 cells with pshSOCS‐1 or pshSOCS‐3 induced no significant changes in the number of cells treated with IFN. On the other hand, transfection of B16‐BL6 cells with pshSOCS‐1 inhibited the proliferation of IFN‐γ‐treated cells, whereas transfection with pshSOCS‐3 hardly affected the proliferation of IFN‐γ‐treated cells. The antiproliferative effect of IFN‐β on B16‐BL6 cells was not improved by transfection of any of the shRNA‐expressing pDNA.
Figure 4.
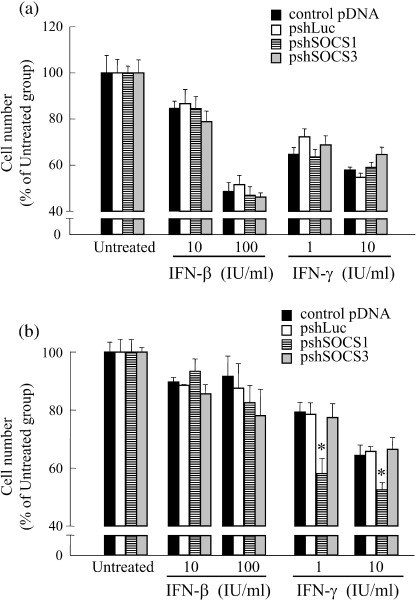
Anti‐proliferative effect of interferons (IFN) against tumor cells transfected with short hairpin (shRNA)‐expressing plasmid DNA (pDNA). Tumor cells seeded on culture plates were transfected with control pDNA, pshLuc, pshSOCS‐1 or pshSOCS‐3. One day after transfection, cells were reseeded on new 24‐well culture plates at a density of 1 × 10⁴ cells/well. Twenty‐four hours after reseeding, cells were washed with phosphate‐buffered saline, followed by addition of the indicated concentrations of IFN and cultured for a further 4 days. The numbers of (a) Colon26 and (b) B16‐BL6 cells were evaluated by MTT assay. The results are expressed as the mean ± standard deviation of four independent determinations. *P < 0.05 for Student's t‐test compared with other groups treated with the same concentration of IFN.
To examine whether silencing SOCS gene expression is effective in enhancing the antiproliferative activity of IFN in other cell lines than B16‐BL6, similar experiments to those in Fig. 4 were performed using various types of tumor cell lines (Table 1). Silencing of SOCS‐1 gene expression was effective in enhancing the antiproliferative activity of IFN‐γ on LLC, Renca and MBT‐2 cells and that of IFN‐β on Renca and MBT‐2 cells. In addition, silencing of SOCS‐3 gene expression was effective in enhancing antiproliferative activity of IFN‐γ on Renca and SA1 cells and that of IFN‐β on Renca cells.
Table 1.
Effect of interferons (IFN) on the proliferation of tumor cells transfected with short hairpin RNA (shRNA)‐expressing plasmid DNA (pDNA)
| Cell line | Origin | pDNA | IFN‐β (IU/mL) | IFN‐γ (IU/mL) | ||
|---|---|---|---|---|---|---|
| 10 | 100 | 1 | 10 | |||
| LLC | Lung carcinoma | Control pDNA | 107.8 ± 15.2 | 81.1 ± 10.7 | 95.0 ± 3.5 | 90.2 ± 4.7 |
| pshSOCS1 | 98.0 ± 3.0 | 74.9 ± 3.8 | 84.0 ± 1.2* | 83.6 ± 2.4* | ||
| pshSOCS3 | 101.6 ± 1.9 | 78.3 ± 3.3 | 95.8 ± 0.7 | 86.8 ± 2.0 | ||
| Renca | Renal cell carcinoma | Control pDNA | 48.8 ± 3.4 | 44.2 ± 5.4 | 50.8 ± 4.8 | 42.1 ± 4.5 |
| pshSOCS1 | 30.0 ± 5.3* | 29.9 ± 0.9* | 31.8 ± 6.9* | 21.5 ± 5.2* | ||
| pshSOCS3 | 29.1 ± 0.6* | 25.4 ± 1.8* | 27.5 ± 2.6* | 13.6 ± 2.4* | ||
| MBT‐2 | Bladder tumor | Control pDNA | 73.2 ± 3.2 | 45.2 ± 0.8 | 96.8 ± 6.0 | 88.1 ± 6.3 |
| pshSOCS1 | 62.9 ± 0.8* | 39.2 ± 0.5* | 83.2 ± 2.2* | 77.2 ± 4.7* | ||
| pshSOCS3 | 79.5 ± 1.3* | 50.1 ± 0.4* | 96.9 ± 0.9 | 91.9 ± 1.7 | ||
| SA1 | Fibrosarcoma | Control pDNA | 41.5 ± 6.0 | 27.1 ± 8.2 | 34.7 ± 4.9 | 31.6 ± 9.3 |
| pshSOCS1 | 47.0 ± 4.6 | 27.2 ± 3.5 | 30.9 ± 3.7 | 35.1 ± 4.8 | ||
| pshSOCS3 | 51.9 ± 19.8 | 24.1 ± 4.7 | 20.2 ± 3.1* | 18.1 ± 2.0* | ||
Tumor cells were treated in a similar manner to that described in the legend of Fig. 4. The results are expressed as the mean percentage of untreated group ± standard deviation of six independent measurements. *P < 0.05 for Student's t‐test compared with the control pDNA and IFN‐treated group.
IFN‐induced increase in SOCS gene expression in B16‐BL6 and Colon26 cells. To examine whether SOCS gene expression is upregulated in tumor cells by addition of IFN, we measured the amount of SOCS mRNA in B16‐BL6 and Colon26 cells incubated with indicated concentrations of IFN for 24 h. A quantitative RT‐PCR analysis revealed that addition of IFN‐γ greatly increased the SOCS‐1 mRNA expression in B16‐BL6 cells (Fig. 5). In contrast, the SOCS‐3 mRNA expression in B16‐BL6 cells and SOCS‐1 and SOCS‐3 mRNA expression in Colon26 cells showed only moderate changes, less than fivefold of the untreated values.
Figure 5.
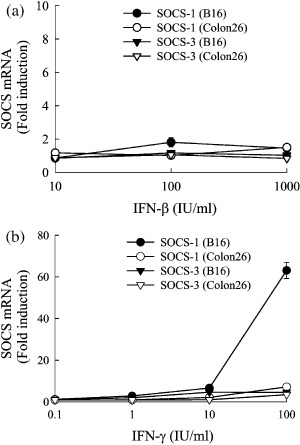
Effect of interferons (IFN) on SOCS mRNA expression in tumor cells. B16‐BL6 or Colon26 cells seeded on 12‐well culture plates (at a density of 2 × 10⁵ cells/well) were cultured with indicated concentrations of (a) IFN‐β or (b) IFN‐γ for 24 h. SOCS‐1 and SOCS‐3 mRNA in tumor cells was determined by quantitative reverse transcription polymerase chain reaction and the x‐fold induction compared with untreated cells was calculated. The results are expressed as the mean ± standard deviation of three independent determinations.
Increase in ISRE‐dependent gene expression by silencing SOCS‐1 gene expression. The IFN signaling pathway recruits several transcription factors that bind to the ISRE, and this binding leads to the activation of the transcription of ISRE‐controlled genes. Transfection of pISRE‐Luc, pDNA expressing firefly luciferase under the control of ISRE, and the following luciferase assay were used to assess the degree of activation of the IFN signaling pathway in the cells. Thus, B16‐BL6 and Colon26 cells were co‐transfected with pLuc‐ISRE, phRL‐TK and one of the shRNA‐expressing pDNA: control pDNA, pshSOCS‐1, pshSOCS‐3 or pshGFP. Then, cells were incubated with the indicated concentration of IFN.
Addition of IFN‐β or IFN‐γ to Colon26 cells increased the ISRE‐dependent firefly luciferase activity to approximately 1.5‐ and 3‐fold of the untreated values, respectively (Fig. 6). Colon26 cells transfected with any of the shRNA‐expressing pDNA showed almost an identical ability to increase the ISRE‐dependent luciferase expression by IFN.
Figure 6.
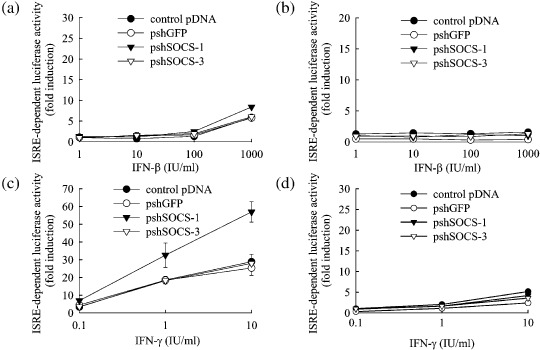
Effect of transfection of tumor cells with short hairpin RNA (shRNA)‐expressing plasmid DNA (pDNA) on interferon (IFN)‐induced ISRE‐dependent transgene expression. (a,c) B16‐BL6 or (b,d) Colon26 cells were transfected with pISRE‐Luc, phRL‐TK and one of the following: control pDNA, pshGFP, pshSOCS‐1 or pshSOCS‐3. Four hours after transfection, cells were washed with phosphate‐buffered saline, followed by addition of the indicated concentrations of (a,b) IFN‐β and (c,d) IFN‐γ and cultured for a further 20 h. Then, the luciferase activities of cell lysate were measured and the x‐fold induction in luciferase activity compared with untreated cells was calculated. The results are expressed as the mean ± standard deviation of three independent determinations. *P < 0.05 for Student's t‐test compared with other groups treated with the same concentration of IFN.
In B16‐BL6 cells transfected with control pDNA, pshGFP or pshSOCS‐3, addition of IFN‐β and IFN‐γ increased the ISRE‐dependent luciferase activity to approximately 5‐ and 20‐fold of the untreated value, respectively. On the other hand, in pshSOCS‐1‐transfected B16 cells, ISRE‐dependent luciferase expression was increased to approximately 8‐ and 50‐fold of the unstimulated value by the addition of IFN‐β and IFN‐γ, respectively, indicating that the IFN‐dependent gene expression in B16‐BL6 cells was greatly increased by the transfection of pshSOCS‐1.
Discussion
An increasing number of studies have demonstrated the roles of SOCS in cytokine signaling, including the immune suppression and cytokine resistance of tumor cells. Sakai et al. reported that a forced expression of SOCS‐3 in a leukemia cell line renders the cells resistant to the antiproliferative effect of IFN‐α.( 12 ) Zitzmann et al. recently showed that silencing SOCS‐1 expression in neuroendocrine tumor cells enhanced the antitumor activity of IFN‐α and IFN‐β.( 20 ) The present study investigated whether suppressing SOCS‐1 or SOCS‐3 gene expression in tumor cells can enhance the antiproliferative effect of IFN‐β and INF‐γ on tumor cells. Although the efficiency of gene silencing was moderate in both B16‐BL6 and Colon26 cells (Fig. 3), we obtained significant effects on the antiproliferative effect of IFN (Fig. 4 and Table 1) and activation of ISRE‐dependent luciferase expression in B16 cells (Fig. 6) by silencing SOCS‐1 and SOCS‐3 gene expression, suggesting no further reduction was necessary to obtain the silencing effects. In the present study, IFN‐resistant cell lines were not used, because a previous report by Fleischmann et al. demonstrated that an artificial IFN‐resistant B16 cell line showed an increased sensitivity to IFN when inoculated into mice.( 21 )
Of the murine cell lines used, Colon26 cells showed higher levels of SOCS mRNA expression compared with B16‐BL6 cells and several types of normal cells (Fig. 1). However, the SOCS gene expression was greatly increased by IFN in B16‐BL6 cells compared with that in Colon26 cells (Fig. 5). Combining these data with the fact that B16‐BL6 cells were more resistant to the growth inhibitory effect of IFN than Colon26 cells, these results strongly support the following two suggestions: (i) IFN‐induced SOCS gene expression is one of the most important factors for IFN resistance of tumor cells; and (ii) the constitutive SOCS gene expression level is not always correlated with the IFN resistance. Recently, Fojtova et al. found that melanoma cells which are resistant to the antitumor effect of IFN‐γ were different from IFN‐sensitive melanoma cells in terms of the constitutive and induced levels of SOCS gene expression.( 22 ) IFN‐resistant cells had a high constitutive level of SOCS‐3 gene expression and weak SOCS‐1 and SOCS‐3 induction by IFN‐γ. In the present study, we have clearly shown that IFN‐mediated induction of SOCS gene expression was greater in the IFN‐resistant B16‐BL6 cells than in the IFN‐sensitive Colon26 cells. Although Fojtova et al. concluded that a constitutively high level of SOCS‐3 gene expression is a major reason for the resistance of tumor cells to the antitumor effect of IFN,( 22 ) our results suggest that the constitutive level of SOCS gene expression is of little importance. In contrast to the study by Fojtova et al., we showed that the IFN‐induced SOCS‐1 expression, not the constitutive SOCS‐1 expression, is a key factor determining the enhancement of the antiproliferative activity of IFN by silencing SOCS‐1 expression. Use of IFN‐resistant and sensitive cells with the same cell line may underscore the importance of the inductive level of SOCS gene expression.
The IFN‐dependent antitumor effect is initiated by the binding of IFN to their cognate receptors followed by phosphorylation of STAT proteins, recruitment of transcription factors and the expression of IFN‐dependent gene products. Tumor cells have been reported to become resistant to IFN by reducing the number of IFN receptors on their cell surface, inhibiting STAT phosphorylation or expressing genes that exhibit neutralizing effects on IFN‐dependent gene products.( 23 ) One of the frequently observed characteristics of IFN‐resistant tumor cells is the reduced phosphorylation of STAT proteins after IFN stimulation.( 24 , 25 ) Although these previous studies made no mention of the relationship between SOCS and IFN resistance, they suggest the involvement of SOCS in IFN resistance because SOCS proteins are inhibitors of STAT phosphorylation. Involvement of an induced SOCS gene expression in the inhibition of IFN signaling has recently been reported by Evans et al. who showed that IFN‐γ‐induced SOCS‐1 gene expression terminated the activation of IFN signaling in breast cancer cells through the inhibition of STAT phosphorylation.( 26 ) These results are in good agreement with the findings of our present study, in which SOCS‐1 gene expression in B16 cells was markedly induced by IFN‐γ and silencing the SOCS‐1 gene expression enhanced the antiproliferative effect of IFN‐γ. In addition, an antiproliferative effect of IFN should be exerted by IFN‐dependent gene products, the expression cassette of which usually contains the ISRE sequence.( 27 ) Therefore, we used pISRE‐Luc, a plasmid‐expressing firefly luciferase under the control of ISRE, to examine whether IFN signaling is upregulated in pshSOCS‐1‐transfected B16 cells. Luciferase assay of cells clearly demonstrated that only pshSOCS‐1 increased ISRE‐dependent luciferase expression in the IFN‐γ‐treated‐B16‐BL6 cells (Fig. 6). However, we found a discrepancy between the antiproliferative activity and induction in ISRE‐dependent luciferase expression by IFN. As the reason for this discrepancy, we speculate less sensitivity of the luciferase‐dependent reporter assay in Colon26 cells. In our previous study investigating the relationship between hypoxia and tumor metastasis, we found that hypoxia‐responsible luciferase expression in Colon26 cells was induced by hypoxia less than that in B16‐BL6 cells despite the fact that vascular endothelial growth factor, a hypoxia‐responsible endogenous product, was almost equally induced by hypoxia in both cells.( 28 ) Therefore, the ISRE‐dependent luciferase assay may underestimate the endogenous ISRE‐dependent gene expression in Colon26 cells. Our result showing that SOCS‐1 plays an important role in IFN resistance in B16 melanoma cells is also in agreement with previous results reported by Li et al. who showed that melanoma cells express SOCS‐1 protein whereas normal melanocytes do not.( 29 ) These authors concluded that SOCS‐1 is a progression marker of melanoma and may downregulate cytokine‐induced biological responses. However, they did not directly investigate the role of SOCS‐1 gene expression in melanoma cells in cytokine resistance and tumor progression. Contrary to this previous report, we confirmed that SOCS knockdown is an effective approach to improving the therapeutic potency of IFN against a variety type of tumor cells.
In conclusion, we found that RNAi‐mediated silencing of SOCS‐1 gene expression in tumor cells enhances the growth inhibitory effect of IFN‐γ under conditions where the SOCS‐1 expression is upregulated by IFN‐γ. Thus, silencing of the SOCS‐1 expression offers a promising approach to optimizing IFN‐based cancer therapy.
Acknowledgments
This work was supported in part by Grants‐in‐Aid for Scientific Research from the Ministry of Education, Science, Sports and Culture of Japan, by grants from the Ministry of Health, Labor and Welfare of Japan and by a Grant‐in‐Aid for Exploratory Research from the Japan Society for the Promotion of Sciences (JSPS). We are grateful to Dr Yoshihiko Watanabe (Department of Molecular Microbiology, Graduate School of Pharmaceutical Sciences, Kyoto University) for his kind gift of mouse IFN‐β, IFN‐γ and cell lines, helpful guidance and discussions.
References
- 1. Pestka S. The interferons: 50 years after their discovery, there is much more to learn. J Biol Chem 2007; 282: 20 047–51. [DOI] [PubMed] [Google Scholar]
- 2. Oritani K, Kincade PW, Zhang C, Tomiyama Y, Matsuzawa Y. Type I interferons and limitin. A comparison of structures, receptors, and functions. Cytokine Growth Factor Rev 2001; 12: 337–48. [DOI] [PubMed] [Google Scholar]
- 3. Grassegger A, Höpfl R. Significance of the cytokine interferon gamma in clinical dermatology. Clin Exp Dermatol 2004; 29: 584–8. [DOI] [PubMed] [Google Scholar]
- 4. Kobayashi N, Kuramoto T, Chen S, Watanabe Y, Takakura Y. Therapeutic effect of intravenous interferon gene delivery with naked plasmid DNA in murine metastasis models. Mol Ther 2002; 6: 737–44. [DOI] [PubMed] [Google Scholar]
- 5. Kawano H, Nishikawa M, Mitsui M et al . Improved anti‐cancer effect of interferon gene transfer by sustained expression using CpG‐reduced plasmid DNA. Int J Cancer 2007; 121: 401–6. [DOI] [PubMed] [Google Scholar]
- 6. Lu C, Kerbel RS. Interleukin‐6 undergoes transition from paracrine growth inhibitor to autocrine stimulator during human melanoma progression. J Cell Biol 1993; 120: 1281–8. [DOI] [PMC free article] [PubMed] [Google Scholar]
- 7. Rodeck U, Bossler A, Graeven U et al . Transforming growth factor β production and responsiveness in normal human melanocytes and melanoma cells. Cancer Res 1994; 54: 575–81. [PubMed] [Google Scholar]
- 8. Wong LH, Krauer KG, Hatzinisiriou I et al . Interferon‐resistant human melanoma cells are deficient in ISGF3 components, STAT1, STAT2, and p48‐ISGF3γ. J Biol Chem 1997; 272: 28 779–85. [DOI] [PubMed] [Google Scholar]
- 9. Korobko EV, Saschenko LP, Prockhorchouk EB, Korobko IV, Gnuchev NV, Kiselev SL. Resistance to tumor necrosis factor induced apoptosis in vitro correlates with high metastatic capacity of cells in vivo . Immunol Lett 1999; 67: 71–6. [DOI] [PubMed] [Google Scholar]
- 10. Hanada T, Yoshimura A. Regulation of cytokine signaling and inflammation. Cytokine Growth Factor Rev 2002; 13: 413–21. [DOI] [PubMed] [Google Scholar]
- 11. Kubo M, Hanada T, Yoshimura A. Suppressors of cytokine signaling and immunity. Nat Immunol 2003; 4: 1169–76. [DOI] [PubMed] [Google Scholar]
- 12. Sakai I, Takeuchi K, Yamauchi H, Narumi H, Fujita S. Constitutive expression of SOCS3 confers resistance to IFN‐α in chronic myelogenous leukemia cells. Blood 2002; 100: 2926–31. [DOI] [PubMed] [Google Scholar]
- 13. Brender C, Lovato P, Sommer VH et al . Constitutive SOCS‐3 expression protects T‐cell lymphoma against growth inhibition by IFNα. Leukemia 2005; 19: 209–13. [DOI] [PubMed] [Google Scholar]
- 14. Zamore PD, Tuschl T, Sharp PA, Bartel DP. RNAi: double‐stranded RNA directs the ATP‐dependent cleavage of mRNA at 21–23 nucleotide intervals. Cell 2000; 101: 25–33. [DOI] [PubMed] [Google Scholar]
- 15. Tuschl T, Zamore PD, Lehmann R, Bartel DP, Sharp PA. Targeted mRNA degradation by double‐stranded RNA in vitro . Genes Dev 1999; 13: 3191–7. [DOI] [PMC free article] [PubMed] [Google Scholar]
- 16. Hammond SM, Bernstein E, Beach D, Hannon GJ. An RNA‐directed nuclease mediates post‐transcriptional gene silencing in Drosophila cells. Nature 2000; 404: 293–6. [DOI] [PubMed] [Google Scholar]
- 17. Takahashi Y, Nishikawa M, Kobayashi N, Takakura Y. Gene silencing in primary and metastatic tumors by small interfering RNA delivery in mice: quantitative analysis using melanoma cells expressing firefly and sea pansy luciferases. J Controlled Release 2005; 105: 332–43. [DOI] [PubMed] [Google Scholar]
- 18. Yoshinaga T, Yasuda K, Ogawa Y, Takakura Y. Efficient uptake and rapid degradation of plasmid DNA by murine dendritic cells via a specific mechanism. Biochem Biophys Res Comms 2002; 299: 389–94. [DOI] [PubMed] [Google Scholar]
- 19. Supino R. MTT assays. Meth Mol Biol (Clifton, NJ) 1995; 43: 137–49. [DOI] [PubMed] [Google Scholar]
- 20. Zitzmann K, Brand S, De Toni EN et al . SOCS1 silencing enhances antitumor activity of type I IFNs by regulating apoptosis in neuroendocrine tumor cells. Cancer Res 2007; 67: 5025–32. [DOI] [PubMed] [Google Scholar]
- 21. Fleischmann CM, Stanton GJ, Fleischmann WR Jr. Enhanced in vivo sensitivity to interferon with in vitro resistant B16 tumor cells in mice. Cancer Immunol Immunotherapy 1994; 39: 148–54. [DOI] [PMC free article] [PubMed] [Google Scholar]
- 22. Fojtova M, Boudny V, Kovarik A et al . Development of IFN‐γ resistance is associated with attenuation of SOCS genes induction and constitutive expression of SOCS 3 in melanoma cells. Br J Cancer 2007; 97: 231–7. [DOI] [PMC free article] [PubMed] [Google Scholar]
- 23. Dunn GP, Koebel CM, Schreiber RD. Interferons, immunity and cancer immunoediting. Nat Rev Immunol 2006; 6: 836–48. [DOI] [PubMed] [Google Scholar]
- 24. Yamauchi H, Sakai I, Narumi H, Takeuchi K, Soga S, Fujita S. Development of interferon‐α resistant subline from human chronic myelogenous leukemia cell line KT‐1. Intern Med 2001; 40: 607–12. [DOI] [PubMed] [Google Scholar]
- 25. Lee J, Jung HH, Im YH et al . Interferon‐alpha resistance can be reversed by inhibition of IFN‐alpha‐induced COX‐2 expression potentially via STAT1 activation in A549 cells. Oncol Rep 2006; 15: 1541–9. [PubMed] [Google Scholar]
- 26. Evans MK, Yu CR, Lohani A et al . Expression of SOCS1 and SOCS3 genes is differentially regulated in breast cancer cells in response to proinflammatory cytokine and growth factor signals. Oncogene 2007; 26: 1941–8. [DOI] [PubMed] [Google Scholar]
- 27. Chawla‐Sarkar M, Lindner DJ, Liu YF et al . Apoptosis and interferons: role of interferon‐stimulated genes as mediators of apoptosis. Apoptosis 2003; 8: 237–49. [DOI] [PubMed] [Google Scholar]
- 28. Takahashi Y, Nishikawa M, Takakura Y. Inhibition of tumor cell growth in the liver by RNA interference‐mediated suppression of HIF‐1α expression in tumor cells and hepatocytes. Gene Ther 2008; 15: 572–82. [DOI] [PubMed] [Google Scholar]
- 29. Li Z, Metze D, Nashan D et al . Expression of SOCS‐1, suppressor of cytokine signalling‐1, in human melanoma. J Invest Dermatol 2004; 123: 737–45. [DOI] [PubMed] [Google Scholar]


