

Abstract
Insulin‐like growth factor II mRNA‐binding protein 3 (IMP3) has been reported to enhance proliferation and invasion in various cancers. The role of IMP3 on neuroblastoma (NB) is unknown. We aimed to clarify the prognostic significance of IMP3 expression in patients with NB. By microarray analysis, high IMP3 expression was found in patients with poor outcome. IMP3 expression in 90 NB samples was analyzed by immunohistochemical staining to correlate with clinical stages, histology, and patient outcome. Positive IMP3 expression was detected in 52 of 90 patients, and was significantly correlated with undifferentiated histology, advanced stages, MYCN amplification, and poor outcome. In subgroups, positive IMP3 expression could predict an even worse prognosis in patients with advanced disease, with normal MYCN status, or with MYCN amplification (P = 0.005, P = 0.001, and P = 0.033, respectively). The IMP3 expression decreased by induction of differentiation with retinoid acid treatment in SK‐N‐DZ and SK‐N‐SH cells in vitro. The invasion ability of NB cells also decreased as IMP3 knockdown by using RNA interference in vitro. In summary, high expression of IMP3 in NB might contribute to the undifferentiated phenotype and invasive behaviors, leading to a poor prognosis. Determining IMP3 expression in NB could help to improve a personalized therapy. (Cancer Sci 2011; 102: 2191–2198)
Neuroblastoma (NB), a common cancer of early childhood that originates from primitive sympathetic neural precursors, has a remarkable heterogeneity of clinical behaviors ranging from spontaneous regression to rapid progression and death. Therapeutic options are proposed according to the Children’s Oncology Group risk stratification criteria based on clinical and biological factors, including clinical stage, MYCN status, age at diagnosis, histology, and ploidy status.( 1 , 2 ) Treatment strategy, which ranges from observation alone to intensive multimodal therapy, depends on the risk stratification of the patient in one of the three subgroups of low‐, intermediate‐, and high‐risk of death. Although several biological and molecular prognostic factors have been identified, amplification of the MYCN oncogene, which occurs in roughly 20% of primary NB, is one of the most powerful prognostic factors in NB.( 3 ) The co‐opting neurotrophin pathways including the neurotrophin receptors (TrkA, TrkB, and TrkC) and their ligands (NGF, BDNF, and neurotrophin‐3, respectively), which regulate the differentiation, apoptosis, and growth of neural cells, are also important prognosis‐related factors in NB.( 4 ) However, some patients with a normal MYCN copy number still present with clinically aggressive progression similar to those with MYCN‐amplified tumors, suggesting that other unfavorable molecules determining inferior survival may exist.( 5 , 6 )
The insulin‐like growth factor II mRNA‐binding protein 3 (IMP3), also known as L532S or K homology domain‐containing protein overexpressed in cancer (KOC), is a member of the RNA‐binding protein family that includes IMP1, IMP2, and IMP3. The IMPs are primarily expressed during early embryogenesis and have been implicated in various post‐transcriptional functions, including mRNA localization, cell growth, and cell migration during early embryogenesis.( 7 , 8 ) The expression of IMP3 is low or undetectable in benign tissues.( 9 ) In Xenopus, the IMP3 orthologue Vg1‐RBP has been reported to promote migration of neural crest cells.( 10 ) Recently, IMP3 was found to increase proliferation and invasion as an oncofetal protein in various cancers including cancers of the pancreas, kidney, and lung.( 11 , 12 , 13 , 14 ) This evidence suggests that IMP3 is a potential biomarker of cancer progression and metastasis and could serve as a target molecule for cancer therapy.( 14 ) Until now, most studies of IMP3 have focused on carcinomas. The role of IMP3 in NB is unknown. In this study, we aimed to clarify the role and possible mechanism of IMP3 expression in NB.
Materials and Methods
Patients and tissues. This study was approved by the National Taiwan University Hospital Research Ethics Committee (Taipei, Taiwan). A total of 90 pediatric NB patients diagnosed and treated at the National Taiwan University Hospital between January 1991 and Jan 2010 were enrolled in this study. Patients identified by mass screening of urinary vanillylmandelic acid were excluded. Of 90 patients, 51 were male. The median age at diagnosis was 2.2 years (range, 0–11.5 years). Fifty‐six patients had primary tumors originated from the adrenal gland. According to the International NB Pathology Classification,( 15 , 16 ) patients were classified as undifferentiated NB (UNB, 45 cases), differentiating NB (DNB, including the poorly differentiated subtype, 23 cases), and ganglioneuroblastoma (GNB, 22 cases). Based on the International Neuroblastoma Staging System,( 17 ) nine patients had stage 1 tumors, 10 had stage 2 tumors, 13 had stage 3 tumors, 51 had stage 4 tumors, and seven had stage 4S tumors. MYCN amplification, as determined by FISH analysis of formalin‐fixed paraffin‐embedded tissues or fresh tumor single cells,( 18 , 19 ) was detected in 22 (24.4%) tumors. All patients with stage 1 tumors were treated with surgery alone, whereas others were treated with a combination of surgery and chemotherapy with or without autologous bone marrow transplantation according to the risk stratification on the guidelines of the Children’s Cancer Group.( 20 , 21 ) The details of the treatment protocol have been described elsewhere.( 21 )
Tissue oligonucleotide microarray. Among 90 NB samples, 22 were fresh tissues for oligonucleotide microarray analysis and 10 were MYCN amplified. Total RNA of fresh frozen NB tissues was isolated using TRIzol (Life Technologies, Invitrogen, Carlsbad, CA, USA) then extracted with the RNeasy Mini kit (Qiagen, Hilden, Germany) according to the manufacturer’s instructions. RNAs with an RNA integrity number value >7 or a 28S/18S ratio >2.0 were selected for further array analysis. For comparison, a human reference RNA pooled from 10 cell lines (Stratagene, Santa Clara, CA, USA) served as a common reference. Total RNA (0.5 μg) was amplified using a Low RNA Input Fluor Linear Amp kit (Agilent Technologies, Santa Clara, CA, USA) then labeled with Cy3 (reference RNA) or Cy5 (tumor RNA) during the in vitro transcription process (CyDye; PerkinElmer, Waltham, MA, USA). Cy‐labeled cRNA (2 μg) was fragmented to an average size of approximately 50–100 nt by incubation with fragmentation buffer at 60°C for 30 min. Correspondingly, fragmented labeled cRNA was then pooled and hybridized to the Human 1A (version 2) oligo microarray (Agilent Technologies) at 60°C for 17 h. After washing and drying using a nitrogen blow gun, the microarrays were scanned with an Agilent microarray scanner (Agilent Technologies) at 535 nm for Cy3 and 625 nm for Cy5. Scanned images were analyzed using the Feature extraction software (Agilent Technologies), an image analysis and normalization software used to quantify signal and background intensity for each feature and subsequently normalize the data by the rank consistency filtering LOWESS method. Only the features with a signal‐to‐noise ratio >2.6 in either the Cy3 or the Cy5 channel were retrieved for further analysis.
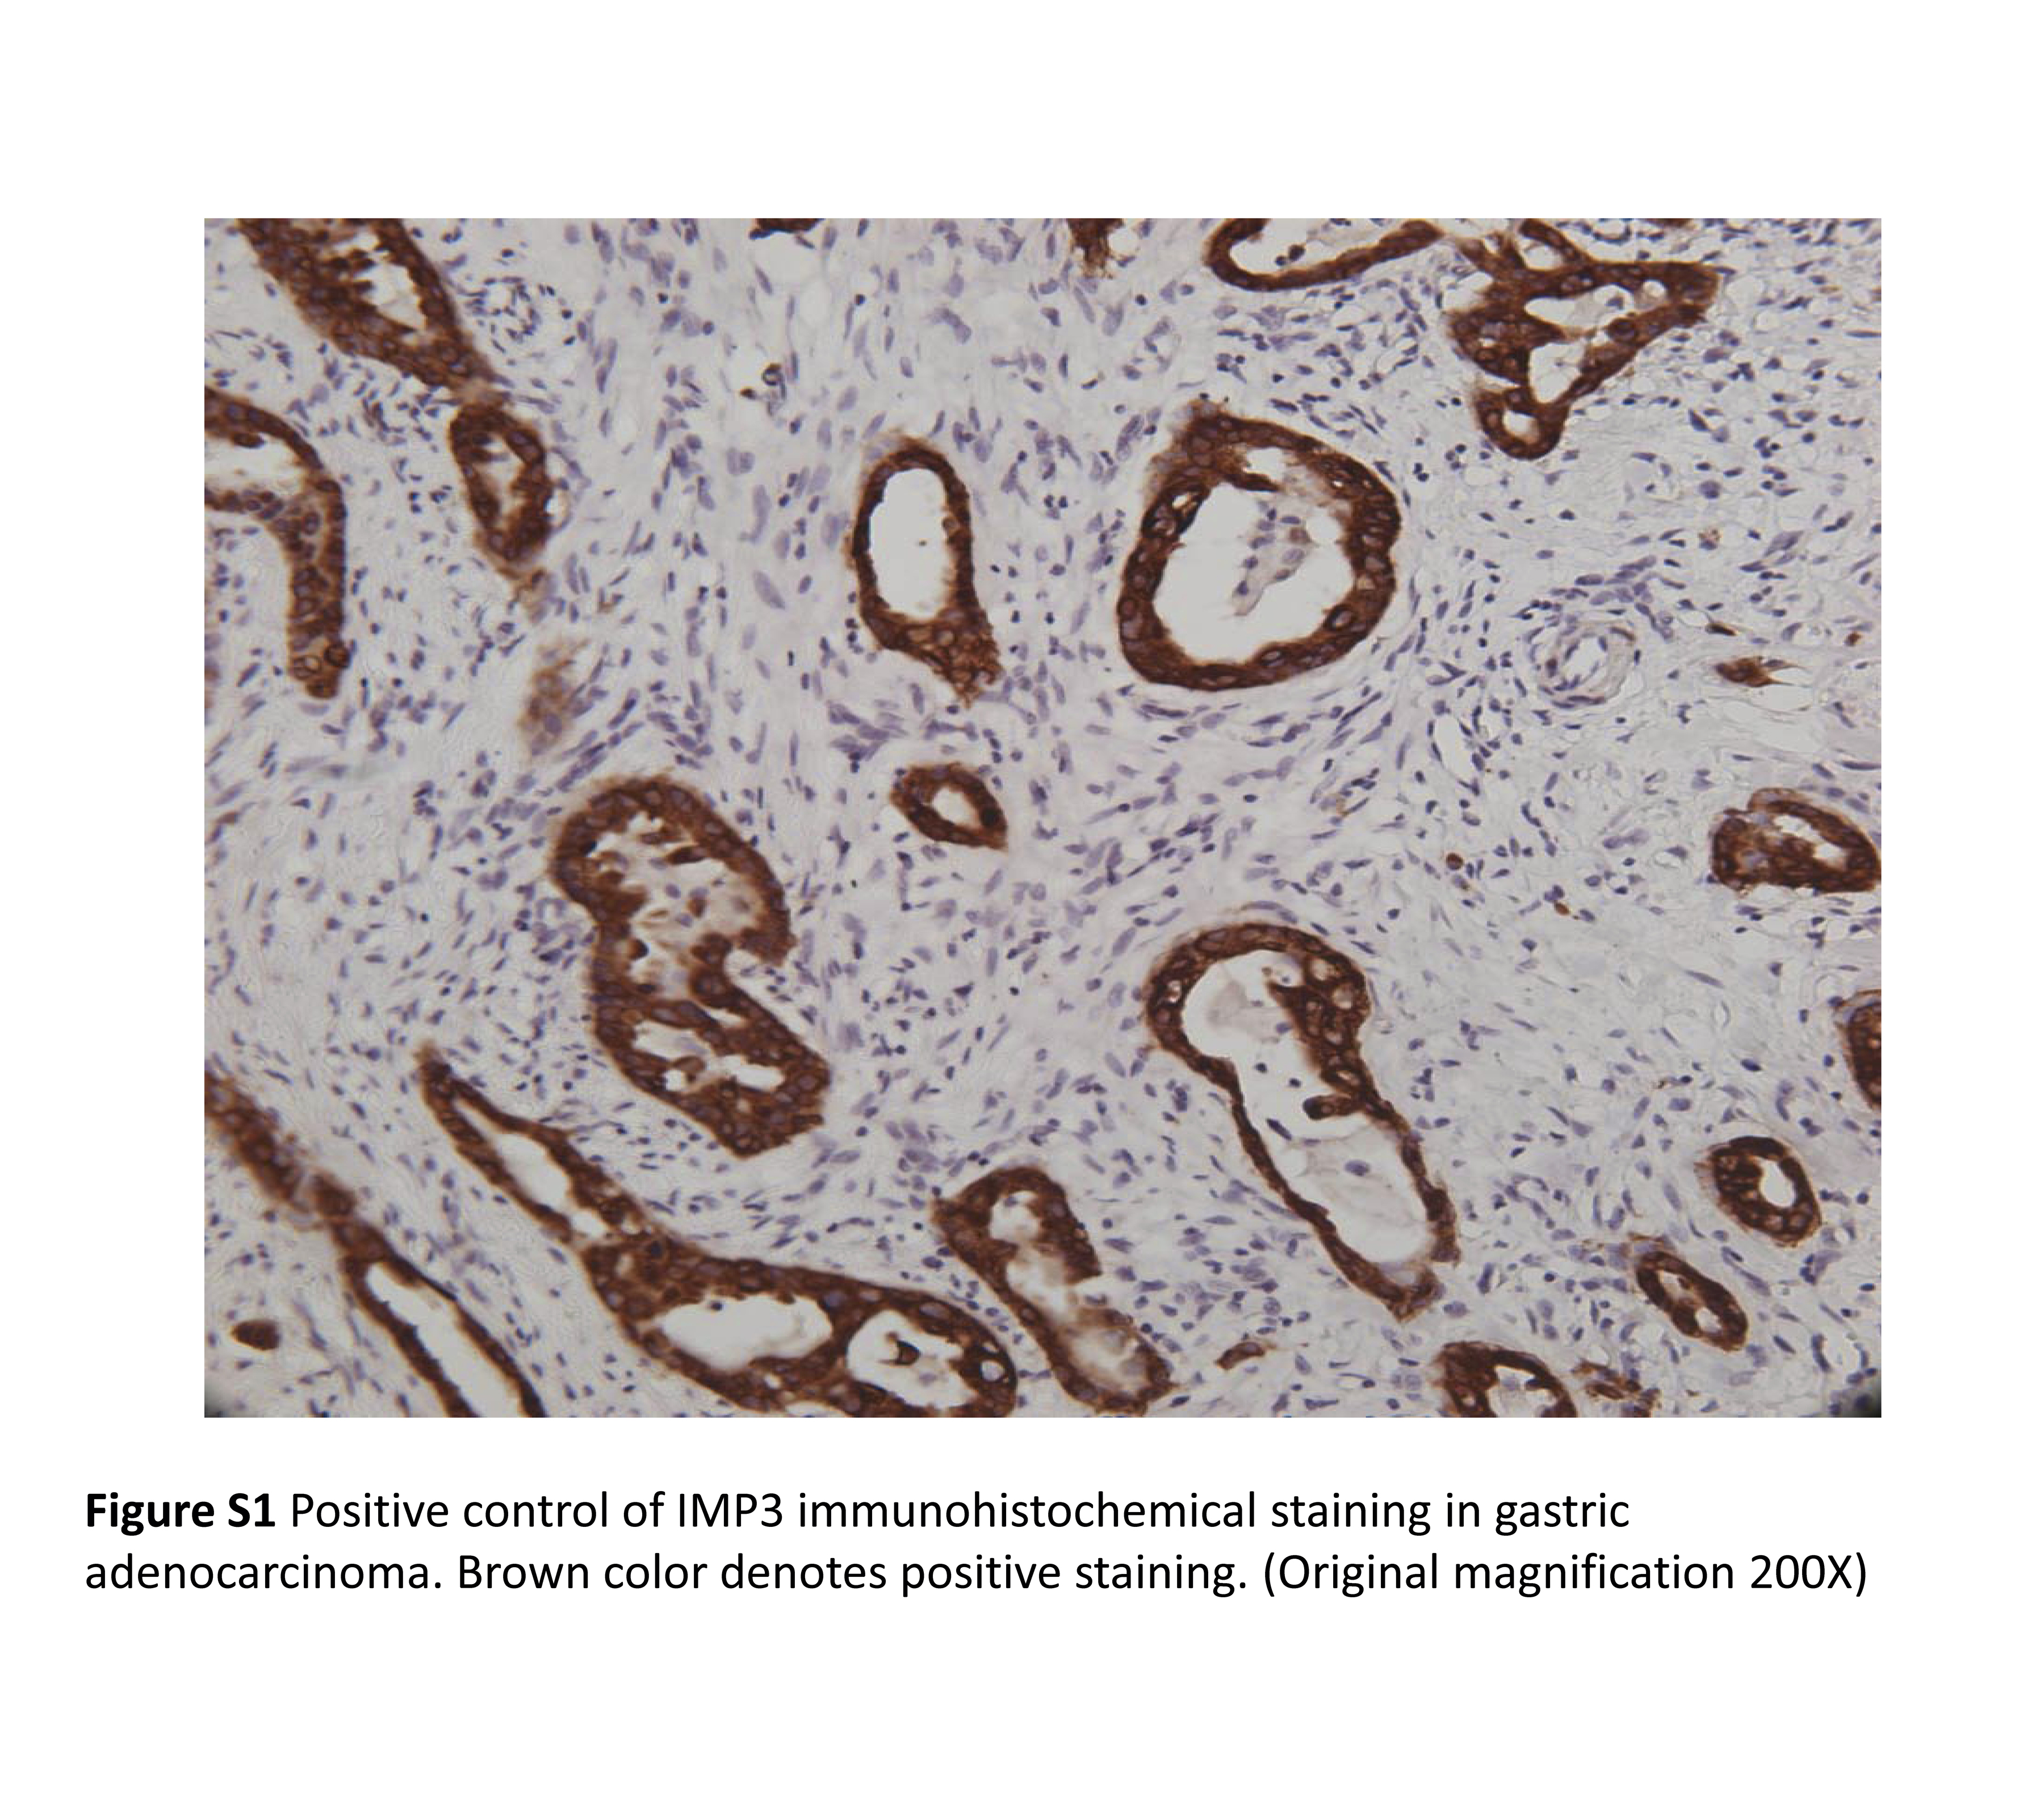
Immunohistochemical staining. All 90 NB samples were sent for immunohistochemical staining. Tissue sections were dewaxed and rehydrated for immunohistochemistry (IHC). Antigen retrieval was carried out by incubating the slides in 0.01 M citric acid buffer at 100°C for 10 min. After blocking with 3% H2O2 and 5% FBS, the slides were incubated with anti‐IMP3 mAb (Dako Cytomation, Carpinteria, CA, USA) at a dilution of 1:100. For negative control, 5% FBS was used instead of primary antibody. A specimen of gastric adenocarcinoma with consistent positive IMP3 immunostaining was used as positive control (Fig. S1) according to published reports.( 22 , 23 ) The staining results were evaluated by a pathologist (Y.M.J.) who was blind to the clinical background of the specimens. The immunoreactivity of IMP3 in NB tumors was classified into four categories: −, no expression, no stained cells or only isolated, single stained cells seen; 1+, weak expression, approximately 10–35% of cells stained; 2+, moderate expression, approximately 35–70% of cells stained; and 3+, strong expression, more than 70% of cells stained. Immunoreactivities of 1+ to 3+ were pooled as positive expression, in contrast to negative expression.
Quantitative real‐time PCR (Q‐PCR) analysis. To quantify the microarray analysis results, 22 tumor samples in microarray analysis were re‐confirmed by Q‐PCR. Another 19 fresh tumor samples from 90 tumor samples used in IMP3 immunohistochemical staining were also used to analyze the IMP3 mRNA expression by Q‐PCR in order to verify the results of IMP3 expression from immunostaining. The RNA expression levels of IMP3 in those 41 NB tissues and three normal adrenal glands from the patients were analyzed by Q‐PCR with the ABI PRISM 7000 Sequence Detection System (Applied Biosystems, Foster City, CA, USA) using the SYBR Green method. Total RNA was extracted by a Qiagen RNeasy Mini Kit (Qiagen, Valencia, CA, USA). The primers were purchased from Applied Biosystems and GAPDH served as internal control. Expression of IMP3 mRNA was normalized with GAPDH mRNA expression, and calculated as the ratio of IMP3 to GAPDH. The primers used were as follows: IMP3 forward primer, 5′‐GCTAAAGTGAGGATGGTGATTATCACT‐3′; IMP3 reverse primer, 5′‐ACTAACAAAGTTTTCTTCTTTAATTTTTCCAT‐3′; GAPDH forward primer, 5′‐GAAGGTGAAGGTCGGAGTC‐3′; and GAPDH reverse primer, 5′‐GAAGATGGTGATGGGATTTC‐3′.
Western blot analysis. Total cell lysates (40 μg protein) were separated by SDS‐PAGE in a 10% gel and electrotransferred to a PVDF membrane (Immobilon‐P membrane; Millipore, Bedford, MA, USA). After the blot was blocked in a solution of 5% skim milk, 0.1% Tween 20, and PBS, membrane‐bound proteins were probed with primary antibodies against IMP3 (Dako Cytomation, Carpinteria, CA, USA), neuron‐specific elonase (Millipore, Billerica, MA, USA), β‐actin, or α‐tubulin (Santa Cruz Biotechnology, Santa Cruz, CA, USA). The membrane was washed then incubated with HRP‐conjugated secondary antibodies for 30 min. Antibody‐bound protein bands were detected with enhanced chemiluminescence reagents (Amersham Pharmacia Biotech, Piscataway, NJ, USA) and exposed to Kodak X‐Omat Blue autoradiography film (PerkinElmer Life Sciences, Boston, MA, USA).
Cell culture and treatment. The NB cell lines SK‐N‐DZ (with MYCN amplification; ATCC number CRL‐2149) and SK‐N‐SH (without MYCN amplification; ATCC number HTB‐11) were maintained in DMEM/Ham’s F‐12 medium supplemented with 10% FBS (Life Technologies, Rockville, MD, USA) at 37°C in a humidified atmosphere composed of 5% CO2 and 95% air. For evaluation of the effect of cell differentiation on IMP3 expression, NB cells were treated with 10 μM all‐trans retinoic acid (RA).( 24 ) Cells were harvested before and after RA treatment for 1, 3, and 5 days. The protein expression levels of IMP3 were evaluated by Western blot analysis. The neuronal differentiation of NB cells was defined by neurite extension (Fig. S2A) as well as by increased expression of neuron‐specific elonase.
RNA interference (RNAi) and lentiviral infection. For the knockdown of the endogenous IMP3, shRNA targeting IMP3 were obtained from the RNAi core laboratory, Academia Sinica (Taipei, Taiwan). An shRNA vector against luciferase (pLKO.1‐shLuc; RNAi core laboratory, Academia Sinica, Taipei, Taiwan) was used as a negative control. For the production of lentivirus, 293T cells were cotransfected with 4 μg pLKO.1 lentiviral vectors, 0.4 μg envelope plasmid pMD.G, and 3.6 μg packaging plasmid pCMVΔR8.91. Virus‐containing supernatant was collected 24 and 48 h after transfection. To knockdown IMP3, SK‐N‐DZ and SK‐N‐SH cells were transduced with lentivirus for 24 h. For drug‐resistant cell selection, fresh medium containing 2 μg/mL puromycin was replaced every 3 days for 2 weeks.
Boyden chamber assays. For invasion assays, modified Boyden chambers with filter inserts (pore size, 8 μm) coated with Matrigel (40 μg; Collaborative Biomedical, Becton Dickinson Labware, Franklin Lakes, NJ, USA) in 24‐well dishes (Nucleopore, Pleasanton, CA, USA) were used. Approximately 2 × 10⁵ lentivirus‐infected SK‐N‐DZ and SK‐N‐SH cells, including three groups of control RNAi, shIMP3‐1, and shIMP3‐2, in 100 μL complete DMEM/F12 medium were placed in the upper chamber, and 1 mL of the same medium was placed in the lower chamber. After 48 h in culture, cells were fixed in methanol for 15 min then stained with 0.05% crystal violet in PBS for 15 min. Cells on the upper side of the filters were removed with cotton‐tipped swabs, and the filters were washed with PBS. Cells on the underside of the filters were viewed and counted under a microscope (type 090‐135.001; Leica Microsystems, Wetzlar, Germany). Each group was plated in triplicate in each experiment, and each experiment was repeated at least three times (for further details, see Data S1).
Statistics. The statistical analyses were carried out with spss version 12.0 for Windows (SPSS Inc., Chicago, IL, USA). Associations between pairs of categorical variables were assessed with Pearson’s chi‐squared‐test. The comparison of sample means from different treatments was analyzed using Student’s t‐test. Survival probabilities in various subgroups were estimated using the Kaplan–Meier method and were analyzed by log–rank tests. The influence of each variable on survival was assessed by the multivariate Cox proportional hazard model. All statistical tests were two‐sided, and a P‐value of 0.05 or less was considered to be statistically significant.
Results
Increased IMP3 expression associated with poor prognosis and MYCN amplification. To identify the genes differentially expressed in NB with various outcome, hierarchical clustering of filtered genes was carried out according to patient outcome (disease‐free survival versus relapse or death from disease within 3 years). By microarray analysis, a total of 926 genes were differentially expressed between the groups (Table S1). Patients with similar outcomes were clustered together based on these differentially expressed genes (Fig. 1A). Interestingly, clustered patients showed similar clinical stages and MYCN statuses (Fig. 1A). Of 926 genes, most were sporadic single genes. Two families of genes reported to affect cancer behaviors were found: (i) the MMP family (MMP14 and MMP9) and their tissue inhibitors (TIMP3 and TIMP4); and (ii) the IMP family (IMP1 and IMP3) (Fig. 1A). The results were consistent with previously published reports( 25 , 26 , 27 ) in that the increased expression levels of MMP14 and MMP9 in NB correlated with a poor prognosis, whereas the increased expression levels of TIMP3 and TIMP4 were associated with a good prognosis (Fig. 1A).
Figure 1.
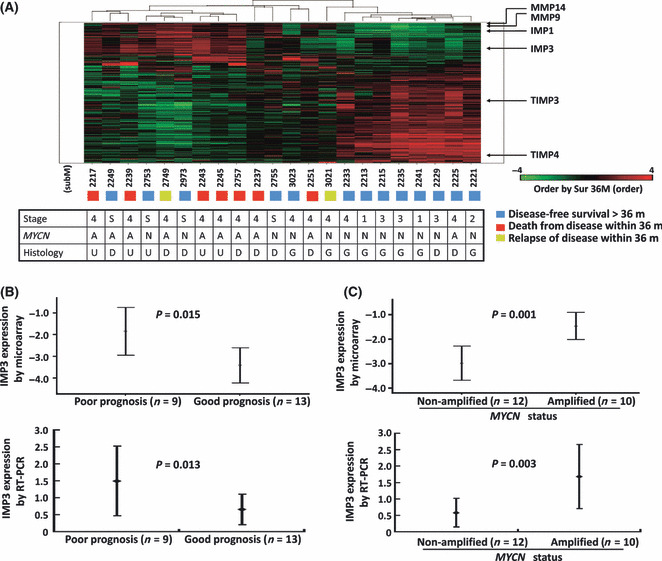
(A) Hierarchical clustering of differentially expressed genes evaluated by oligonucleotide microarray according to patient outcome. The locations of genes in the MMP, TIMP, and IMP families are indicated. A, MYCN amplified; D, differentiating neuroblastoma; G, ganglioneuroblastoma; m, months; N, MYCN not amplified; U, undifferentiated neuroblastoma. (B) Mean IMP3 expression levels with 95% confidence intervals evaluated by oligonucleotide microarray showing that neuroblastoma patients with poor prognosis, defined as dead or disease relapse within 3 years, had significantly higher IMP3 expression levels in tumor tissues than those with good prognosis, defined as disease‐free survival >3 years (P = 0.015, upper panel). The result was reconfirmed in the same 22 patients by quantitative real‐time PCR (P = 0.013, lower panel). (C) Mean IMP3 expression levels with 95% confidence intervals evaluated by oligonucleotide microarray showing that the IMP3 expression level was significantly higher in neuroblastoma tumors with MYCN amplification (n = 10) than in tumors without MYCN amplification (n = 12, P = 0.001, upper panel). The results were confirmed by PCR analysis in the same 22 patients (P = 0.003, lower panel).
The expression of IMP3, which served as an important prognostic factor in various cancers,( 12 , 13 , 14 ) showed a clustering phenomenon by microarray analysis similar to MMP14 and MMP9 (Fig. 1A). Stratified by different prognoses, the IMP3 expression levels were significantly higher in the 10 patients with a poor prognosis than in the 12 patients with a good prognosis (P = 0.015; Fig. 1B). Furthermore, the IMP3 expression levels were significantly higher in those with MYCN amplification (P = 0.001; Fig. 1C). The expression difference of IMP3 according to different prognoses and MYCN status were further confirmed by Q‐PCR in the same 22 NB samples used in microarray analysis (Fig. 1B,C; P = 0.013 and P = 0.003, respectively).
IMP3 protein expression inversely correlated with differentiation. The IMP3 protein expression was examined in NB tumor samples by IHC. Of 90 tumor tissues, 52 (57.8%) showed positive IMP3 immunostaining (1+ to 3+) (Fig. 2A), in which 20 were 1+, 19 were 2+, and 13 were 3+. IMP3 expression was observed only in the cytoplasm of neuroblastic cells and not in the stroma cells. The intensity and percentage of positive IMP3 expression was inversely correlated with the histological grade of differentiation. As the tumor became more differentiated, the intensity and percentage of positive IMP3 expression decreased accordingly (Fig. 2B, GNB versus UNB, P = 0.007; DNB versus UNB, P = 0.023).
Figure 2.
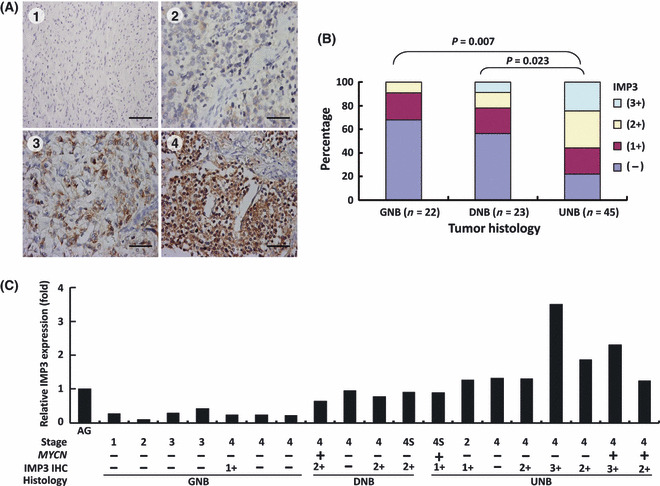
(A) Immunohistochemical (IHC) staining of IMP3 in neuroblastoma (NB) showing positive correlation with clinical stages: negative staining in stage 1 tumor tissues; 1+ (10–35% of cells stained) in stage 2; 2+ (35–70% of cells stained) in stage 3; and 3+ (>70% of cells stained) in stage 4. Scale bar = 100 μm. (B) Distribution of percentage and intensity of IHC staining in various histological grades of differentiation. Undifferentiated NB (UNB) showed higher percentages of stronger IMP3 immunostainings (UNB versus ganglioneuroblastoma [GNB], P = 0.007; UNB versus differentiating NB [DNB], P = 0.023). (C) Correlation between IMP3 mRNA expression in NB tumor tissues evaluated by quantitative real‐time PCR and clinical stages, MYCN status, and intensity of immunohistochemical staining. AG, adrenal gland.
To further confirm the results of IHC, we assessed IMP3 mRNA expression levels in another set of 19 fresh tumor tissues by Q‐PCR. IMP3 mRNA expression was highly correlated with protein levels evaluated by IHC and was expressed at relatively higher levels in undifferentiated tumors than in differentiated ones as well as normal adrenal glands (Fig. 2C). Taken together, both protein and mRNA expression levels of IMP3 in NB tumor tissues were inversely correlated with the histological grade of differentiation.
IMP3 as an independent prognostic factor indicating a poor outcome. To assess the clinical significance of IMP3 expression in NB, the correlation between several important clinicopathologic and biological variables and IMP3 expression were analyzed (Table 1). The results indicated that positive IMP3 expression was strongly correlated with undifferentiated tumor histology (P = 0.009), advanced clinical stage (stages 3 and 4, P = 0.002), and MYCN amplification (P = 0.033).
Table 1.
IMP3 expression and correlation with clinicopathologic and biological factors in 90 patients with neuroblastoma (NB)
| Cases | Positive IMP3 expression (%) | P‐value | |
|---|---|---|---|
| Sex | |||
| Male | 51 | 26 (51.0) | 0.196 |
| Female | 39 | 26 (66.7) | |
| Age at diagnosis | |||
| ≤1 year | 23 | 14 (60.9) | 0.809 |
| >1 year | 67 | 38 (56.7) | |
| Clinical stage | |||
| 1 | 9 | 3 (33.3) | 0.002† |
| 2 | 10 | 3 (30.0) | |
| 3 | 13 | 8 (61.5) | |
| 4 | 51 | 36 (70.6) | |
| 4S | 7 | 2 (28.6) | |
| Primary tumor site | |||
| Adrenal | 56 | 35 (62.5) | 0.277 |
| Extra‐adrenal | 34 | 17 (50.0) | |
| Tumor histology | |||
| Undifferentiated NB | 45 | 32 (71.1) | 0.009 |
| Differentiating NB | 23 | 12 (52.2) | |
| GNB | 22 | 8 (36.4) | |
| MYCN | |||
| Amplified | 22 | 17 (77.3) | 0.033 |
| Non‐amplified | 68 | 35 (51.5) | |
†Stages 1, 2, and 4S versus stages 3 and 4. GNB, ganglioneuroblastoma.
The median follow‐up duration after diagnosis was 39.5 months (range, 1–228 months). The 5‐year overall survival rate in 90 NB patients was 49.5%. Stratified by positive (n = 52) and negative IMP3 expression (n = 38), the 5‐year overall survival rate of NB patients was 35.4% and 76.8%, respectively (Fig. 3A). By the Kaplan–Meier analysis, patients with positive IMP3 expression had a significantly worse overall survival (P < 0.001). Univariate analysis showed that younger age (≤1 year) at diagnosis, early clinical stages, and differentiated tumor histology strongly correlated with a better survival, whereas MYCN amplification and IMP3 expression predicted a poor outcome (Table 2). By multivariate analysis, IMP3 expression was found to be an independent prognostic factor in addition to clinical stage, MYCN status, and tumor histology (P = 0.038, Table 2).
Figure 3.

(A) Kaplan–Meier survival analysis of all 90 neuroblastoma (NB) patients stratified by negative and positive IMP3 expression. Patients with positive IMP3 expression had poor prognosis (P < 0.001, log–rank test). (B) Kaplan–Meier survival analysis of 64 NB patients with advanced disease (stages 3 and 4) showed a worse prognosis in patients with positive IMP3 expression than those with negative IMP3 (P = 0.005, log–rank test). (C) In 68 patients with normal MYCN status, patients with positive IMP3 expression showed a worse survival by Kaplan–Meier analysis (P = 0.001, log–rank test). (D) In 22 patients with MYCN amplification, patients with positive IMP3 expression also showed a worse survival by Kaplan–Meier analysis (P = 0.033, log–rank test).
Table 2.
Clinicopathologic and biologic factors affecting survival rate in 90 patients with neuroblastoma
| Variable | Univariate analysis | Multivariate analysis | ||||
|---|---|---|---|---|---|---|
| RR | 95% CI | P‐value | RR | 95% CI | P‐value | |
| Age at diagnosis: ≤1 vs >1 year | 3.568 | 1.674–7.606 | 0.001 | 2.751 | 0.986–7.676 | 0.053 |
| Clinical stage: early (1, 2, 4S) versus advanced (3, 4) | 22.038 | 5.330–91.117 | <0.001 | 11.277 | 1.407–90.408 | 0.023 |
| MYCN: non‐amplified versus amplified | 3.161 | 1.804–5.539 | <0.001 | 2.141 | 1.110–4.128 | 0.023 |
| IMP3 expression: negative versus positive | 4.070 | 1.880–8.809 | <0.001 | 2.481 | 1.050–5.860 | 0.038 |
| Histology: differentiated† versus undifferentiated | 2.729 | 1.558–4.782 | <0.001 | 2.037 | 1.012–4.097 | 0.046 |
| Sex: male versus female | 1.373 | 0.798–2.363 | 0.252 | ND | ||
| Primary tumor site: extra‐adrenal versus adrenal | 1.392 | 0.795–2.435 | 0.247 | ND | ||
†Including differentiating neuroblastoma and ganglioneuroblastoma. CI, confidence interval; ND, not done; RR, relative risk.
IMP3 expression to distinguish the prognosis of patients in subgroups. To strengthen the clinical significance of IMP3 expression, we further analyzed the survival of patients in subgroups stratified by their clinical stages and MYCN statuses. In patients with early stages (stages 1, 2, and 4S), the prognosis was generally excellent and independent to the IMP3 expression (data not shown). However, in 63 patients with advanced‐stage disease (stages 3 or 4), the overall 5‐year survival rate was 28.9%. The prognosis could be clearly distinguished by IMP3 expression (Fig. 3B; P = 0.005, log–rank test). Among 43 patients with advanced stage disease, 37 (86.0%) with positive IMP3 expression died of their disease, whereas only 6 of the 20 (30.0%) patients with negative IMP3 expression died. That is, patients with advanced stage disease who were found to have negative IMP3 expression may have a better chance for survival. However, among 68 NB patients without MYCN amplification, the overall 5‐year survival rate was 60.6%, and only 5 of the 33 (15.2%) patients with negative IMP3 expression died of their disease, whereas 21 of the 35 (60.0%) patients with positive IMP3 expression did. Positive IMP3 expression could predict an unfavorable prognosis in patients with normal MYCN status, who should be presumed to have a better prognosis (Fig. 3C; P = 0.001, log–rank test). In patients with MYCN amplification, which may lead to a very unfavorable outcome, the prognosis was even worse if their tumors showing positive IMP3 staining (Fig. 3D; P = 0.033, log–rank test). Most patients (16 out of 17) who had both MYCN amplification and positive IMP3 expression died of their disease. In summary, analysis of the IMP3 expression in NB patients could provide complementary information about prognosis, in addition to the clinical staging and MYCN status, and be beneficial for a chance of personalized therapy.
IMP3 expression decreased in differentiated NB cells. Neuronal differentiation with neurite extension was evident after treatment with RA in SK‐N‐DZ cells (Fig. 4A) and SK‐N‐SH cells (Fig. S2A). Western blot analysis showed that IMP3 protein levels decreased and neuron‐specific elonase increased after differentiation was induced by RA treatment in SK‐N‐DZ cells (Fig. 4B, upper panel) and SK‐N‐SH cells (Fig. S2B, upper panel). The quantitative levels of IMP3 protein decreased significantly after RA treatment (Fig. 4B, lower panel, *P < 0.05).
Figure 4.
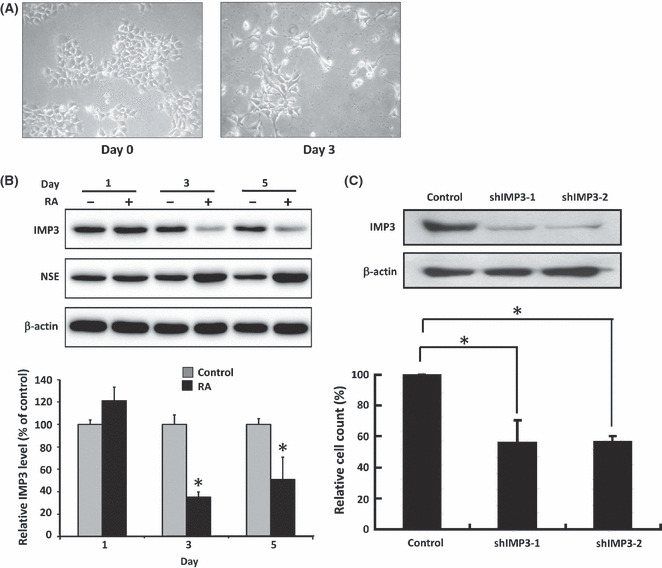
(A) SK‐N‐DZ neuroblastoma cells showing neurite extension after treatment with all‐trans retinoic acid (RA) for 3 days. (B) IMP3 protein expression levels in SK‐N‐DZ cells decreased after cell differentiation induced by RA. Cell differentiation is confirmed by neurite extension and increased expression of neuron‐specific elonase (NSE). (C) IMP3 protein expression levels in SK‐N‐DZ cells decreased after IMP3 knockdown by shIMP3‐1 or shIMP3‐2, resulting in inhibited invasion ability. *P < 0.05.
IMP3 knockdown resulting in decreased invasion ability and increased apoptosis in vitro. To clarify the functional roles of IMP3 expression in vitro, the IMP3 expression was depleted by shRNA in SK‐N‐DZ cells (Fig. 4C, upper panel) and SK‐N‐SH cells (Fig. S2C, upper panel). To avoid erroneous off‐target effects, two different shRNAs, shIMP3‐1 and shIMP3‐2, were used. As shown in the modified Boyden chamber assays, the invasion ability was significantly downregulated by depletion of IMP3 expression in SK‐N‐DZ cells (Fig. 4C, lower panel, *P < 0.05) and SK‐N‐SH cells (Fig. S2C, lower panel, *P < 0.05). Regarding the role of IMP3 in cell death, we found that IMP3 knocked down by shIMP3‐1 and shIMP3‐2 could significantly increase DNA fragmentation in SK‐N‐DZ cells after 48 h transfection (Fig. S3). The FACS analysis by propidium iodide staining to detect the sub‐G0/G1 phase after shIMP3‐1 and shIMP3‐2 transfection also supported the apoptosis ELISA data (data not shown). Taken together, silencing endogenous IMP3 expression could increase the apoptosis ratio in neuroblastoma cells.
Discussion
Recent advances in the understanding of the biology and genetics of NB have led to risk classification‐based therapy,( 20 ) which suggests that studies for prognostic molecules could help to determine therapeutic options in NB.( 28 ) In this study, by a genome‐wide screening of differentially expressed genes related to tumor behavior and prognosis in NB, we found that IMP3 was highly expressed in samples from NB patients with an unfavorable prognosis, in addition to the MMP and TIMP family genes. In previous reports, clinical stage and MYCN amplification are the two most important prognostic factors in NB.( 28 ) However, not all patients with advanced stage disease had a poor prognosis, and not all patients with normal MYCN status had a good prognosis. Our study showed that IMP3 expression could further discriminate the prognosis of patients in subgroups, such as patients with advanced disease, patients with normal MYCN status, and patients with MYCN amplification (Fig. 3). In the multivariate analysis (Table 2), our result showed that IMP3 expression predicted an unfavorable prognosis independent of MYCN status, the most well‐known unfavorable biological marker. Other reports had similar results, in that IMP3 could predict a unfavorable prognosis in various cancers.( 13 , 14 ) This suggested that IHC study of IMP3 expression in tumor tissues could provide complementary prognostic information, which in turn could help to determine the best choice of therapy.
Several agents have been identified which induce neuronal differentiation of NB cells in vitro, including RA and neurotrophins. As a drug of choice for differentiation therapy, RA can induce cell cycle arrest and neurite outgrowth through degradation of the F‐box protein, Skp2, and stabilization of cyclin‐dependent kinase inhibitor, p27.( 29 ) In this study, we showed that treatment with RA could induce differentiation in SK‐N‐DZ (Fig. 4B) and SK‐N‐SH (Fig. S2B) cells, resulting in decreased IMP3 expression. In patients, undifferentiated tumors also showed higher expression of IMP3 than differentiated tumors. The mechanism behind the relationship between IMP3 expression and differentiation needs further investigation.
Insulin‐like growth factor II mRNA‐binding protein 3 plays a critical role in cell proliferation, invasion, and apoptosis in leukemia cells as well as in pancreas, kidney, lung, and colorectal cancer.( 9 , 10 , 12 , 13 , 14 , 30 , 31 , 32 ) Vikesaa et al. also showed that IMP3 could regulate the adhesion and invasion of HeLa cells by directly targeting CD44 in the formation of invadopodia.( 11 ) In our previous study, we showed that IMP3 expression promoted tumor invasion and predicted early recurrence and poor prognosis in hepatocellular carcinoma and that the invasion ability could be suppressed by depletion of IMP3 expression in vitro by RNAi.( 33 ) It has been shown that IMP3 is critical for neural crest cell migration during early neuronal development.( 10 , 34 ) Our results also showed that knockdown of IMP3 inhibits tumor invasion, indicating NB cells use the same mechanism as neuroblasts for dissemination.
In summary, we hypothesize that high expression of IMP3 in NB might contribute to the undifferentiated phenotype and promote malignant tumor behaviors, thereby leading to a poor prognosis through enhancing invasion ability. Furthermore, as the invasion ability of NB cells can be suppressed after IMP3 knockdown by shIMP3, IMP3 could be a potential target in the treatment of NB.
Disclosure Statement
We certify that the authors of this article do not have commercial associations that might pose a conflict of interest in connection with the submitted article.
Supporting information
Fig. S1. Positive control of IMP3 immunohistochemical staining in gastric adenocarcinoma. Brown color denotes positive staining. Original magnification, ×200.
Fig. S2. (A) SK‐N‐SH neuroblastoma cells showing neurite extension after treatment with all‐trans retinoic acid (RA) for 3 days. (B) IMP3 protein expression levels in SK‐N‐SH cells, a MYCN non‐amplified cell line, decreased after cell differentiation induced by RA. (C) IMP3 protein expression levels in SK‐N‐SH cells decreased after IMP3 knockdown by shIMP3‐1 or shIMP3‐2, resulting in inhibited cell migration. *P < 0.05.
Fig. S3. Apoptotic cell death increased in SK‐N‐DZ neuroblastoma cells after IMP3 knockdown by shIMP3‐1 or shIMP3‐2. *P < 0.05.
Table S1. Differentially expressed genes in neuroblastoma tumor tissues evaluated by oligonucleotide microarray according to patient outcome.
Data S1. Supplementary materials and methods.
Supporting info item
Supporting info item
Supporting info item
Supporting info item
Acknowledgments
This research was supported by grants from the National Taiwan University Hospital, Taipei, Taiwan (NTUH 98‐S1094); the National Science Council, Taiwan (NSC 97‐2314‐B‐002‐029‐MY2); and the National Health Research Institutes, Taiwan (NHRI‐EX96‐9620NI).
References
- 1. Seeger RC, Brodeur GM, Sather H et al. Association of multiple copies of the N‐myc oncogene with rapid progression of neuroblastomas. N Engl J Med 1985; 313: 1111–6. [DOI] [PubMed] [Google Scholar]
- 2. Maris JM, Hogarty MD, Bagatell R, Cohn SL. Neuroblastoma. Lancet 2007; 369: 2106–20. [DOI] [PubMed] [Google Scholar]
- 3. Cohn SL, Tweddle DA. MYCN amplification remains prognostically strong 20 years after its “clinical debut”. Eur J Cancer 2004; 40: 2639–42. [DOI] [PubMed] [Google Scholar]
- 4. Nakagawara A. Trk receptor tyrosine kinases: a bridge between cancer and neural development. Cancer Lett 2001; 169: 107–14. [DOI] [PubMed] [Google Scholar]
- 5. Cohn SL, London WB, Huang D et al. MYCN expression is not prognostic of adverse outcome in advanced‐stage neuroblastoma with nonamplified MYCN. J Clin Oncol 2000; 18: 3604–13. [DOI] [PubMed] [Google Scholar]
- 6. Tang XX, Zhao H, Kung B et al. The MYCN enigma: significance of MYCN expression in neuroblastoma. Cancer Res 2006; 66: 2826–33. [DOI] [PubMed] [Google Scholar]
- 7. Mueller‐Pillasch F, Pohl B, Wilda M et al. Expression of the highly conserved RNA binding protein KOC in embryogenesis. Mech Dev 1999; 88: 95–9. [DOI] [PubMed] [Google Scholar]
- 8. Hansen TV, Hammer NA, Nielsen J et al. Dwarfism and impaired gut development in insulin‐like growth factor II mRNA‐binding protein 1‐deficient mice. Mol Cell Biol 2004; 24: 4448–64. [DOI] [PMC free article] [PubMed] [Google Scholar]
- 9. Yantiss RK, Woda BA, Fanger GR et al. KOC (K homology domain containing protein overexpressed in cancer): a novel molecular marker that distinguishes between benign and malignant lesions of the pancreas. Am J Surg Pathol 2005; 29: 188–95. [DOI] [PubMed] [Google Scholar]
- 10. Yaniv K, Fainsod A, Kalcheim C, Yisraeli JK. The RNA‐binding protein Vg1 RBP is required for cell migration during early neural development. Development 2003; 130: 5649–61. [DOI] [PubMed] [Google Scholar]
- 11. Wagner M, Kunsch S, Duerschmied D et al. Transgenic overexpression of the oncofetal RNA binding protein KOC leads to remodeling of the exocrine pancreas. Gastroenterology 2003; 124: 1901–14. [DOI] [PubMed] [Google Scholar]
- 12. Vikesaa J, Hansen TV, Jonson L et al. RNA‐binding IMPs promote cell adhesion and invadopodia formation. EMBO J 2006; 25: 1456–68. [DOI] [PMC free article] [PubMed] [Google Scholar]
- 13. Jiang Z, Chu PG, Woda BA et al. Analysis of RNA‐binding protein IMP3 to predict metastasis and prognosis of renal‐cell carcinoma: a retrospective study. Lancet Oncol 2006; 7: 556–64. [DOI] [PubMed] [Google Scholar]
- 14. Wang T, Fan L, Watanabe Y et al. L523S, an RNA‐binding protein as a potential therapeutic target for lung cancer. Br J Cancer 2003; 88: 887–94. [DOI] [PMC free article] [PubMed] [Google Scholar]
- 15. Shimada H, Ambros IM, Dehner LP et al. Terminology and morphologic criteria of neuroblastic tumors: recommendations by the International Neuroblastoma Pathology Committee. Cancer 1999; 86: 349–63. [PubMed] [Google Scholar]
- 16. Shimada H, Ambros IM, Dehner LP et al. The International Neuroblastoma Pathology Classification (the Shimada system). Cancer 1999; 86: 364–72. [PubMed] [Google Scholar]
- 17. Brodeur GM, Pritchard J, Berthold F et al. Revisions of the international criteria for neuroblastoma diagnosis, staging, and response to treatment. J Clin Oncol 1993; 11: 1466–77. [DOI] [PubMed] [Google Scholar]
- 18. Kopf I, Hanson C, Delle U et al. A rapid and simplified technique for analysis of archival formalin‐fixed, paraffin‐embedded tissue by fluorescence in situ hybridization (FISH). Anticancer Res 1996; 16: 2533–6. [PubMed] [Google Scholar]
- 19. Tajiri T, Shono K, Fujii Y et al. Highly sensitive analysis for N‐myc amplification in neuroblastoma based on fluorescence in situ hybridization. J Pediatr Surg 1999; 34: 1615–9. [DOI] [PubMed] [Google Scholar]
- 20. Castleberry RP. Neuroblastoma. Eur J Cancer 1997; 33: 1430–7. [DOI] [PubMed] [Google Scholar]
- 21. Hsu WM, Jen YM, Lee H et al. The influence of biologic factors on the surgical decision in advanced neuroblastoma. Ann Surg Oncol 2006; 13: 238–44. [DOI] [PubMed] [Google Scholar]
- 22. Jeng YM, Wang TH, Lu SH et al. Prognostic significance of insulin‐like growth factor II mRNA‐binding protein 3 expression in gastric adenocarcinoma. Br J Surg 2009; 96: 66–73. [DOI] [PubMed] [Google Scholar]
- 23. Ikeda K, Tate G, Suzuki T et al. IMP3/L523S, a novel immunocytochemical marker that distinguishes benign and malignant cells: the expression profiles of IMP3/L523S in effusion cytology. Hum Pathol 2010; 41: 745–50. [DOI] [PubMed] [Google Scholar]
- 24. Hsu WM, Lee H, Juan HF et al. Identification of GRP75 as an independent favorable prognostic marker of neuroblastoma by a proteomics analysis. Clin Cancer Res 2008; 14: 6237–45. [DOI] [PubMed] [Google Scholar]
- 25. Ara T, Kusafuka T, Inoue M et al. Determination of imbalance between MMP‐2 and TIMP‐2 in human neuroblastoma by reverse‐transcription polymerase chain reaction and its correlation with tumor progression. J Pediatr Surg 2000; 35: 432–7. [DOI] [PubMed] [Google Scholar]
- 26. Ribatti D, Surico G, Vacca A et al. Angiogenesis extent and expression of matrix metalloproteinase‐2 and ‐9 correlate with progression in human neuroblastoma. Life Sci 2001; 68: 1161–8. [DOI] [PubMed] [Google Scholar]
- 27. Mahller YY, Vaikunth SS, Ripberger MC et al. Tissue inhibitor of metalloproteinase‐3 via oncolytic herpesvirus inhibits tumor growth and vascular progenitors. Cancer Res 2008; 68: 1170–9. [DOI] [PMC free article] [PubMed] [Google Scholar]
- 28. Brodeur GM. Neuroblastoma: biological insights into a clinical enigma. Nat Rev Cancer 2003; 3: 203–16. [DOI] [PubMed] [Google Scholar]
- 29. Cuende J, Moreno S, Bolaños JP, Almeida A. Retinoic acid downregulates Rae1 leading to APC(Cdh1) activation and neuroblastoma SH‐SY5Y differentiation. Oncogene 2008; 27: 3339–44. [DOI] [PubMed] [Google Scholar]
- 30. Liao B, Hu Y, Herrick DJ, Brewer G. The RNA‐binding protein IMP‐3 is a translational activator of insulin‐like growth factor II leader‐3 mRNA during proliferation of human K562 leukemia cells. J Biol Chem 2005; 280: 18517–24. [DOI] [PubMed] [Google Scholar]
- 31. Yuan RH, Wang CC, Chou CC et al. Diffuse expression of RNA‐binding protein IMP3 predicts high‐stage lymph node metastasis and poor prognosis in colorectal adenocarcinoma. Ann Surg Oncol 2009; 16: 1711–9. [DOI] [PubMed] [Google Scholar]
- 32. Liao B, Hu Y, Brewer G. RNA‐binding protein IMP‐3 promotes cell survival via IGF‐II signaling after ionizing radiation. J Biol Chem 2011; 286: 31145–52. [DOI] [PMC free article] [PubMed] [Google Scholar]
- 33. Jeng YM, Chang CC, Hu FC et al. RNA‐binding protein insulin‐like growth factor II mRNA‐binding protein 3 expression promotes tumor invasion and predicts early recurrence and poor prognosis in hepatocellular carcinoma. Hepatology 2008; 48: 1118–27. [DOI] [PubMed] [Google Scholar]
- 34. Nielsen J, Christiansen J, Lykke‐Andersen J et al. A family of insulin‐like growth factor II mRNA‐binding proteins represses translation in late development. Mol Cell Biol 1999; 19: 1262–70. [DOI] [PMC free article] [PubMed] [Google Scholar]
Associated Data
This section collects any data citations, data availability statements, or supplementary materials included in this article.
Supplementary Materials
Fig. S1. Positive control of IMP3 immunohistochemical staining in gastric adenocarcinoma. Brown color denotes positive staining. Original magnification, ×200.
Fig. S2. (A) SK‐N‐SH neuroblastoma cells showing neurite extension after treatment with all‐trans retinoic acid (RA) for 3 days. (B) IMP3 protein expression levels in SK‐N‐SH cells, a MYCN non‐amplified cell line, decreased after cell differentiation induced by RA. (C) IMP3 protein expression levels in SK‐N‐SH cells decreased after IMP3 knockdown by shIMP3‐1 or shIMP3‐2, resulting in inhibited cell migration. *P < 0.05.
Fig. S3. Apoptotic cell death increased in SK‐N‐DZ neuroblastoma cells after IMP3 knockdown by shIMP3‐1 or shIMP3‐2. *P < 0.05.
Table S1. Differentially expressed genes in neuroblastoma tumor tissues evaluated by oligonucleotide microarray according to patient outcome.
Data S1. Supplementary materials and methods.
Supporting info item
Supporting info item
Supporting info item
Supporting info item