

Abstract
The estrogen receptor‐binding fragment‐associated gene 9 (EBAG9) has been identified as an estrogen‐responsive gene and was recently identified as a tumor‐promoting and prognostic factor for renal cell carcinoma. We investigated whether EBAG9 expression was correlated with primary tumor growth and distant tumor metastasis in a murine breast carcinoma model. Knockdown expression of EBAG9 by small interfering RNA significantly suppressed tumor growth and metastasis in vivo in a highly malignant, spontaneously metastasizing 4T1 mouse mammary carcinoma model. 4T1 cells stably overexpressing EBAG9 developed larger and faster tumor growth and lung metastasis compared with parental 4T1 or 4T1 expressing vector alone. Strong specific cytotoxic T lymphocyte activity and enhanced γ‐interferon and interleukin‐2 productions were induced in mice that received EBAG9 small interfering RNA therapy. Gene silencing of EBAG9 prolonged the survival of tumor‐bearing mice and induced more intensive infiltration of CD8+ T cells in tumor mass. EBAG9 induced apoptosis of T cells, enhanced glycogen synthase kinase 3β phosphorylation and inhibited γ‐interferon production of T cells when T lymphocytes were cocultured with 4T1 cells overexpressing EBAG9. Furthermore, overexpression of EBAG9 in 4T1 cells was accompanied with enhanced expression of chemokine (C‐X‐C motif) receptor 4, which might be involved in tumor metastasis. Taken together, our results suggested that EBAG9 promoted primary 4T1 mammary carcinoma growth and distant metastasis, and EBAG9 small interfering RNA exerted overt regression of tumor growth and metastasis. These findings might provide insights into the mechanism through which tumors evade immunosurveillance and provide a strategy for therapeutic intervention of cancer metastases. (Cancer Sci 2009; 100: 961–969)
Abbreviations:
- CTL
cytotoxic T lymphocyte
- CXCR4
chemokine (C‐X‐C motif) receptor 4
- EBAG9
estrogen receptor‐binding fragment‐associated gene 9
- ELISA
enzyme‐linked immunosorbent assay
- GAPDH
glyceraldehyde‐3‐phosphate dehydrogenase
- GSK3β
glycogen synthase kinase 3β
- HRP
horseradish peroxidase
- IFN
interferon
- IL
interleukin
- mAb
monoclonal antibody
- MTT
thiazolyl blue
- NK
natural killer
- RCAS1
receptor‐binding cancer antigen expressed on SiSo cells
- RT‐PCR
reverse transcription–polymerase chain reaction
- siRNA
small interfering RNA
- VCAM‐1
vascular cell adhesion molecule 1
EBAG9, an estrogen‐responsive gene, was identified in MCF‐7 human breast carcinoma cell line using a CpG–genomic binding site cloning method.( 1 ) Its product was later found to be identical to RCAS1 (receptor‐binding cancer antigen expressed on SiSo cells), a cancer cell‐surface antigen implicated in immune escape.( 2 ) EBAG9/RCAS1 expressed in estrogen target organs as well as several other tissues such as brain, liver, and kidney.( 2 ) Published works also showed that EBAG9/RCAS1 was expressed in various malignancies such as breast, ovarian, prostate, and hepatocellular carcinomas.( 3 , 4 , 5 , 6 ) RCAS1 reportedly acts as a ligand for a putative receptor present in various human cell lines and peripheral lymphocytes, such as T, B, and NK cells, and thus leads them to apoptosis, which might contribute to the escape of tumor cells from immune surveillance.( 7 , 8 ) Immunohistochemical studies with tissue samples revealed that RCAS1 expression has been correlated significantly with poor overall survival in patients with several malignancies.( 9 , 10 , 11 ) Ogushi et al.( 12 ) provided the first in vivo evidence that EBAG9 was a tumor‐promoting and prognostic factor for renal cell carcinoma. Their study showed that enhanced tumor growth in renal cell carcinoma, promoted by EBAG9, was largely due to the reduced infiltrating CD8+ T lymphocytes. However, the possible role of EBAG9 expression in tumor metastasis remains to be clarified.
In the present study, we investigated the involvement of EBAG9 expression in primary tumor growth and distant tumor metastasis using a BALB/c‐derived 4T1 mammary carcinoma model that is a unique non‐transgenic model of metastatic breast cancer.( 13 ) The growth characteristics, lack of immunogenicity, and aggressive, spontaneous metastatic properties of this model closely resemble those characteristics observed for human breast cancer.( 14 ) 4T1 tumor cells are relatively easy to culture and form tumors in healthy, immunocompetent BALB/c mice following subcutaneous inoculation with as few as 5000–7000 cells,( 15 , 16 ) making this a useful in vivo model to study the effects of active immunization against aggressive, non‐immunogenic cancers for which no tumor‐associated antigens have been defined. In this study, we generated a 4T1 cell line that stably overexpressed EBAG9, designed siRNA targeting the mouse EBAG9 gene to knock down the expression of EBAG9, and investigated the roles of EBAG9 in tumor growth and metastasis in vivo with the 4T1 breast carcinoma model.
Here we show that overexpression of EBAG9 in 4T1 cells significantly promoted tumor growth and metastases. Intratumoral injection of EBAG9 siRNA overtly inhibited tumor growth as well as distant tumor metastases. Enhanced specific CTL activity, Th1 cytokine productions, and prolongation of survival time were observed in mice treated with EBAG9 siRNA. EBAG9 induced apoptosis and GSK3β phosphorylation of T cells, and also inhibited IFN‐γ production of T cells when T lymphocytes were cocultured with 4T1 cells overexpressing EBAG9. Furthermore, overexpression of EBAG9 in 4T1 cells was accompanied by enhanced expression of CXCR4, which might be involved in tumor metastasis.
Materials and Methods
Mice and cell lines. Female BALB/c mice syngeneic to 4T1 cells, aged 6 weeks, were purchased from Joint Ventures Sipper BK Experimental Animal Co. (Shanghai, China) and maintained in a specific pathogen‐free condition. 4T1 cells were a kind gift from Professor Yangxin Fu (Chicago University, Chicago, IL, USA). CT26, B16 and YAC‐1 cells were from American Type Culture Collection (Manassas, VA, USA).
Reagents. Murine IFN‐γ, IL‐10, IL‐4 and IL‐2 ELISA kits were purchased from R&D Systems (Minneapolis, MN, USA). Mitomycin C and methylene blue hydrate were purchased from Sigma‐Aldrich (St. Louis, MO, USA). Cytotox96 Non‐Radioactive Cytotoxicity Assay kit was purchased from Promega (Madison, MI, USA). Recombinant IL‐2 and anti‐CD3 mAb were purchased from BD Pharmingen (San Diego, CA, USA). Lipofectamine 2000 and GeneSilencer were products of Invitrogen (Carlsbad, CA, USA) and Gene Therapy Systems (San Diego, CA, USA), respectively. Goat polyclonal antibodies to EBAG9/N18, EBAG9/C20 (sc‐23396, sc‐23394; Santa Cruz Biotechnology, Santa Cruz, CA, USA), rabbit polyclonal antibodies to GSK3β and phospho‐Ser9‐GSK3β (BioVision Technologies, Exton, PA, USA, USA) were commercially purchased. Mouse GAPDH mAb, donkey antirabbit IgG (h & l) HRP, donkey antigoat IgG (h & l) HRP, and goat antimouse IgG (h & l) HRP were all from Cell Signaling Technology (Danvers, MA, USA). EBAG9 primer and siRNA were synthesized by Shanghai Sangon Biological Engineering Technology and Services (Shanghai, China) and GeneChem (Shanghai, China), respectively.
Generation of 4T1 cells stably overexpressing EBAG9. Murine EBAG9 encoding gene was amplified by RT‐PCR from total RNA extracted from 4T1 cells and was ligated to plasmid pcDNA3.1(–B) by T4 DNA ligase after digestion by the restricted endonucleases, EcoRI and BamHI. The ligated products were inserted into competent XL‐Gold Escherichia coli and the positive recombinants were collected and identified by restriction endonuclease digestion assay, PCR, and DNA sequencing (Stratagene, La Jolla, CA, USA).
To generate a cell line that stably overexpressed EBAG9, 4T1 cells were transfected with the recombinant plasmid pcDNA3.1(–B)/EBAG9. Transfection of the empty vector pcDNA3.1(–B), as a group control, used Lipofectamine 2000 according to the manufacturer's protocol. G418 (1 mg/mL) resistant cells were selected and several independent clones were isolated.
Design and screening of EBAG9 siRNA. Three siRNAs aimed at the murine EBAG9 gene were designed and synthesized to silence the EBAG9 gene (siRNA1 sense, 5′‐3′GUGUUCUCGUUCCUAAAGAtt and antisense, 5′‐3′UCUUUAGGAACGAGAACACtt; siRNA2 sense, 5′‐3′GGAAAUUAAGUGGAGAUCAtt and antisense, 5′‐3′, UGAUCUCCACUUAAUUUCCtt; siRNA3 sense, 5′‐3′GAAGAGAGAACCAUUGAAUtt and antisense, 5′‐3′, AUUCAAUGGUUCUCUCUUCtt). Simultaneously, a non‐silencing siRNA (sense, 5′‐3′ UUCUCCGAACGUGUCACGUtt and antisense, 5′‐3′ACGUGACACGUUCG‐GAGAAtt as a negative control) and a GAPDH siRNA (sense, 5′‐3′ GUGGAGAUUGUU‐GCCAUCAtt and antisense, UGAUGGCAACAAUCUCCACtt, as a positive control) were also synthesized to show the effectiveness of the screening assay.
To obtain an effective EBAG9 siRNA, 4T1 cells were transiently transfected with the three EBAG9 siRNAs, non‐silencing siRNA, and GAPDH siRNA using GeneSilencer reagent. To gain the highest effective transfection, 4T1 cell numbers from 1 × 10⁵ to 6 × 10⁵/mL were used and the transfection time was set from 24 h to 48 h. Detection was carried out every 12 h. After transfection, RT‐PCR and Western blot analysis were carried out to determine the expression of EBAG9 or GAPDH, and the assay effectiveness was determined by the negative control and positive control. That is, non‐silencing siRNA exerted no influence on the expression of EBAG9, and GAPDH siRNA silenced the expression of GAPDH.
4T1 cell viability determination in vitro. MTT assay was carried out to determine 4T1 cell proliferation in vitro. Cells were transiently transfected with pcDNA3.1(–B)/EBAG9 (pcDNA3.1(–B) vector as a mock control) or EBAG9 siRNA (non‐silencing siRNA as a control) using GeneSilencer reagent and cultured for 24, 48, or 72 h. Spectrophotometric absorbance at 570 nm was measured, with absorbance at 630 nm for reference.
Detection of apoptosis, IFN‐γ production and expression of GSK3β in T cells. Spleens from BALB/c mice were harvested and minced, a single‐cell suspension was prepared by filtration through sterile nylon wool. For IFN‐γ assay, purified T cells were stimulated with plate‐coated anti‐CD3 (0.3 µg/mL) in the presence of 4T1 transfectants (4T1/EBAG9, 4T1/EBAG9 siRNA2 and controls) treated with mitomycin C (50 µg/mL). After 48 h, culture supernatants were harvested and IFN‐γ production was measured using ELISA kits. Simultaneously, T cells were harvested for apoptosis assay (propidium iodide and annexin V staining) and for Western blot to determine the expression of GSK3β or phosphorylated GSK3β.
Therapy of EBAG9 siRNA in 4T1 mammary carcinoma model. 4T1, 4T1/EBAG9, and 4T1/Mock cells were adjusted to 1 × 10⁷/mL for inoculation. Female BALB/c mice were randomly divided into five groups, each containing eight animals. Mice in the parental 4T1, EBAG9/siRNA and non‐silencing groups were subcutaneously injected with 100 µL 4T1 cells, whereas mice in the 4T1/EBAG9 or 4T1/Mock group were subcutaneously injected with 100 µL 4T1/EBAG9 or 4T1/Mock cells, respectively. Five days after tumor inoculation, EBAG9 siRNA (10 µg) or non‐silencing siRNA (10 µg) was injected directly into tumors every 4 days in the EBAG9 siRNA group, and non‐silencing group, respectively, along with 4 µL GeneSilencer reagent dissolved in 100 µL serum‐free RPMI‐1640. Mice were killed at indicated times after six siRNA treatments.
Three days after tumor inoculation, the tumor size was measured with a micrometer every 2 days. Then tumor volume was calculated with the formula: V = longest diameter × smallest diameter2.( 12 ) After the mice were killed, tumors were removed, photographed and weighed. RT‐PCR and Western blot analysis were used to verify the expression of EBAG9 in the tumor mass.
Colony formation assay of metastatic tumors in lung. Tumor colony formation assay was carried out as previously reported.( 14 ) At 25 days after tumor inoculation, lungs were dissociated using collagenase type IV (2 mg/mL) and elastase (30 U/mL) (Sigma‐Aldrich) in Hank's Buffered Salt Solution (HBSS) at 4°C for 75 min with rocking. Dissociated tissues were then passed through a 70‐µm strainer and plated at various concentrations in 6‐well plates in complete RPMI‐1640 containing 60 µM 6‐thioguanine. The resistant tumor cells formed foci within 12 days, at which time they were fixed with methanol and stained with 0.03% methylene blue for counting. Colongenic metastases were calculated on a per‐organ basis.
Metastatic tumor staining assay by India ink. Metastatic 4T1 tumor nodules was also enumerated by the India ink staining method, as previously reported.( 17 ) India ink solution was injected through the trachea and allowed to fill the lung for 5 min. The lungs were removed and placed in Fekete's solution (70% alcohol, 10% formalin, and 5% acetic acid) for destaining. Tumor nodules did not absorb India ink, which resulted in the normal lung tissue staining black and the tumor nodules remaining white. Tumor nodules were counted blindly and size was noted by three independent investigators.
Semiquantitative RT‐PCR analysis. Total RNA was extracted from cultured 4T1 cells or tumor mass by TRIzol reagent. Total RNA (1 µg) from each sample was reverse transcribed using a Reverse Transcription System Kit (MBI Fermentas, Vilnius, Lithuania) in a total volume of 20 µL. cDNA as readout of the mRNA was quantitated in a PCR using specific primers as follows: primers for EBAG9 amplification were 5′‐GCGAATTCATGGCCATCACTCAGTTT3′ (sense) and 5′GCGG‐ATCCTTAGGAAAGCTTCACACC3′ (antisense), with a predicted PCR product of 642 bp; primers for GAPDH amplification were 5′‐TGAAGGTCGGTGTGAACGGATTTGGC‐3′ (sense) and 5′‐CATGTAGGCCATGAGGTCCACCAC‐3′ (antisense), with an expected PCR product of 861 bp; primers for CXCR4 were 5′‐GGCTGACTGGTACTTTGGGAAA‐3′ (sense) and 5′‐CCGGTCCAG‐ GCTGATGAA‐3′ (antisense), with a predicted PCR product of 106 bp; and primers for VCAM‐1 were 5′‐CTGGGAAGCTGGAACGAAGTA‐3′ (sense) and 5′‐GCCACTGAATTGAATCTCTG‐GAT‐3′ (antisense), with a predicted PCR product of 74 bp. Cycling conditions were 30 s of denaturation at 94°C, 30 s of annealing at 56–60°C, and 60 s of extension at 72°C. The relative amount of mRNA was determined with the computer program QuantityOne (Bio‐Rad, Hercules, CA, USA).
Western blot assay. 4T1 or T cells were lyzed in lysis buffer (Cell Signaling Technology) for 30 min on ice. Then a BCA kit (Pierce Biotechnology, Rockford, IL, USA) was used to determine the concentration of lysates. Cell extracts were separated by 10% sodium dodecylsulfate–polyacrylamide gel electrophoresis and transferred to a polyvinylidene difluoride membrane. The blot was probed with polyclonal antibodies EBAG9/C20, EBAG9/N18, GSK3β, phosphorylated GSK3β, and GAPDH mAb. Signals were developed using an enhanced chemiluminescence detection reagent. The relative protein level was determined with band intensities compared with GAPDH using the computer program QuantityOne (Bio‐Rad).
Cytokine release assay. The non‐adherent splenocytes derived from killed mice were stimulated with mitomycin C‐treated 4T1 cells. Supernatants were harvested after 24 h (for IL‐2 assay) or 72 h (for IFN‐γ assay). The cytokines were measured using a standard sandwich ELISA technique with corresponding kits.
Cytotoxic assay for CTL. For induction of CTL, the non‐adherent splenocytes derived from killed tumor‐bearing mice were cocultured with mitomycin C (50 µg/mL)‐treated 4T1 cells for 7 days in the presence of 20 U/mL recombinant mouse IL‐2. The viable lymphocytes collected were used as CTL effector cells, and 4T1 cells or CT26 cells (as a non‐specific control) were used as target cells. CTL activity was determined by a standard lactate dehydrogenase release assay.
Histological examination on tumor tissue. Tumor tissues for histology examination were collected on day 30, fixed in 10% formalin, and embedded in paraffin. Sections (5 µm thick) were prepared for hematoxylin–eosin staining. For CD8 immunofluorescence staining, tumor tissues were collected, embedded in OCT Compound and frozen at –70°C. Frozen sections (5–10 µm thick) were blocked and stained with phycoerythrin‐conjugated anti‐CD8 (BD Pharmingen) at room temperature in a humid chamber. Specimens were mounted in Mowiol 4‐88 (BD Biosciences, La Jolla, CA, USA). Samples were analyzed within 48 h using a Zeiss Axioplan microscope (Zeiss, Oberkochen, Germany) and a Photometrics PXL charge‐coupled device camera (Photometrics, Tucson, AZ, USA).
Statistics. All experiments were repeated two or three times, except as mentioned above. Statistical analysis was carried out using Student's t‐test or the log–rank test (for survival analysis). The difference was considered statistically significant when the P‐value was less than 0.05.
Results
EBAG9 expression in 4T1/EBAG9 and 4T1/siRNA cells. To explore whether EBAG9 expression influences tumor growth and metastasis in vivo, we generated a 4T1 cell line stably overexpressing EBAG9 by introducing recombinant plasmid pcDNA3.1(–B)/EBAG9 into 4T1 cells and G418 selection. PcDNA3.1 (–B) empty vector was also used to generate 4T1/Mock as a control cell line. The expression of EBAG9 was identified by RT‐PCR and Western blot analysis (Fig. 1a,b). The relative amounts of EBAG9 mRNA and protein in 4T1/EBAG9 cells were 5–6‐fold higher compared with those in parental 4T1 cells and 4T1/Mock.
Figure 1.
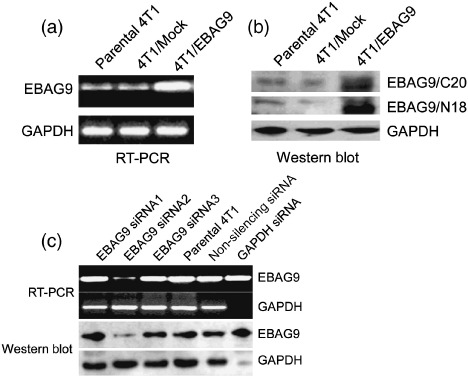
Generation of 4T1 mammary carcinoma cells stably overexpressing estrogen receptor‐binding fragment‐associated gene 9 (EBAG9) and screening of EBAG9/small interfering RNA (siRNA). The 4T1 cells were transfected with recombinant plasmid pcDNA3.1(– B)/EBAG9, or pcDNA3.1(–B) as a mock control using Lipofectamine 2000. G418 resistant cells were selected and several independent clones were isolated. The expression of EBAG9 in pcDNA3.1(–B)/EBAG9 transfected cell line 4T1/EBAG9 was detected by reverse transcription–polymerase chain reaction (RT‐PCR) (a) and Western blot analysis with anti‐N18 and anti‐C20 antibody (b). This experiment was carried out three times and one representative result is shown. Three siRNAs aimed at the murine EBAG9 gene were designed and synthesized to silence the EBAG9 gene. A non‐silencing siRNA and a glyceraldehyde‐3‐phosphate dehydrogenase (GAPDH) siRNA were also synthesized. 4T1 cells were transiently transfected with the three EBAG9 siRNAs, non‐silencing siRNA, and GAPDH siRNA using GeneSilencer reagent. RT‐PCR and Western blot analysis were carried out to determine the expression of EBAG9 or GAPDH (c). The screening assay was repeated six times.
To knock down the expression of EBAG9 in 4T1 cells, we synthesized three siRNAs targeting the mouse EBAG9 gene, using non‐silencing siRNA as a negative control. RT‐PCR and Western blot results showed (Fig. 1c) that EBAG9 siRNA2 was effective in silencing expression of EBAG9 in 4T1 cells transiently transfected, and the effectiveness was 73% in the protein level.
Overexpression of EBAG9 induced T cell hyporesponsiveness and phosphorylation of GSK3β in Ser9. We used MTT assay to test whether pcDNA3.1(–B)/EBAG9 and siRNA affect the proliferation of 4T1 cells. There was no difference in the cell viability between 4T1, 4T1/Mock, 4T1/pcDNA3.1(–B)/EBAG9, 4T1/siRNA2, or 4T1/Non‐silencing, indicating that the expression of EBAG9 did not directly affect 4T1 cell growth in vitro (Fig. 2a).
Figure 2.
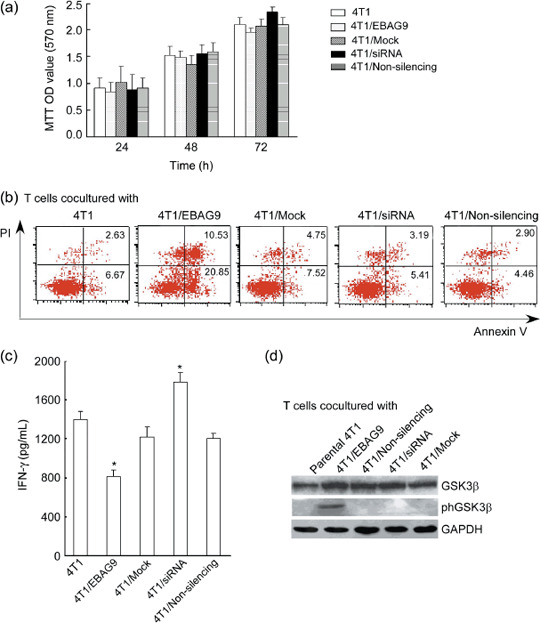
The in vitro effect of estrogen receptor‐binding fragment‐associated gene 9 (EBAG9) on 4T1 mammary carcinoma cell viability, T cell response and apoptosis. (a) 4T1 cell viability examined by thiazolyl blue (MTT) assay. After transfected with pcDNA3.1(–B)/EBAG9 (pcDNA3.1(–B) as a mock control) or EBAG9 small interfering RNA (siRNA) (non‐silencing siRNA as a control), 4T1 cell proliferation was evaluated at 24, 48 and 72 h. Absorbance was measured at 570 nm, with absorbance at 620 nm for reference. (b) T cell apoptosis detected by fluorescence‐activated cell sorting with propidium iodide (PI) and annexin V staining. Spleens from BALB/c mice were harvested and minced, a single‐cell suspension was prepared by filtration through sterile nylon wool, and red blood cells were lyzed with 0.83% ammonium. T cells were stimulated by mitomycin C (50 µg/mL)‐treated 4T1 transfectants (4T1/EBAG9, 4T1/Mock, 4T1/siRNA, 4T1/Non‐silencing, and parental 4T1) in the presence of plate‐coated anti‐CD3 (0.3 µg/mL) and harvested for apoptosis assay (PI and annexin V staining). In addition, culture supernatants were collected after 48 h stimulation and γ‐interferon (IFN‐γ) production was measured using enzyme‐linked immunosorbent assay kits (b). T cells were also harvested for Western blot analysis to determine the expression of glycogen synthase kinase 3β (GSK3β) or phosphorylated GSK3β (phGSK3β) in stimulated T cells (c). Data are shown as the mean ± standard deviation. Similar results were obtained in three independent experiments. OD, optical density. *P < 0.05.
To investigate whether expression of EBAG9 could induce the apoptosis of T cells, we examined the percentage of apoptotic cells by propidium iodide and annexin V staining after T cells were cocultured with different transfectants. As shown in Figure 2(b), increased apoptotic cells were observed in T cells stimulated with mitomycin C (50 µg/mL)‐treated 4T1/EBAG9 compared with those stimulated by 4T1/Mock or parental 4T1. When T cells were cocultured with 4T1/siRNA, it slightly decreased the rate of annexin V+ cells as compared to that of parental 4T1. The possible reason for no significant difference might be due to the relatively short‐term stimulation. After T cells were stimulated with mitomycin C‐treated 4T1/EBAG9, the production of IFN‐γ was inhibited significantly, while a slight increase of IFN‐γ production was shown in T cells cocultured with 4T1/siRNA (Fig. 2c). It suggested that overexpression of EBAG9 in 4T1 cells could induce apoptosis and hyporesponsiveness of T cells.
Furthermore, using Western blot analysis, we detected phosphorylated GSK3β in T cells stimulated by 4T1 transfectants. Although expression of total GSK3β made no difference in T cells stimulated by various 4T1 tranfectants, the expression of phosphorylated GSK3β could be detected in T cells stimulated with 4T1/EBAG. No expression was detected in T cells stimulated by other 4T1 tranfectants or parental 4T1 cells (Fig. 2d).
Overexpression of EBAG9 promoted while gene silencing of EBAG9 suppressed 4T1 tumor growth in vivo. RT‐PCR and Western blot analysis were carried out to detect the expression of EBAG9 in tumor mass from mice in different treatment groups. Expression of EBAG9 in tumor mass from the 4T1/EBAG9 group was markedly increased compared with those from other groups. The expression of EBAG9 in tumor mass from the EBAG9 siRNA group was very faint and could hardly be detected (Fig. 3a). This result showed that direct injection of siRNA into tumors could successfully knock down the EBAG9 expression in vivo.
Figure 3.
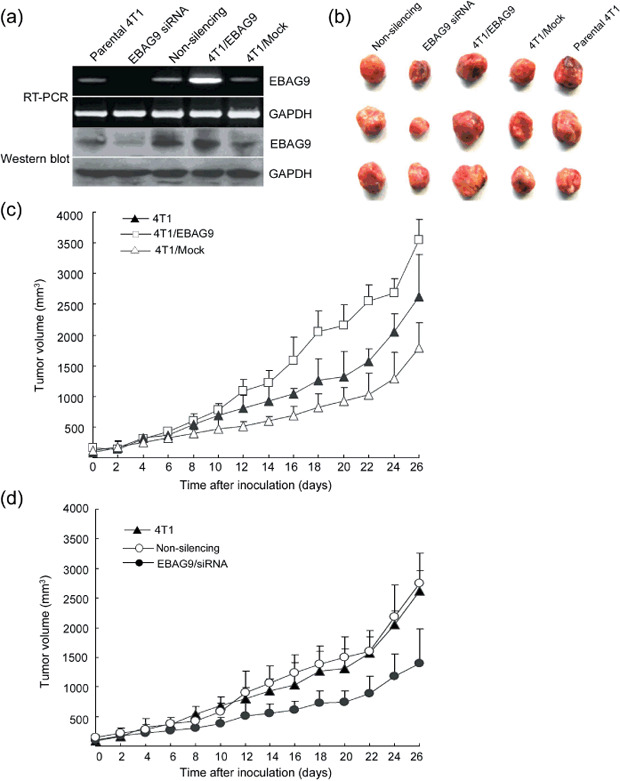
Overexpression of estrogen receptor‐binding fragment‐associated gene 9 (EBAG9) promoted, whereas silenced expression of EBAG9 suppressed, in vivo tumor growth of 4T1 cell mammary carcinoma. Female BALB/c mice were randomly divided into five groups with eight mice in each group. Mice in parental 4T1, EBAG9 small interfering RNA (siRNA) and non‐silencing groups were subcutaneously injected with 1 × 10⁶ 4T1 cells, whereas mice in 4T1/EBAG9 or 4T1/Mock groups were subcutaneously injected with 1 × 10⁶ 4T1/EBAG9 or 4T1/Mock cells, respectively. Five days after tumor inoculation, EBAG9 siRNA (10 µg) or non‐silencing siRNA (10 µg) were injected directly into tumors every 4 days with GeneSilencer reagent. Injections were carried out a total of six times. Three days after tumor inoculation, the tumor size was measured with a micrometer in two dimensions every 2 days. After the mice were killed, tumors were removed for reverse transcription–polymerase chain reaction (RT‐PCR) and Western blot analysis to verify the expression of EBAG9 in tumor mass (a) and to be photographed (b). The tumor volume was calculated with the formula: V = longest diameter × smallest diameter 2 . The tumor volume in different groups is shown in (c) and (d). Data are shown as the mean ± standard deviation. This experiment was carried out three times and a representative result is shown.
No difference in cell proliferation was found between 4T1/EBAG9 and 4T1/Mock cells in vitro. However, 4T1/EBAG9 cells subcutaneously implanted into BALB/c mice developed tumors twice the size of those in mice implanted with 4T1/Mock cells at 4 weeks after inoculation. In addition, the mean tumor volume for the 4T1/EBAG9 group was significantly larger than those from the 4T1/Mock or parental 4T1 groups (Fig. 3b,c; P < 0.05). These results suggest that overexpression of EBAG9 in 4T1 cells promoted tumor growth in vivo.
Five days after inoculation of 4T1 cells in BALB/c mice, EBAG9 siRNA and non‐silencing siRNA were directly injected into tumors to silence the expression of EBAG9. A total of six injections were carried out. After siRNA therapy, tumor volume in the EBAG9 siRNA group was overtly reduced compared with those in the 4T1/Non‐silencing group or parental 4T1 group (Fig. 3d; P < 0.05). These results suggest that silenced expression of EBAG9 overtly suppressed tumor growth in 4T1 cell carcinoma. In addition, the differences of tumor weights in different groups were consistent with the results of tumor volumes (data not shown).
Together, these results suggested that overexpression of EBAG9 promoted tumor growth in 4T1 carcinoma in vivo, whereas silenced expression of EBAG9 suppressed it.
In vivo overexpression of EBAG9 promoted suppressed tumor metastases. In addition to the effect on the primary 4T1 tumor growth, EBAG9 also exhibited influences on tumor metastasis. The 4T1 tumor has a high risk of systemic and disseminated metastases, especially to the lung, which is often the main cause of death.( 18 ) Here we noticed a large difference in the numbers of lung metastases in tumor‐bearing mice with various therapies. The lungs were harvested from killed tumor‐bearing mice 25 days after tumor inoculation and the metastasis was quantified by tumor colony formation assay. It showed that the number of tumor colonies in the EBAG9 siRNA group was significantly decreased compared with those in the non‐silencing or parental 4T1 groups. On the contrary, an overly increased tumor colony formation in the 4T1/EBAG9 group was observed and the number of tumor colonies was 2–3‐fold higher than those in the 4T1/Mock or parental 4T1 groups (Fig. 4a; P < 0.01).
Figure 4.
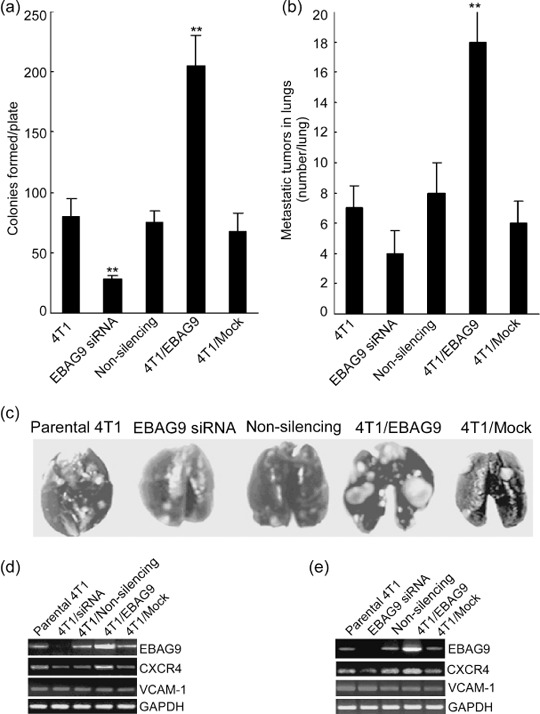
Overexpression of estrogen receptor‐binding fragment‐associated gene 9 (EBAG9) promoted, but gene silencing of EBAG9 inhibited, tumor metastases in vivo. (a) At 25 days after tumor inoculation, lungs from four mice in each group were minced to prepare a single cell suspension and cultured in a medium containing 6‐thioguanine (60 µmol/L) for colony formation. The resistant tumor cells formed foci within 12 days, at which time they were fixed with methanol and stained with 0.03% methylene blue for counting. Colongenic metastases were calculated on a per‐organ basis. (b) Metastatic 4T1 tumor nodules were also enumerated by the India ink staining method. Tumor nodules were counted blindly by three independent investigators. (c) A photograph of representative metastatic tumor nodules visualized by India ink staining in lungs from different groups. The mRNA expression of chemokine (C‐X‐C motif) receptor 4 (CXCR4) and vascular cell adhesion molecule 1 (VCAM‐1) were detected by reverse transcription–polymerase chain reaction in 4T1 cells (d) transiently transfected with EBAG9 small interfering RNA (siRNA) (non‐silencing siRNA as a control) or with pcDNA3.1(– B)/EBAG9 (pcDNA3.1(–B) as a mock control) and tumor mass (e) from parental 4T1, EBAG9/siRNA, non‐silencing, 4T1/EBAG9 or 4T1/Mock groups. The assay was carried out three times and similar results were obtained. GAPDH, glyceraldehyde‐3‐phosphate dehydrogenase. **P < 0.01.
In addition, lungs derived from the killed mice were stained with India ink and restained with Fekete's solution for visualization of the individual metastatic tumor nodules on the surface. There were twice as many tumor nodules in lungs from the 4T1/EBAG9 group compared with those from the 4T1/Mock or parental 4T1 groups (Fig. 4b,c; P < 0.01). However, it seemed that the mean number of tumor nodules in lungs from the EBAG9 siRNA group was fewer than that from the non‐silencing or parental 4T1 groups, although no significant difference was calculated. This result might be explained in that the staining assay mainly reflected the metastasis on the lung surface whereas the tumor colony formation assay reflected the metastasis in the whole lung.
Considering CXCR4 and VCAM‐1 are important molecules involved in breast cancer metastasis, we detected their levels of expression parental 4T1, 4T1/EBAG9, 4T1/Mock, 4T1/siRNA, and 4T1/Non‐silencing cells in vitro and in vivo. RT‐PCR analysis showed that mRNA expression of CXCR4 was markedly enhanced in pcDNA3.1(–B)/EBAG9 transfected 4T1 cells (Fig. 4d) and 4T1/EBAG9 tumor tissues in vivo (Fig. 4e) compared to other groups, but there was no difference in VCAM‐1 mRNA expression in these different transfectants or in tumor tissues from different groups.
Together, these results suggest that overexpression of EBAG9 in 4T1 cell carcinoma promoted lung metastasis, whereas gene silencing of EBAG9 remarkably repressed tumor metastasis. Enhanced expression of CXCR4 in 4T1/EBAG9 cells might be involved in the promotion of lung metastasis.
Gene silencing of EBAG9 prolonged survival of tumor‐bearing mice and increased infiltration of CD8+ T cells in tumor mass. Eight mice in each group were observed for survival. Fifty percent of mice in the EBAG9 siRNA group and 25% of mice in the 4T1/Mock group survived more than 90 days after tumor inoculation. Mice in the 4T1/EBAG9 group all died at approximately day 40, and mice in the parental 4T1 and non‐silencing group all died at approximately day 50 (Fig. 5a). This result showed that silenced expression of EBAG9 significantly prolonged mice survival, suggesting a long protective immunity might be established.
Figure 5.
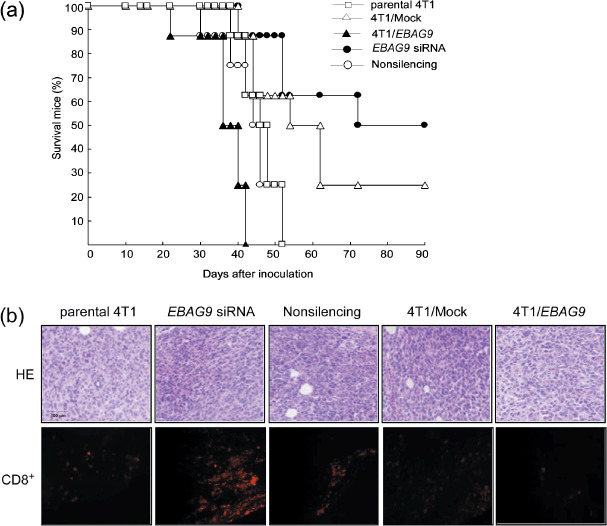
Gene silencing of estrogen receptor‐binding fragment‐associated gene 9 (EBAG9) prolonged survival of tumor‐bearing mice and increased infiltration of CD8+ T cells in tumor mass. (a) Eight mice in each group (parental 4T1, 4T1/EBAG9, 4T1/Mock, EBAG9 small interfering RNA [siRNA], and non‐silencing) were observed for survival time within 90 days after tumor inoculation. (b) Hematoxylin–eosin (HE; upper panel) and immunofluorescence (lower panel) staining of tumor mass after various therapies. Tumor tissues from different groups were collected on day 30, fixed in 10% formalin, and embedded in paraffin. Sections (5 µm thick) were prepared for HE staining. For immunofluorescence staining, tumor tissues were collected, embedded in OCT Compound and frozen at –70°C. Frozen sections were fixed, blocked and stained with phycoerythrin‐conjugated anti‐CD8.
Subcutaneous tumor nodules were taken from killed tumor‐bearing mice for histological examination. Many more inflammatory cells, including neutrophils, lymphocytes and monocytes, were observed inside the tumors in the EBAG9 siRNA group with hematoxylin–eosin staining. Medium inflammatory cell infiltration was present in the tumors in the 4T1/Mock and non‐silencing group, and few infiltrations were found in the parental 4T1 and 4T1/EBAG9 groups. Immunofluorescence staining with phycoerythrin–anti‐CD8 also suggested EBAG9 siRNA therapy increased infiltration of CD8+ T cells in the tumor mass. (Fig. 5b).
EBAG9 siRNA therapy enhanced specific CTL activity of host and induced Th1‐type cytokine production. To evaluate whether aberrant EBAG9 expression in 4T1 cell carcinoma affected the antitumor immune responses of the host, we analyzed NK activity and specific CTL activity of splenocytes. There was no difference in the NK activity of splenocytes derived from tumor‐bearing mice in different groups (data not shown). Splenocytes isolated from the killed tumor‐bearing mice were restimulated in vitro by coculture with mitomycin C‐treated 4T1 cells for 5 days, for CTL induction. These cells were then collected and used as effector cells, their cytolytic activities against 4T1 cells were determined at effector : target ratios of 100:1, 50:1, and 25:1 by a standard lactate dehydrogenase release assay. Spleen cells derived from mice treated with EBAG9 siRNA had strikingly higher specific CTL activity compared with those from other groups (Fig. 6a; P < 0.01), indicating that gene silencing of EBAG9 potently induced the specific CTL activity against the 4T1 tumors.
Figure 6.
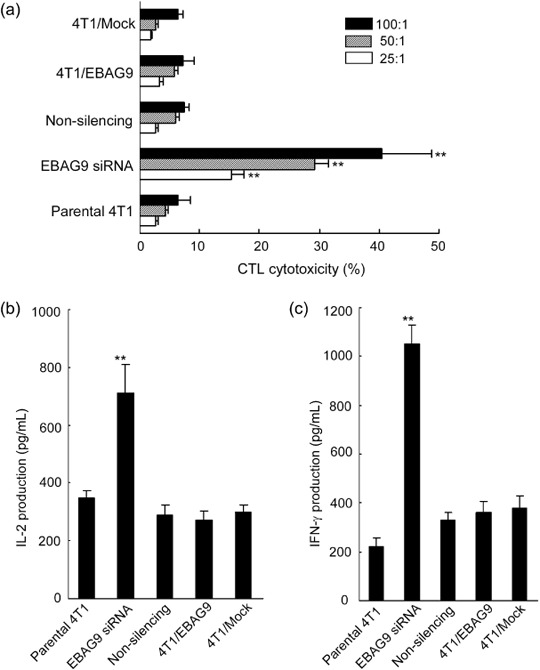
Induction of specific cytotoxic T lymphocyte (CTL) activity and Th1 cytokine production by gene silencing of estrogen receptor‐binding fragment‐associated gene 9 (EBAG9) in 4T1 mammary carcinoma cells. (a) Splenocytes isolated from tumor‐bearing mice in parental 4T1, 4T1/EBAG9, 4T1/Mock, EBAG9 small interfering RNA (siRNA), and non‐silencing groups were restimulated in vitro with mitomycin C‐treated 4T1 cells in the presence of recombinant interleukin (IL)‐2 (20 U/mL) for 5 days for CTL induction. These cells were then collected and used as effector cells, their cytolytic activities against 4T1 cells were determined at effector:target ratios of 100:1, 50:1 and 25:1 by a standard lactate dehydrogenase release assay. The CTL assay was carried out in triplicate and repeated twice independently, and consistent results were obtained. The culture supernatants of splenocytes derived from various groups were also collected and assayed for IL‐2 (b) and γ‐interferon (IFN‐γ) (c) production by enzyme‐linked immunosorbent assay kits. Data are presented as mean ± standard deviation. **P < 0.01.
Moreover, the culture supernatants of splenocytes derived from various groups were also collected and assayed for IFN‐γ and IL‐2 production by ELISA. It was noted that the productions of IFN‐γ and IL‐2 from splenocytes derived from the EBAG9 siRNA group were significantly increased compared with those from other groups (Fig. 6b,c; P < 0.01). This result suggested that the splenocytes from EBAG9 siRNA‐treated mice were inclined to produce more Th1‐type cytokines and the enhanced antitumor effects could be related to increased production of Th1 cytokines.
Discussion
The present study provided the first in vivo evidence that expression of EBAG9 promoted tumor growth and metastasis in a spontaneously metastatic breast cancer model. Overexpression of EBAG9 or knockdown of EBAG9 by siRNA significantly promoted or attenuated, respectively, 4T1 tumor growth and metastasis. T cells underwent apoptosis when cocultured with mitomycin C‐treated 4T1 cells overexpressing EBAG9, and IFN‐γ production was also inhibited as compared to T cells stimulated with parental 4T1. Knockdown of EBAG9 expression slightly enhanced IFN‐γ production, suggesting that expression of EBAG9 in tumor cells might induce hyporesponsiveness of T cells in vitro. These results were in agreement with the published work showing RCAS1 (generally considered as the same molecule as EBAG9) induced apoptosis in activated T cells.( 7 ) Their study suggested that RCAS1 was a trans‐membrane molecule, and that activated T cells expressed a putative RCAS1 receptor, and apoptosis was induced after the binding between RCAS1 and the RCAS1 receptor. However, other reports have provided conflicting results without showing any such significant relationship. Engelsberg et al.( 19 ) showed that EBAG9 was predominantly located on Golgi and EBAG9 was not able to induce apoptosis, also confirmed by studies of Reimer et al.( 20 ) To further analyze the mechanism of T cell hyporesponsiveness, we detected the level of GSK3β and phosphorylated GSK3β in stimulated T cells. Consisting of two isoforms, GSK3α and GSK3β, GSK3 was originally considered to be inexorably linked to glycogen metabolism. Increasing knowledge has changed the image of GSK3β to that of a broadly influential enzyme that is a crucial regulator of many cellular functions including cellular structure, growth, motility, and apoptosis.( 21 ) GSK3β activity was significantly reduced by phosphorylation of an N‐terminal serine, Ser9, in GSK3β, and Ser21 in GSK3α. One of the isoforms, GSK3β, was recently reported to be necessary in cell survival, including attenuating to apoptosis and NF‐κB activation.( 22 ) GSK3 regulated Toll‐like receptor (TLR)‐mediated inflammatory response by differentially affecting the nuclear amounts of transcription factors NF‐κB subunit p65 and cAMP response element binding protein (CREB) interacting with the coactivator CREB‐binding protein (CBP).( 23 ) In this study, we detected the GSK3β activity in T cells cocultured with 4T1 transfectants. An enhanced product of Ser9 phosphorylated GSK3β was detected in T cells cocultured with 4T1/EBAG9, whereas total GSK3β made little difference among T cells stimulated with various transfectants, suggesting that GSK3β activity in T cells was significantly reduced by coculturing with 4T1/EBAG9. Phosphorylation of Ser9 in GSK3β might be involved in the hyporesponsiveness of T cells induced by EBAG9, but the signaling pathway remains to be clarified.
As a highly metastatic mammary cancer cell line, 4T1 was a model for stage IV human breast cancer.( 13 ) We used this model to evaluate the effect of EBAG9 on the local tumor growth, lung metastases and antitumor immune response of the host. Overexpression of EBAG9 overtly promoted tumor growth and metastasis, whereas silencing expression of EBAG9 significantly inhibited tumor growth and lung metastasis. These results were in part consistent with a previous study of EBAG9 in renal cell carcinoma.( 12 ) Interestingly, we noted a significant difference in tumor volume between parental 4T1 and 4T1/Mock at 4 weeks after inoculation, although no difference existed in cultured cells in vitro. The mechanism remains to be investigated. Knockdown expression of EBAG9 in 4T1 generated 1/2 fold tumor volume compared with 4T1/Non‐silencing or parental 4T1. Histological examination of tumor mass showed increased infiltration of CD8+ T cells in the EBAG9 siRNA group compared with other groups. Enhanced CTL activity and amplified IL‐2 and IFN‐γ production was induced by EBAG9 siRNA therapy. However, more studies need to be done to further elucidate the molecular events involved in the relationship between tumor progress and EBAG9. In the field of tumor immunology, recent attention has turned toward the mechanisms of immune evasion at the effector phase of the antitumor immune response, predominantly within the tumor microenvironment. Evidence is accumulating that T cell‐intrinsic hyporesponsiveness or anergy, extrinsic suppression by regulatory cell populations,( 24 ) inhibitory ligands such as PD‐L1,( 25 ) soluble factors such as TGF‐β,( 26 ) and the activity of nutrient‐catabolizing enzymes such as indoleamine 2,3‐dioxygenase,( 27 ) might contribute to immune escape in different settings.
EBAG9 was originally found to be an estrogen‐responsive gene in human breast cancer MCF‐7 cells.( 1 ) We also found that estrogen could upregulate, and progesterone can downregulate, EBAG9 expression in the mRNA and protein levels in the MCF‐7 breast cancer cell line (data not shown). There is a significant number of published reports that link exposure to estrogen as a risk factor for the development of breast cancer.( 28 ) Postulated mechanisms include direct stimulation of proliferation in breast tissue, increasing the probability of introduction of a harmful mutation in dividing cells,( 29 ) and blocking the ability of immune cells to induce apoptosis of target cancer cells.( 30 ) Our results suggested expression of EBAG9 might be an important factor in immune escape by inducing hyporesponsiveness of T cells during breast cancer progress. Thus, EBAG9 might be a possible mechanism involved in the estrogen contribution to the development of breast cancer.
The 4T1 tumor has a high risk of systemic and disseminated metastases, especially to the lung, which may be the main cause of death.( 18 ) We used India ink staining and colony formation assay to evaluate the role of EBAG9 expression in tumor metastasis.( 14 , 17 ) In the 4T1/EBAG9 group, the number of colony formations and tumor nodules on the surface of the lungs was two to three times higher than in other groups. However, the number of colony formations in the EBAG9 siRNA group was much less than in other groups, indicating that EBAG9 might be a good therapeutic target for the regression of tumor metastasis. Survival analysis showed mice in the 4T1/EBAG9 group had the shortest survival time (approximately 40 days), whereas 50% of the mice in the EBAG9 siRNA group survived more than 90 days, consistent with the results of metastatic colony formation, as systemic metastases largely accounted for death in all deceased cases. Interestingly, mice in the 4T1/Mock group have slightly inhibited tumor size and prolonged survival time as compared to those in the parental 4T1 group, suggesting unknown mechanisms. A set of genes that mediated breast cancer metastasis to the lungs were recently identified and, among them, VCAM‐1 and CXCR4 were important molecules.( 31 ) Many studies showed that chemokines and chemokine receptors were proposed to have important functions in breast cancer metastasis.( 32 , 33 , 34 ) Immunohistological examination on human invasive breast carcinoma tissue showed a significant correlation between relative expression levels of CXCR4 and the extent of lymph node metastases.( 35 ) In this study, we tested whether the expression of VCAM‐1 and CXCR4 was influenced by expression of EBAG9 in 4T1 cells. The results showed no difference in the mRNA expression of VCAM‐1, whereas significantly enhanced expression of CXCR4 was detected in 4T1/EBAG9 compared with parental 4T1 or 4T1/Mock in vitro and in vivo. It indicated that upregulation of CXCR4 might be involved in the role of EBAG9 promoting 4T1 tumor metastasis. The possible mechanism of induction of CXCR4 by EBAG9, by direct interaction or through other signal molecules, remains to be further elucidated.
In summary, we showed that EBAG9 was a promoting factor in both tumor growth and systemic metastasis in the 4T1 model. The possible mechanism might lie in that EBAG9 induces hyporesponsiveness of infiltrating T cells. In addition, CXCR4 might play a certain role in EBAG9‐promoted tumor metastasis. Our data could provide insights into the mechanisms through which tumors evade immunosurveillance and provide a strategy for therapeutic intervention of cancer metastases.
Acknowledgments
This work was supported by grants from the National Natural Science Foundation of China (#30100163, 30328011), the National Key Basic Research Program of China (2004CB518802).
References
- 1. Watanabe T, Inoue S, Hiroi H, Orimo A, Kawashima H, Muramatsu M . Isolation of estrogen‐responsive genes with a CpG island library. Mol Cell Biol 1998; 18: 442–9. [DOI] [PMC free article] [PubMed] [Google Scholar]
- 2. Tsuchiya F, Ikeda K, Tsutsumi O et al . Molecular cloning and characterization of mouse EBAG9, homolog of a human cancer associated surface antigen: expression and regulation by estrogen. Biochem Biophys Res Commun 2001; 284: 2–10. [DOI] [PubMed] [Google Scholar]
- 3. Suzuki T, Inoue S, Kawabata W et al . EBAG9/RCAS1 in human breast carcinoma: a possible factor in endocrine–immune interactions. Br J Cancer 2001; 85: 1731–7. [DOI] [PMC free article] [PubMed] [Google Scholar]
- 4. Akahira JI, Aoki M, Suzuki T et al . Expression of EBAG9/RCAS1 is associated with advanced disease in human epithelial ovarian cancer. Br J Cancer 2004; 90: 2197–202. [DOI] [PMC free article] [PubMed] [Google Scholar]
- 5. Takahashi S, Urano T, Tsuchiya F et al . EBAG9/RCAS1 expression and its prognostic significance in prostatic cancer. Int J Cancer 2003; 106: 310–15. [DOI] [PubMed] [Google Scholar]
- 6. Aoki T, Inoue S, Imamura H et al . EBAG9/RCAS1 expression in hepatocellular carcinoma: correlation with tumour dedifferentiation and proliferation. Eur J Cancer 2003; 39: 1552–61. [DOI] [PubMed] [Google Scholar]
- 7. Nakashima M, Sonoda K, Watanabe T. Inhibition of cell growth and induction of apoptotic cell death by the human tumor‐associated antigen RCAS1. Nat Med 1999; 5: 938–42. [DOI] [PubMed] [Google Scholar]
- 8. Matsushima T, Nakashima M, Oshima K et al . Receptor binding cancer antigen expressed on SiSo cells, a novel regulator of apoptosis of erythroid progenitor cells. Blood 2001; 98: 313–21. [DOI] [PubMed] [Google Scholar]
- 9. Sonoda K, Miyamoto S, Yamazaki A et al . Biologic significance of receptor‐binding cancer antigen expressed on SiSo cells (RCAS1) as a pivotal regulator of tumor growth through angiogenesis in human uterine cancer. Cancer 2007; 110: 1979–90. [DOI] [PubMed] [Google Scholar]
- 10. Oshikiri T, Miyamoto M, Morita T et al . Tumor‐associated antigen recognized by the 22‐1‐1 monoclonal antibody encourages colorectal cancer progression under the scanty CD8+ T cells. Clin Cancer Res 2006; 12: 411–16. [DOI] [PubMed] [Google Scholar]
- 11. Chatterjee M, Mohapatra S, Ionan A et al . Diagnostic markers of ovarian cancer by high‐throughput antigen cloning and detection on arrays. Cancer Res 2006; 66: 1181–90. [DOI] [PMC free article] [PubMed] [Google Scholar]
- 12. Ogushi T, Takahashi S, Takeuchi T et al . Estrogen receptor‐binding fragment‐associated antigen 9 is a tumor‐promoting and prognostic factor for renal cell carcinoma. Cancer Res 2005; 65: 3700–6. [DOI] [PubMed] [Google Scholar]
- 13. Aslakson CJ, Miller FR. Selective events in the metastatic process defined by analysis of the sequential dissemination of subpopulations of a mouse mammary tumor. Cancer Res 1992; 52: 1399–405. [PubMed] [Google Scholar]
- 14. Pulaski BA, Ostrand‐Rosenberg S. Reduction of established spontaneous mammary carcinoma metastases following immunotherapy with major histocompatibility complex class II and B7.1 cell‐based tumor vaccines. Cancer Res 1998; 58: 1486–93. [PubMed] [Google Scholar]
- 15. Coveney E, Wheatley GH 3rd, Lyerly HK. Active immunization using dendritic cells mixed with tumor cells inhibits the growth of primary breast cancer. Surgery 1997; 122: 228–34. [DOI] [PubMed] [Google Scholar]
- 16. Pulaski BA, Clements VK, Pipeling MR, Ostrand‐Rosenberg S. Immunotherapy with vaccines combining MHC class II/CD80+ tumor cells with interleukin‐12 reduces established metastatic disease and stimulates immune effectors and monokine induced by interferon gamma. Cancer Immunol Immunother 2000; 49: 34–45. [DOI] [PMC free article] [PubMed] [Google Scholar]
- 17. Lewis JD, Shearer MH, Kennedy RC, Bright RK. Surrogate tumor antigen vaccination induces tumor‐specific immunity and the rejection of spontaneous metastases. Cancer Res 2005; 65: 2938–46. [DOI] [PubMed] [Google Scholar]
- 18. Brin E, Atencio I, Helmich BK, Maneval D, Laface D . Adenovirus delivery provides extended interferon‐alpha exposure and augments treatment of metastatic carcinoma. Cancer Gene Ther 2006; 13: 664–75. [DOI] [PubMed] [Google Scholar]
- 19. Engelsberg A, Hermosilla R, Karsten U, Schulein R, Dorken B, Rehm A . The Golgi protein RCAS1 controls cell surface expression of tumor‐associated O‐linked glycan antigens. J Biol Chem 2003; 278: 22998–3007. [DOI] [PubMed] [Google Scholar]
- 20. Reimer TA, Anagnostopoulos I, Erdmann B et al . Reevaluation of the 22‐1‐1 antibody and its putative antigen, EBAG9/RCAS1, as a tumor marker. BMC Cancer 2005; 5: 47. [DOI] [PMC free article] [PubMed] [Google Scholar]
- 21. Jope RS, Johnson GV. The glamour and gloom of glycogen synthase kinase‐3. Trends Biochem Sci 2004; 29: 95–102. [DOI] [PubMed] [Google Scholar]
- 22. Hoeflich KP, Luo J, Rubie EA, Tsao MS, Jin O, Woodgett JR . Requirement for glycogen synthase kinase‐3beta in cell survival and NF‐kappaB activation. Nature 2000; 406: 86–90. [DOI] [PubMed] [Google Scholar]
- 23. Martin M, Rehani K, Jope RS, Michalek SM. Toll‐like receptor‐mediated cytokine production is differentially regulated by glycogen synthase kinase 3. Nat Immunol 2005; 6: 777–84. [DOI] [PMC free article] [PubMed] [Google Scholar]
- 24. Hinz S, Pagerols‐Raluy L, Oberg HH et al . Foxp3 expression in pancreatic carcinoma cells as a novel mechanism of immune evasion in cancer. Cancer Res 2007; 67: 8344–50. [DOI] [PubMed] [Google Scholar]
- 25. Zha Y, Blank C, Gajewski TF. Negative regulation of T‐cell function by PD‐1. Crit Rev Immunol 2004; 24: 229–37. [DOI] [PubMed] [Google Scholar]
- 26. Liu VC, Wong LY, Jang T et al . Tumor evasion of the immune system by converting CD4+CD25− T cells into CD4+CD25+ T regulatory cells: role of tumor‐derived TGF‐beta. J Immunol 2007; 178: 2883–92. [DOI] [PubMed] [Google Scholar]
- 27. Uyttenhove C, Pilotte L, Theate I et al . Evidence for a tumoral immune resistance mechanism based on tryptophan degradation by indoleamine 2,3‐dioxygenase. Nat Med 2003; 9: 1269–74. [DOI] [PubMed] [Google Scholar]
- 28. Marshall E. Epidemiology. Search for a killer: focus shifts from fat to hormones. Science 1993; 259: 618–21. [DOI] [PubMed] [Google Scholar]
- 29. Yager JD, Liehr JG. Molecular mechanisms of estrogen carcinogenesis. Annu Rev Pharmacol Toxicol 1996; 36: 203–32. [DOI] [PubMed] [Google Scholar]
- 30. Curran EM, Judy BM, Duru NA et al . Estrogenic regulation of host immunity against an estrogen receptor‐negative human breast cancer. Clin Cancer Res 2006; 12: 5641–7. [DOI] [PubMed] [Google Scholar]
- 31. Minn AJ, Gupta GP, Siegel PM et al . Genes that mediate breast cancer metastasis to lung. Nature 2005; 436: 518–24. [DOI] [PMC free article] [PubMed] [Google Scholar]
- 32. Muller A, Homey B, Soto H et al . Involvement of chemokine receptors in breast cancer metastasis. Nature 2001; 410: 50–6. [DOI] [PubMed] [Google Scholar]
- 33. Liang Z, Wu T, Lou H et al . Inhibition of breast cancer metastasis by selective synthetic polypeptide against CXCR4. Cancer Res 2004; 64: 4302–8. [DOI] [PubMed] [Google Scholar]
- 34. Tamamura H, Hori A, Kanzaki N et al . T140 analogs as CXCR4 antagonists identified as anti‐metastatic agents in the treatment of breast cancer. FEBS Lett 2003; 550: 79–83. [DOI] [PubMed] [Google Scholar]
- 35. Kato M, Kitayama J, Kazama S, Nagawa H. Expression pattern of CXC chemokine receptor‐4 is correlated with lymph node metastasis in human invasive ductal carcinoma. Breast Cancer Res 2003; 5: R144–50. [DOI] [PMC free article] [PubMed] [Google Scholar]