

Abstract
Somatic mutations introduced into the epidermal growth factor receptor (EGFR) gene in non‐small‐cell lung cancer (NSCLC) are important factors to determine therapeutic responses to gefitinib. The current diagnostic test measures the overall EGFR mutation status of the cancer tissue, and may ignore the presence of non‐mutated, gefitinib‐unresponsive cancer cells. Twenty‐one NSCLC patients with EGFR mutations were recruited for the study. All patients were treated with gefitinib after surgical treatment. Fifty to sixty areas of NSCLC tumors were sampled from each tissue, and their EGFR mutation states were determined by a primer extension assay. This assay discriminates between EGFR mutation‐positive and ‐negative cancer cells within a single tumor tissue. Fifteen tissues consisted only of cells with EGFR mutations, but the remaining six tissues contained both mutated and non‐mutated cells. Time to disease progression and overall survival after gefitinib treatment were significantly shorter in those patients with EGFR heterogeneity (P = 0.009 and P = 0.003, respectively). A considerable proportion of NSCLC contains a heterogeneous population of both EGFR mutated and non‐mutated cancer cells, resulting in a reduced response to gefitinib. The intratumor genetic heterogeneity of a target molecule such as EGFR would be an important factor to consider when treating patients with molecular target agents. (Cancer Sci 2008; 99: 929–935)
Abbreviations:
- EGFR
epidermal growth factor receptor
- NSCLC
non‐small‐cell lung cancer
- PCR
polymerase chain reaction
- SNP
Single nucleotide polymorphism
- TKI
tyrosine kinase inhibitor
Lung cancer is a major cause of death. In addition, because many patients are diagnosed at an advanced cancer stage, effective anticancer drugs are urgently needed. TKI of EGFR (i.e. gefitinib and erlotinib) are a new entity of anticancer drugs and have the potential to improve the therapy of advanced‐stage lung cancer.( 1 ) EGFR is a transmembrane protein that induces a signal transduction cascade upon ligand binding. It is activated through autophosphorylation of a tyrosine residue in the cytoplasmic domain, causing the receptor to dimerize and internalize, and triggering a cascade leading to cellular proliferation, inhibition of apoptosis, and other cancer‐related activities.( 2 ) EGFR TKI inhibit this cascade by blocking autophosphorylation.
There have been extensive studies on the clinical effects of gefitinib. The objective response rate to gefitinib is from 9 to 19%.( 3 , 4 ) Patients’ characteristics, such as adenocarcinoma histology, female sex, non‐smoking history, and Asian race, are associated with an increased response to gefitinib, and may guide treatment decisions.( 3 , 4 , 5 ) In addition, many studies have shown a correlation between somatic EGFR mutations and increased responsiveness to gefitinib.( 6 , 7 , 8 , 9 , 10 ) Such EGFR mutations are found frequently in NSCLC, and are predominantly located in exons 19 and 21, corresponding to the tyrosine kinase domain. A similar correlation is also reported with erlotinib.( 11 , 12 )
Japanese patients with NSCLC have a high proportion of EGFR mutations, and these mutations have been correlated with an increased responsiveness to gefitinib.( 7 , 10 ) However, there are NSCLC patients with EGFR mutations that have poor responses to gefitinib, suggesting that there are other factors determining responsiveness to gefitinib.( 10 )
One of the biological factors possibly related to the responsiveness of gefitinib is genetic heterogeneity within a single tumor tissue.( 13 ) A tumor tissue usually consists of cancer cells with different genetic alterations, and such intratumor heterogeneity could contribute to resistance to anticancer drugs. In the present report, we examined genetic intratumor heterogeneity of EGFR mutations in NSCLC tissues using a refined sampling method and mutation detection by primer extension.
Methods
Patients and clinical characteristics. We recruited 21 NSCLC patients who were treated with gefitinib as monotherapy for postoperative recurrence. Surgical resection was complete in all patients except no. 4, whose resection was incomplete due to pleural dissemination. Patients had surgery between December 1996 and April 2003 and initiated gefitinib treatment from August 2002 to October 2005 at Osaka Medical Center for Cancer and Cardiovascular Diseases. The ethical committee of Osaka Medical Center for Cancer and Cardiovascular Diseases (chaired by Dr Hiroshi Nakajima) approved the current research, and informed consent was obtained for all cases. All patients were Japanese, and clinical information was obtained by reviewing patient medical records. Patients were diagnosed with NSCLC by histological examination of hematoxylin–eosin‐stained sections of the formalin‐fixed, paraffin‐embedded primary tumor. Surviving patients were censored at the date of last contact with the institution. Tumor recurrences were not necessarily confirmed pathologically but were diagnosed with imaging, clinical manifestation, and laboratory examination. In patients with measurable disease, tumor responses were assessed by the Response Evaluation Criteria in Solid Tumors( 14 ) and categorized as a complete response, partial response, or no objective response. Tumor response was not evaluated in two patients (patients 16 and 17) because these patients had no measurable disease. However, their diseases, which were malignant effusion in the thoracic cavity (patient 16) and pericardiac space (patient 17), were well controlled after drainage with gefitinib treatment for 30 and 450 days, respectively. Time to disease progression and overall survival were calculated from the start date of gefitinib therapy to the date of disease progression or death.
Determination of the EGFR mutation status. Tumor samples collected during surgery were frozen rapidly in liquid nitrogen and stored at –80°C. The tumor was divided into two pieces: one was used for RNA extraction and cDNA sequencing, and the other was used for tissue sections. Total RNA was purified from tumor tissues with Trizol reagent (Invitrogen, Carlsbad CA, USA) and purified RNA was quantitated and assessed for purity by ultraviolet spectrophotometry. cDNA was generated from 5 µg of RNA with Superscript III (Invitrogen) according to the manufacturer's protocol. An EGFR gene fragment covering exons 18–24 was amplified using primers 5′‐GGATCGGCCTC TTCATGC‐3′ and 5′‐AACTTTGGGCGACTATCTGC‐3′. The amplified products were sequenced directly using the BigDye Terminator Cycle Sequencing Kit (version 3.1; Applied Biosystems, Foster City, CA, USA) with the ABI PRISM 3730 (Applied Biosystems). After the results of the direct sequencing of PCR products for SNaP shot (Applied Biosystems), oligonucleotide primers were designed next to the mutated nucleotides.
Multipoint microsampling. Tumors were cut into 35 µm‐thick sections in a cryostat, and stained with 0.05% toluidine blue. About 50–60 areas, 104 µm2 in size including 30–50 cells, were selected randomly avoiding normal cells, and microdissected using the AS LMD system (Leica Wetzler, Germany). Genomic DNA was extracted from each sampled area with the QIAamp DNA Micro Kit (Qiagen, Hilden, Germany), and suspended with 20 µL of distilled water. A DNA fragment containing the mutated or SNP locus was amplified by PCR.
Polymerase chain reactions consisted of 1 × PCR buffer (Toyobo, Osaka, Japan), 0.1 mM MgSO4, 0.2 mM dNTP each 0.02 U/µL KOD Plus DNA polymerase and template DNA in a 10‐µL reaction volume. The base of interest was determined by the SNaP shot assay, according to the manufacturer's guidelines with minor modifications. The SNaP shot assay is based on a primer‐extension assay: each extension primer binds to a complementary template in the presence of fluorescently labeled ddNTP and DNA polymerase, and the polymerase extends the primer by one nucleotide, adding a single dideoxynucleotide to its 3′ end. Fluorescent dyes used for dideoxynucleotides were as follows: A, dR6G; C, dTAMRA; G, dR110; and T, dROX. Before the SNaP shot assay, 7.5 µL of PCR products were treated with 1 U shrimp alkaline phosphatase (Takara, Kyoto, Japan) and 1 U exonuclease I (Takara) for 1 h at 37°C in a final volume of 10 µL, followed by inactivation of the enzymes for 30 min at 80°C. SNaP shot thermal cycling was carried out in 5 µL, containing 0.2 µL of treated PCR product, 2.5 µL SNaPshot Ready Reaction Premix (Applied Biosystems), 1 mM extension primer, and 1.8 µL distilled water. Cycling conditions were as follows: denaturation with 25 cycles of 10 s at 96°C, annealing with 5 s at 50°C, and extension with 30 s at 60°C. To remove unincorporated ddNTP 5 µL of SNaPshot products were incubated at 37°C for 1 h with 1 U shrimp alkaline phosphatase in a final volume of 6 µL, and the enzyme was deactivated as described above. A total of 0.1 µL of treated SNaP shot reaction was denatured in 9.9 µL of distilled water for 5 min at 95°C, and was analyzed using an ABI PRISM 3100 Genetic Analyzer (Applied Biosystems). The fragment analysis was done with GeneScan software (Applied Biosystems).
The mutation status or SNP base on each allele was determined from the incorporated nucleotides. Because the intrinsic fluorescense intensity of each dye is different, we measured the relative fluorescense intensity ratio, and adjusted the outputs of the DNA analyzer. The values used to adjust differences in the intrinsic fluorescence intensities of dyes were as follows: dR110/dROX, 2.12; dR6G/dR110, 0.66; and dTAMARA/dROX, 0.67. The primer sequences for genomic DNA amplification and the SNaP shot assay are listed in Tables S1 and S2, respectively. The SNP loci used for control studies were selected from JSNP (a repository of Japanese Single Nucleotide Polymorphism)( 15 ) using the following criteria: (1) they were on chromosome 16, which rarely changes in lung cancer; and (2) high frequency of the minor allele.
Measurement of EGFR amplification. The experiment was carried out as described previously,( 10 ) except for the primers used in EGFR amplification. The sequences of the primers and TaqMan probe were 5′‐GGAGGACCGTCGCTTGGT‐3′, 5′‐TCTTGA CATGCTGCGGTGTT‐3′, and 5′‐CACCGCGACCTGGCAGC CA‐3′. Control DNA was purified from leukocytes of five normal individuals. The threshold of the amplification was set at three as described previously.
Statistical analysis. Statistical analysis (Kaplan–Meier analysis) was carried out using SPSS Windows version (SPSS Inc., Chicago, IL, US). Two‐sided P‐values were calculated using the log‐rank test.
Results
Principle of the assay. Theoretical and experimental studies on colorectal cancer using microsatellite instability have shown that cancer cells of the same genotype locate contiguously.( 16 ) Therefore, if a sample excised from a tumor tissue is small enough, it will contain a genetically identical population of cancer cells. If a tumor tissue consists of cancer cells with different EGFR mutation states, we can differentiate them by analyzing mutation states of multiple areas. This method is quantitative, and the ratio between gefitinib‐sensitive cells (EGFR mutation positive) and nonsensitive cells (EGFR mutation negative, wild type) can be determined simply by counting the number of areas within a tumor of each genetic type. We analyzed 50–60 areas from each tissue. It should be noted that the sampling must not be contaminated with non‐cancerous cells: a pure population was achieved using laser‐capture microdissection to observe tissue sections. Because the amount of genomic DNA is extremely limited in our study, we chose SNaP shot, a primer extension assay. In SNaP shot, oligonucleotide primers were designed next to the mutated EGFR nucleotide. Using fluorescent dye‐labeled dideoxynucleotides, a single nucleotide was added by DNA polymerase, and the mutation status was determined.
First, we determined the optimal sample size to obtain unbiased PCR amplification by changing the areas excised by laser‐capture microdissection. We defined the size as approximately 100 × 100 × 35 µm, which enabled four assays and contained 30–60 cells. Then, we checked the quantitative ability of the PCR assay. Using genomic DNA from a small area and serially diluted cloned EGFR cDNA as a standard, we determined the amount of genomic DNA recovered from one small area.
We then checked the linearity of assay with various amounts of the cloned DNA. The calibration curve is shown in Fig. S1. There was good linearity between inoculated cDNA and the fluorescensce peak ratio, confirming the validity of our assay. The outline of the analysis is shown in Figure 1.
Figure 1.
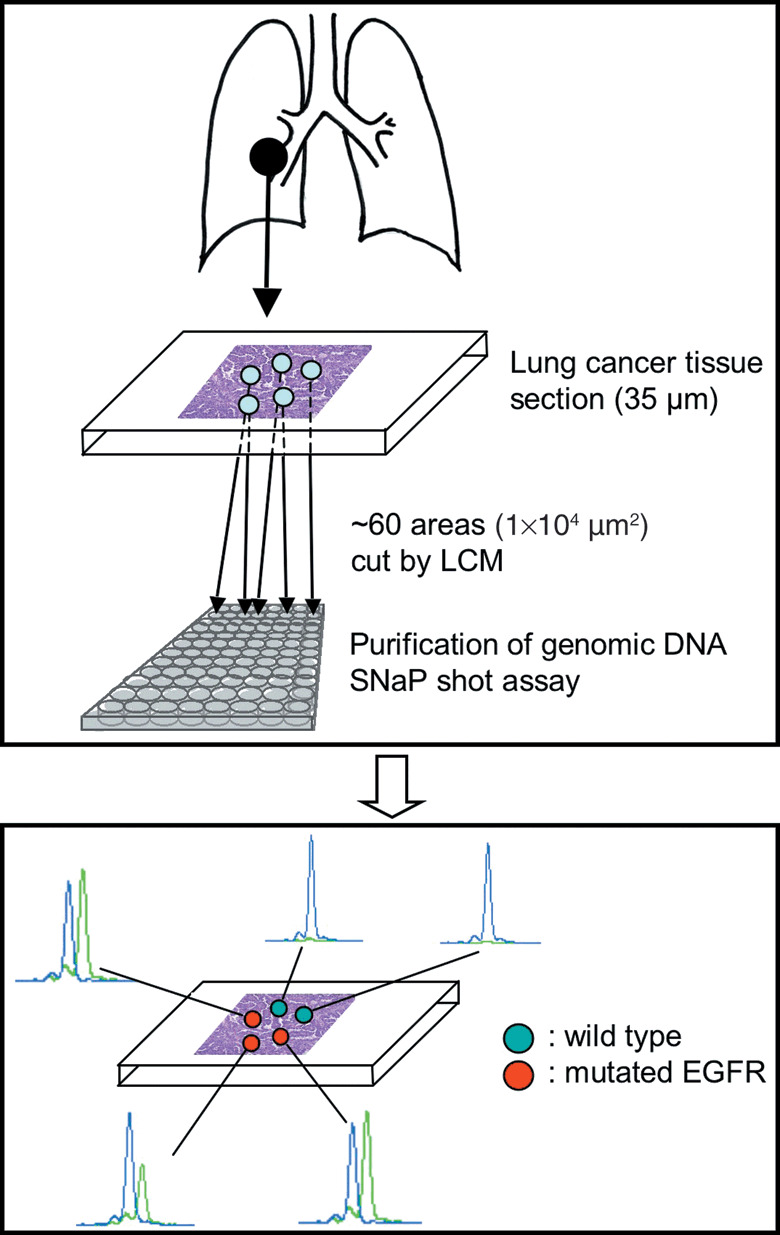
Outline of the analysis method. EGFR, epidermal growth factor receptor; LCM, laser capture microdissection.
Intratumor heterogeneity of EGFR mutations. As a preliminary experiment, we examined lung cancer tissues from several patients confirmed to carry EGFR mutations. In one cancer tissue, we found that some areas had wild‐type EGFR (no EGFR mutation). A typical example is shown in Figure 2.
Figure 2.
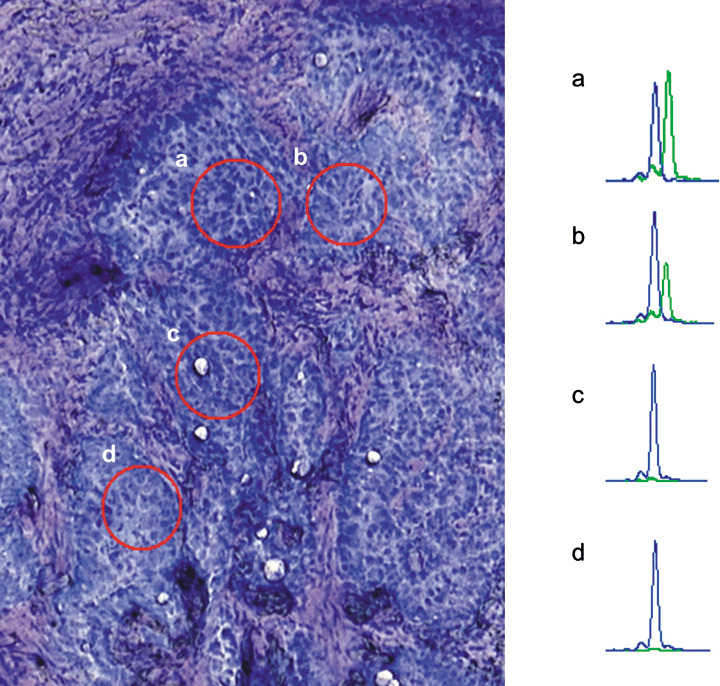
An example of the intratumor heterogeneity of the epidermal growth factor receptor mutation. The tissue is patient no. 17 in Table 1. (Left) A microscopic view of a lung tumor section. Red circles indicate regions excised by laser‐capture dissection. (Right) Electropherograms of the SNaP shot assay of the corresponding regions. Blue peak, amplified fragment with ddG; green peak, amplified fragment with ddA.
Using genomic DNA from two areas of this tumor, we observed two peaks representing the mutated and non‐mutated alleles. In contrast, sections from two other areas showed peaks derived only from the non‐mutated alleles. This tumor is therefore a heterogenous mixture of cancer cells with and without EGFR mutations.
It should be noted that all excised areas contained only cancer cells and were morphologically indistinguishable. To exclude the possibility that the heterogeneity was an experimental artifact, we carried out the assay with two SNP loci, JST003692 and JST004556, which were heterozygous, C and T, in patient no. 17. Because the two heterozygous alleles were quantitatively equivalent in all cells, deviation from the equal allele frequency should be due to experimental artifacts. We sampled 60 areas and analyzed them using the SNaP shot assay. There were no areas with 0 or 100% T allele. The mean and SD of the T allele was 51.3 and 12.9, respectively, for JST003692, and 53.4 and 11.0, respectively, for JST004556.
Calculating from these values, the chance for 0% T allele is 3.5 × 10⁻⁵ and 6.04 × 10⁻⁷, respectively. Therefore, we can exclude the possibility that the above heterogeneity (i.e. identification of wild‐type EGFR) was due to experimental artifacts. Additionally, to exclude the possible contamination of normal cells, we determined the mutation status of p53. The analysis of bulk tissue indicated that tissue from patient no. 17 contained only the mutated p53 allele. The spots with only wild‐type EGFR allele also contained only the mutation p53 allele (data not shown). These spots did not contain normal cells.
Correlation with response to gefitinib. We then investigated tissues from 21 patients. Table 1 is a summary of the clinical information for these patients. Cancer tissues were classified into two groups: those consisting only of EGFR‐mutated cells (15 cases, group I) and those with EGFR‐mutated and non‐mutated cells (six cases, group II). Eight tissues in group I had an equal proportion of mutated and non‐mutated EGFR (the median was <61%), suggesting that these cells were heterozygous for the mutated EGFR gene. Examples are shown in Figure 3a–c. Divergence of the ratio of EGFR‐mutated and non‐mutated alleles among tumor sections was partly due to that introduced during the assay. We excluded the existence of other reported mutations by sequencing the amplified products. In addition, with samples from patients 17, 19, and 20, we confirmed that the lack of mutated alleles was not due to chromosome copy number variation, using SNP markers to confirm that chromosome 7p was a heterozygote.
Table 1.
Summary of clinical information of patients
| Patient no. | Sex | Stage | Histology | Mutation | WT area (%) | Mutated allele (%) | Hetero‐ geneity group | EGFR amplification | Response | Period between surgery and first gefitinib (months) | Outcome |
|---|---|---|---|---|---|---|---|---|---|---|---|
| 1 | Male | III A | Ad | L858R | 0.00 | 47.9 | I | 0.9 | PR | 51 | Dead |
| 2 | Female | II B | Ad | L858R | 0.00 | 48.0 | I | 3.4 | PR | 82 | Alive |
| 3 | Male | II A | Ad | L858R | 0.00 | 50.4 | I | 2.8 | CR | 88 | Alive |
| 4 | Female | III B | Ad | L858R | 0.00 | 53.2 | I | 5.9 | CR | 7 | Dead |
| 5 | Female | III A | Ad | L858R | 0.00 | 53.9 | I | 3.0 | CR | 52 | Alive |
| 6 | Female | III A | Ad | delE746‐A750 | 0.00 | 58.6 | I | 1.4 | CR | 88 | Dead |
| 7 | Female | II B | Ad | delE746‐A750 | 0.00 | 58.7 | I | 3.0 | PR | 48 | Alive |
| 8 | Female | I A | Ad | delE746‐A750 | 0.00 | 61.5 | I | 2.7 | PR | 2 | Alive |
| 9 | Male | II B | Ad | L858R | 0.00 | 74.2 | I | 2.9 | PR | 38 | Dead |
| 10 | Female | I A | Ad | delE746‐A750 | 0.00 | 75.1 | I | 1.5 | PR | 18 | Alive |
| 11 | Female | I A | Ad | delE746‐A750 | 0.00 | 81.2 | I | 1.9 | PR | 17 | Alive (lost from follow up) |
| 12 | Female | I B | Ad | delE746‐A750 | 0.00 | 82.8 | I | 2.7 | PR | 37 | Alive |
| 13 | Female | I B | Ad | L861Q, G719S | 0.00 | 82.9 | I | 2.4 | PR | 35 | Alive |
| 14 | Female | III A | Ad | delL747‐T751 | 0.00 | 84.5 | I | 4.8 | PR | 11 | Alive (lost from follow up) |
| 15 | Female | I B | Ad | delE750‐K758 | 0.00 | 93.9 | I | 2.4 | PR | 31 | Alive |
| 16 | Female | II B | Ad | L858R | 74.07 | 24.1 | II | 2.6 | SD | 16 | Dead |
| 17 | Male | III A | Ad | delE746‐A750 | 6.67 | 48.3 | II | 3.3 | PR | 13 | Dead |
| 18 | Female | III A | Ad | delE746‐A750 | 11.54 | 49.8 | II | 3.8 | CR | 39 | Alive |
| 19 | Female | III B | Ad | E746‐T751 insIP | 8.77 | 54.3 | II | 2.9 | PR | 42 | Dead |
| 20 | Female | II B | Ad | delE746‐A750 | 8.62 | 58.1 | II | 2.3 | PR | 12 | Dead |
| 21 | Male | III B | AdSq | delA859‐L883 insV | 100.00 | NA | II | 1.5 | PD | 73 | Dead |
Mutated allele (%), ratios of the mutated allele of all areas was calculated, and their median value is shown.
WT area (%), fraction of areas consisting only of the non‐mutant allele. Ad, adenocarcinoma; AdSq, adenosquamous carcinoma; CR, complete response; EGFR, epidermal growth factor receptor; NA, not applicable; PD, progressive disease; PR, partial response; SD, stable disease.
Figure 3.
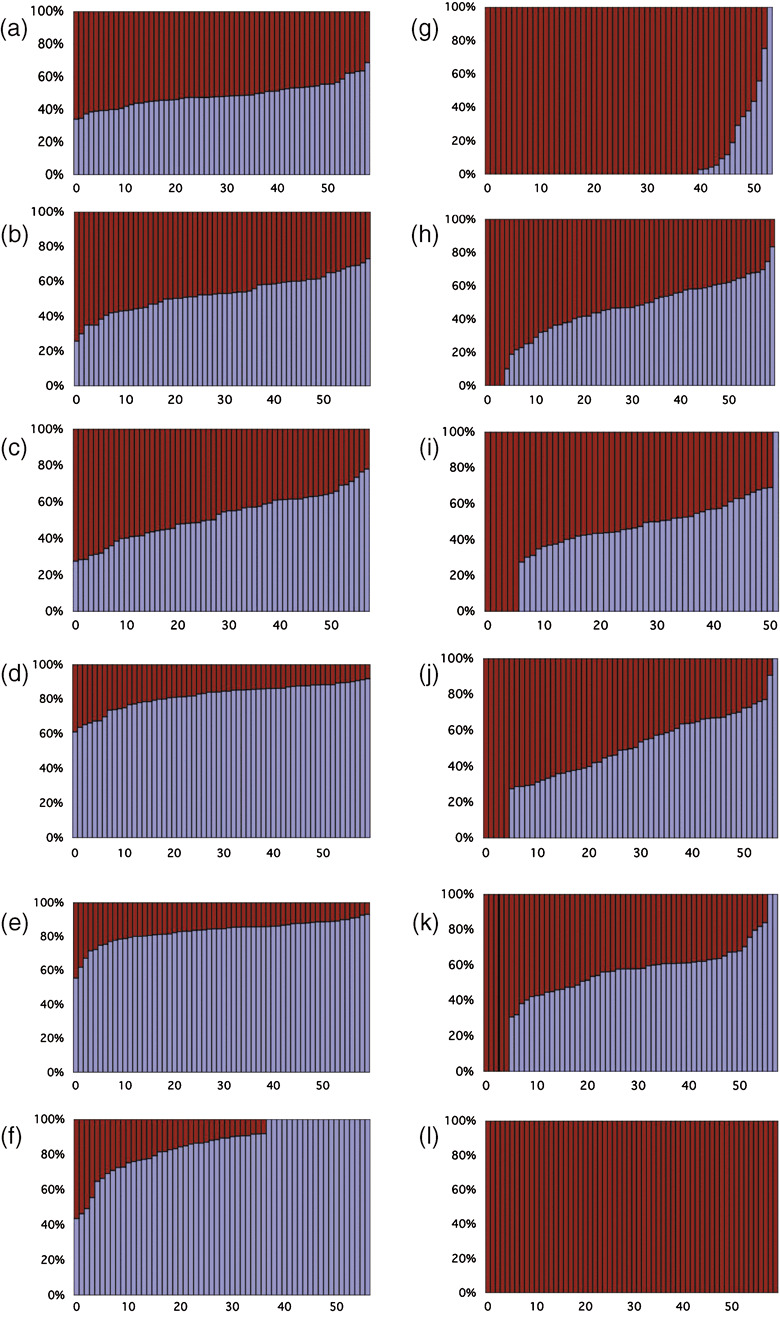
Intratumor heterogeneity of the epidermal growth factor receptor (EGFR) gene. Vertical axis indicates the percentage of the mutated EGFR gene. Horizontal axis areas ordered by the percentage of the mutated gene. Blue regions correspond to the mutated genes, and purple regions correspond to the non‐mutated genes. Columns only consisting of purple regions represent areas consisting of non‐mutated cells. Each panel corresponds to the following patients: (a) 1; (b) 4; (c) 5; (d) 13; (e) 14; (f) 15; (g) 16; (h) 17; (i) 18; (j) 19; (k) 20; and (l) 21.
The other seven tissues in group I also consisted of the mutated and non‐mutated genes, but the frequency of the mutated EGFR gene was higher than the non‐mutated gene. Examples are shown in Figure 3d–f. This increase in the mutant EGFR was due either to specific amplification of the mutated EGFR gene or to polyploidy (i.e. dominance of the chromosome carrying the mutated gene). The remaining six tissues consisted not only of EGFR‐mutated cells but also of non‐mutated cells (Fig. 3g–l). The proportion of the non‐mutated cells varied from 6.7 to 100%. Patient no. 21 did not contain any mutated cells: additionally we confirmed the SNaP shot results by DNA sequencing, that is, direct and sampled sequencing of 68 cDNA clones from the block used for the SNaP shot analysis. The discrepancy from the initial analysis was due to heterogeneity among the sample, because we used a different part of the tumor for the initial sequencing analysis.
We evaluated the effect of intratumor heterogeneity on the responsiveness to gefitinib therapy by measuring time to disease progression and overall survival. As shown in Figure 4, both time to progression (median of group I, 18 months; median of group II, 7.5 months; P = 0.009) and overall survival (median of group I, 27 months; median of group II, 16.5 months; P = 0.003) were significantly less in group II. There was no significant difference both in time to progression and overall survival after gefitinib treatment between patients heterozygous for the EGFR mutation (patients 1–8) and those with the dominant mutated EGFR allele (patient 9–15) (time to progression, P = 0.28; overall survival, P = 0.56) (Fig. S2). The number of cases with EGFR amplification was four in group I and two in group II (Table 1). Thus, the differences were not due to EGFR amplification.
Figure 4.
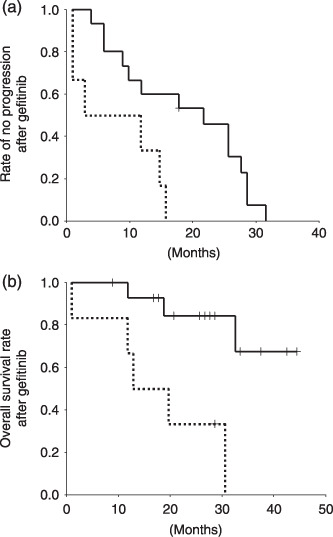
Kaplan–Meier analysis of group I (straight line) and II patients (dotted line). (a) Time to progression after gefitinib treatment. (b) Overall survival after gefitinib treatment. Vertical axis, fraction of patients with (a) no disease progression or (b) patient survival (b). Horizontal axis, time in months.
Discussion
Epidermal growth factor receptor TKI are potentially effective anticancer agents, but only a fraction of patients respond to EGFR TKI therapy. It is important to distinguish patients who are most likely to respond. In Japan, somatic mutations found in the EGFR tyrosine kinase domain are the best predictive factor of responsiveness to EGFR TKI, although there are contradictory studies in other nations.( 17 , 18 ) So far, EGFR mutation status has been viewed as homogeneous within a single tumor tissue. However, we found that 6 out of 21 mutation‐positive NSCLC consisted not only of mutated cells but also of non‐mutated cells. In addition, these patients did not respond well to gefitinib: both time to progression and overall survival after gefinitib treatment were significantly reduced compared to patients with only EGFR‐mutant tumor cells. Non‐mutated cells are likely to be unresponsive to gefitinib therapy and contribute to disease progression. Unfortunately, this hypothesis is not proven due to the unavailability of tissue after treatment. In particular, it is important to examine the fraction of non‐mutated cells in recurrent tumors. Another possibility is that mutation‐positive cells of this tissue type would not respond well to gefitinib.
Through the course of gefitinib therapy, patients that initially respond to gefitinib lose responsiveness. A second EGFR mutation at amino acid position 790 (T790M) was found in tumors that acquired resistance to gefitinib.( 19 , 20 ) It is interesting to compare the presence of T790M and EGFR heterogeneity with disease progression during gefitinib therapy. However, this direct comparison was difficult for the following reasons. First, we observed EGFR tumor heterogeneity before gefitinib therapy, whereas most of the T790M mutations were found in tissues after gefitinib therapy.( 19 , 20 , 21 ) The presence of the T790M mutation in NSCLC before therapy is very rare.( 22 ) Therefore, the T790M mutation is not informative for predicting gefitinib responsiveness. Second, the reported cases of NSCLC with the T790M mutation initially responded to gefitinib and then acquired resistance. Data for gefitinib non‐responders are limited.( 22 ) The patients with EGFR heterogeneity did not respond as well as other patients, and two out of six cases were categorized as non‐responders. EGFR heterogeneity is likely to correlate with the initial response to gefitinib rather than the frequency of acquired resistance. Additional studies with biopsy samples during and after gefitinib therapy will provide a clearer picture of the effects of both the T790M mutation and EGFR heterogeneity on gefitinib responsiveness.
The overall response rate of this study was 81% (17 out of 21), and similar to that in EGFR‐mutated patients reported in Japan. In general, time to progression is a better indicator of gefitinib efficacy than tumor response. In our case, due to the small sample size, the difference in the gefitinib effect was apparent with time to progression, and not with tumor response.
In the present study, the EGFR mutation status was obtained from primary tumors, but gefitinib therapy was used for patients who had relapsed or developed metastatic tumors. One may wonder whether the EGFR mutation status is the same both in primary and metastatic tumors. Although there is no data on EGFR to address this possibility, there are studies on Her2. Trastuzumab is an effective therapy for breast cancer patients that overexpress Her2, and patients are selected by a diagnostic test to detect Her2 expression levels. Her2 expression in primary and metastatic lesions of the same patients was examined, and the degree of 90–95% of cases was concordant in both lesions.( 23 , 24 ) Intratumor genetic heterogeneity has been considered as a potential cause of anticancer drug resistance. In addition, there have been preliminary studies to elucidate the heterogeneity.( 16 , 25 , 26 , 27 , 28 ) However, there have been no systematic studies to link tumor heterogeneity with drug resistance. We introduced a new technical framework, which is simple in principle but practically demanding. The main obstacles are the sampling step and numerous PCR reactions. These technical problems will be solved with the development of a specific sampling machine. Although there are other technical possibilities, our method of sectioning tumor tissue into small parts allows a variety of analytical techniques, including gene expression and epigenetic analysis.
We are now expecting a second generation of molecular target therapies.( 29 ) Selecting patients who are most likely to benefit is important, and intratumor heterogeneity will be an important factor for evaluating their efficacy.
Supporting information
Fig. S1. An example of a calibration curve between inoculated cDNA ratio and ratio of amplified fragments. Horizontal axis (normal epidermal growth factor receptor [EGFR] cDNA)/(L858R EGFR cDNA). Vertical axis (fragment with ROX‐labeled T)/(fragment with R110‐labeled G), adjusted by relative value of intrinsic fluorescence intensities of both dyes. (Method of construction of the calibration curves.) cDNA fragments derived from the normal and mutated (L858R) EGFR genes were cloned. To mimic the experimental conditions, cloned mutated cDNA was diluted to the amount of genomic DNA purified from a 2.5 × 10⁴‐µm2 tissue section, the amount used for a single assay. The amount of genomic DNA was estimated from the copy number of the aldolase gene measured by real‐time polymerase chain reaction (PCR). Mixtures (2 : 1, 1 : 1, 1 : 2) of normal and mutated cloned cDNA were subjected to PCR amplification and the SNaP shot assay. The calibration curve represents the average of 10 repeated experiments.
Fig. S2. Kaplan–Meier analysis of patients heterozygous for epidermal growth factor receptor (EGFR) mutation (patients 1–8, dotted line) and those with the dominant EGFR mutation allele (patients 9–15, straight line). (a) Time to disease progression after gefitinib treatment. (b) Overall survival after gefitinib treatment. Vertical axis, fraction of patients with no progression (a) or patient survival (b). Horizontal axis, time in months.
Table S1. Sequences of oligonucleotide primers used for polymerase chain reaction (PCR) amplification of the epidermal growth factor receptor (EGFR) exons. Only exon 19 was amplified with nested PCR. The internal primers are marked by ‘int’
Table S2. Sequences of oligonucleotide primers used for the SNaP shot assay
Please note: Blackwell Publishing are not responsible for the content or functionality of any supplementary materials supplied by the authors. Any queries (other than missing material) should be directed to the corresponding author for the article.
Supporting info item
Supporting info item
Supporting info item
Supporting info item
Acknowledgments
The authors thank Dr Kyoko Iwao‐Koizumi for advice on the experiments. This work was supported by the Knowledge Cluster Initiative (the Keihanna Science City area) of the Ministry of Education, Culture, Sports, Science, and Technology of Japan, and a research grant from AstraZeneca.
References
- 1. Lynch TJ, Adjei AA, Bunn PA Jr et al . Summary statement: novel agents in the treatment of lung cancer: advances in epidermal growth factor receptor‐targeted agents. Clin Cancer Res 2006; 12: 4365S–71S. [DOI] [PubMed] [Google Scholar]
- 2. Schlessinger J. Ligand‐induced, receptor‐mediated dimerization and activation of EGF receptor. Cell 2002; 110: 669–72. [DOI] [PubMed] [Google Scholar]
- 3. Fukuoka M, Yano S, Giaccone G et al . Multi‐institutional randomized phase II trial of gefitinib for previously treated patients with advanced non‐small‐cell lung cancer (The IDEAL 1 Trial) [corrected]. J Clin Oncol 2003; 21: 2237–46. [DOI] [PubMed] [Google Scholar]
- 4. Kris MG, Natale RB, Herbst RS et al . Efficacy of gefitinib, an inhibitor of the epidermal growth factor receptor tyrosine kinase, in symptomatic patients with nonsmall cell lung cancer: a randomized trial. JAMA 2003; 290: 2149–58. [DOI] [PubMed] [Google Scholar]
- 5. Miller VA, Kris MG, Shah N et al . Bronchioloalveolar pathologic subtype and smoking history predict sensitivity to gefitinib in advanced non‐small‐cell lung cancer. J Clin Oncol 2004; 22: 1103–9. [DOI] [PubMed] [Google Scholar]
- 6. Lynch TJ, Bell DW, Sordella R et al . Activating mutations in the epidermal growth factor receptor underlying responsiveness of non‐small‐cell lung cancer to gefitinib. N Engl J Med 2004; 350: 2129–39. [DOI] [PubMed] [Google Scholar]
- 7. Mitsudomi T, Kosaka T, Endoh H et al . Mutations of the epidermal growth factor receptor gene predict prolonged survival after gefitinib treatment in patients with non‐small‐cell lung cancer with postoperative recurrence. J Clin Oncol 2005; 23: 2513–20. [DOI] [PubMed] [Google Scholar]
- 8. Paez JG, Janne PA, Lee JC et al . EGFR mutations in lung cancer: correlation with clinical response to gefitinib therapy. Science 2004; 304: 1497–500. [DOI] [PubMed] [Google Scholar]
- 9. Pao W, Miller V, Zakowski M et al . EGF receptor gene mutations are common in lung cancers from ‘never smokers’ and are associated with sensitivity of tumors to gefitinib and erlotinib. Proc Natl Acad Sci USA 2004; 101: 13 306–11. [DOI] [PMC free article] [PubMed] [Google Scholar]
- 10. Takano T, Ohe Y, Sakamoto H et al . Epidermal growth factor receptor gene mutations and increased copy numbers predict gefitinib sensitivity in patients with recurrent non‐small‐cell lung cancer. J Clin Oncol 2005; 23: 6829–37. [DOI] [PubMed] [Google Scholar]
- 11. Eberhard DA, Johnson BE, Amler LC et al . Mutations in the epidermal growth factor receptor and in KRAS are predictive and prognostic indicators in patients with non‐small‐cell lung cancer treated with chemotherapy alone and in combination with erlotinib. J Clin Oncol 2005; 23: 5900–9. [DOI] [PubMed] [Google Scholar]
- 12. Herbst RS, Prager D, Hermann R et al . TRIBUTE: a phase III trial of erlotinib hydrochloride (OSI‐774) combined with carboplatin and paclitaxel chemotherapy in advanced non‐small‐cell lung cancer. J Clin Oncol 2005; 23: 5892–9. [DOI] [PubMed] [Google Scholar]
- 13. Kitano H. Cancer as a robust system: implications for anticancer therapy. Nature Rev 2004; 4: 227–35. [DOI] [PubMed] [Google Scholar]
- 14. Therasse P, Arbuck SG, Eisenhauer EA et al. New guidelines to evaluate the response to treatment in solid tumors. J Natl Cancer Inst 2000; 92: 205–16. [DOI] [PubMed] [Google Scholar]
- 15. Hirakawa M, Tanaka T, Hashimoto Y, Kuroda M, Takagi T, Nakamura Y. JSNP: a database of common gene variations in the Japanese population. Nucl Acids Res 2002; 30: 158–62. [DOI] [PMC free article] [PubMed] [Google Scholar]
- 16. Gonzalez‐Garcia I, Sole RV, Costa J. Metapopulation dynamics and spatial heterogeneity in cancer. Proc Natl Acad Sci USA 2002; 99: 13 085–9. [DOI] [PMC free article] [PubMed] [Google Scholar]
- 17. Cappuzzo F, Hirsch FR, Rossi E et al . Epidermal growth factor receptor gene and protein and gefitinib sensitivity in non‐small‐cell lung cancer. J Natl Cancer Inst 2005; 97: 643–55. [DOI] [PubMed] [Google Scholar]
- 18. Dziadziuszko R, Witta SE, Cappuzzo F et al . Epidermal growth factor receptor messenger RNA expression, gene dosage, and gefitinib sensitivity in nonsmall cell lung cancer. Clin Cancer Res 2006; 12: 3078–84. [DOI] [PubMed] [Google Scholar]
- 19. Kobayashi S, Boggon TJ, Dayaram T et al . EGFR mutation and resistance of non‐small‐cell lung cancer to gefitinib. N Engl J Med 2005; 352: 786–92. [DOI] [PubMed] [Google Scholar]
- 20. Pao W, Miller VA, Politi KA et al . Acquired resistance of lung adenocarcinomas to gefitinib or erlotinib is associated with a second mutation in the EGFR kinase domain. PLoS Med 2005; 2: e73. [DOI] [PMC free article] [PubMed] [Google Scholar]
- 21. Kosaka T, Yatabe Y, Endoh H et al . Analysis of epidermal growth factor receptor gene mutation in patients with non‐small cell lung cancer and acquired resistance to gefitinib. Clin Cancer Res 2006; 12: 5764–9. [DOI] [PubMed] [Google Scholar]
- 22. Inukai M, Toyooka S, Ito S et al . Presence of epidermal growth factor receptor gene T790M mutation as a minor clone in non‐small cell lung cancer. Cancer Res 2006; 66: 7854–8. [DOI] [PubMed] [Google Scholar]
- 23. Gancberg D, Di Leo A, Cardoso F et al . Comparison of HER‐2 status between primary breast cancer and corresponding distant metastatic sites. Ann Oncol 2002; 13: 1036–43. [DOI] [PubMed] [Google Scholar]
- 24. Simon R, Nocito A, Hubscher T et al . Patterns of her‐2/neu amplification and overexpression in primary and metastatic breast cancer. J Natl Cancer Inst 2001; 93: 1141–6. [DOI] [PubMed] [Google Scholar]
- 25. Baisse B, Bouzourene H, Saraga EP, Bosman FT, Benhattar J. Intratumor genetic heterogeneity in advanced human colorectal adenocarcinoma. Int J Cancer 2001; 93: 346–52. [DOI] [PubMed] [Google Scholar]
- 26. Barnetson R, Jass J, Tse R, Eckstein R, Robinson B, Schnitzler M. Mutations associated with microsatellite unstable colorectal carcinomas exhibit widespread intratumoral heterogeneity. Genes, Chromosomes Cancer 2000; 29: 130–6. [DOI] [PubMed] [Google Scholar]
- 27. Francis P, Fernebro J, Eden P et al . Intratumor versus intertumor heterogeneity in gene expression profiles of soft‐tissue sarcomas. Genes, Chromosomes Cancer 2005; 43: 302–8. [DOI] [PubMed] [Google Scholar]
- 28. Losi L, Baisse B, Bouzourene H, Benhattar J. Evolution of intratumoral genetic heterogeneity during colorectal cancer progression. Carcinogenesis 2005; 26: 916–22. [DOI] [PubMed] [Google Scholar]
- 29. McNeil C. Two targets, one drug for new EGFR inhibitors. J Natl Cancer Inst 2006; 98: 1102–3. [DOI] [PubMed] [Google Scholar]
Associated Data
This section collects any data citations, data availability statements, or supplementary materials included in this article.
Supplementary Materials
Fig. S1. An example of a calibration curve between inoculated cDNA ratio and ratio of amplified fragments. Horizontal axis (normal epidermal growth factor receptor [EGFR] cDNA)/(L858R EGFR cDNA). Vertical axis (fragment with ROX‐labeled T)/(fragment with R110‐labeled G), adjusted by relative value of intrinsic fluorescence intensities of both dyes. (Method of construction of the calibration curves.) cDNA fragments derived from the normal and mutated (L858R) EGFR genes were cloned. To mimic the experimental conditions, cloned mutated cDNA was diluted to the amount of genomic DNA purified from a 2.5 × 10⁴‐µm2 tissue section, the amount used for a single assay. The amount of genomic DNA was estimated from the copy number of the aldolase gene measured by real‐time polymerase chain reaction (PCR). Mixtures (2 : 1, 1 : 1, 1 : 2) of normal and mutated cloned cDNA were subjected to PCR amplification and the SNaP shot assay. The calibration curve represents the average of 10 repeated experiments.
Fig. S2. Kaplan–Meier analysis of patients heterozygous for epidermal growth factor receptor (EGFR) mutation (patients 1–8, dotted line) and those with the dominant EGFR mutation allele (patients 9–15, straight line). (a) Time to disease progression after gefitinib treatment. (b) Overall survival after gefitinib treatment. Vertical axis, fraction of patients with no progression (a) or patient survival (b). Horizontal axis, time in months.
Table S1. Sequences of oligonucleotide primers used for polymerase chain reaction (PCR) amplification of the epidermal growth factor receptor (EGFR) exons. Only exon 19 was amplified with nested PCR. The internal primers are marked by ‘int’
Table S2. Sequences of oligonucleotide primers used for the SNaP shot assay
Please note: Blackwell Publishing are not responsible for the content or functionality of any supplementary materials supplied by the authors. Any queries (other than missing material) should be directed to the corresponding author for the article.
Supporting info item
Supporting info item
Supporting info item
Supporting info item