

Abstract
SNF‐1/5′‐AMP‐activated kinase (AMPK)‐related kinase (SNARK) is a member of the AMPK‐related kinases. Snark+/– mice exhibited mature‐onset obesity and related metabolic disorders. Obesity is regarded as a risk factor for colorectal cancer. To investigate whether Snark deficiency is involved in tumorigenesis in the large intestine, obese Snark+/– mice were treated with a chemical carcinogen, azoxymethane (AOM). The incidences of both adenomas and aberrant crypt foci (ACF) were significantly higher in Snark+/– mice than in their wild‐type counterparts 28 weeks after the completion of AOM treatment (10 mg/kg/week for 8 weeks). Furthermore, ACF formation was enhanced in Snark+/– mice treated with AOM for 2 weeks, suggesting that Snark deficiency contributed to the early phase of tumorigenesis. The total number of ACF was correlated with bodyweight in Snark+/– and Snark+/+ mice, suggesting that obesity was a risk factor for colorectal tumorigenesis in this model. However, the correlation coefficient was higher in Snark+/– mice. Moreover, AOM‐induced ACF formation was also enhanced in preobese Snark+/– mice. Together, these findings suggest that AOM‐induced tumorigenesis in Snark+/– mice was enhanced via obesity‐dependent and ‐independent mechanisms. (Cancer Sci 2008; 99: 677–682)
Abbreviations:
- ACF
aberrant crypt foci
- AMPK
5′‐AMP‐activated kinase
- AOM
azoxymethane
- ES
embryonic stem
- PBS
phosphate‐buffered saline
- PCR
polymerase chain reaction
- RT
reverse transcription
- SNARK
SNF‐1/AMPK‐related kinase
AMP‐activated protein kinase is a conserved serine/threonine kinase that acts as a cellular energy sensor. Once cellular ATP is consumed, activated AMPK suppresses anabolic pathways to decrease energy expenditure and activates catabolic pathways to produce ATP.( 1 ) Furthermore, recent studies have implicated AMPK in the regulation of whole‐body metabolic homeostasis, including the regulation of food intake and energy expenditure.( 2 ) Based on the similarity of their kinase domains, 14 AMPK‐related kinases have been predicted in the human genome.( 3 , 4 ) SNARK (encoded by the NUAK2 locus) is the fourth identified AMPK‐related kinase.( 5 ) Although several in vitro studies have suggested that metabolic stresses as well as genotoxic or osmotic stresses induce SNARK activation, the physiological roles of SNARK remain uncertain.( 5 , 6 , 7 ) We established Snark‐deficient mice to clarify its in vivo function. Heterozygotic mice exhibited an increased bodyweight accompanied with fat deposition, fatty changes of the liver, and increased serum triglyceride concentration. These mice also exhibited hyperinsulinemia, hyperglycemia, and glucose intolerance. These symptoms are similar to those of human type II diabetes mellitus accompanied with obesity (K. Tsuchihara et al., manuscript in preparation, 2008).
Several epidemiological studies and rodent models have addressed the relationship between colorectal tumorigenesis and obesity or obesity‐related metabolic disorders.( 8 , 9 , 10 , 11 , 12 , 13 , 14 , 15 , 16 , 17 ) We suspected that the metabolic disorders in Snark‐deficient mice might be correlated with tumorigenesis. Furthermore, SNARK activity is reportedly upregulated under genotoxic stresses in some cell culture systems, suggesting the potential roles of SNARK in cellular stress responses.( 6 ) These findings prompted us to explore the involvement of Snark in colorectal tumor formation in Snark‐deficient and wild‐type mice treated with AOM, a chemical carcinogen that induces ACF, colorectal adenoma, and adenocarcinoma. We then assessed the chemically induced preneoplastic and neoplastic lesions in both obese and preobese Snark‐deficient mice.
Materials and Methods
Reverse transcription–polymerase chain reaction. Total RNA was extracted from tissues obtained from 3‐month‐old Snark+/– and Snark+/+ mice using TRIzol Reagent (Invitrogen, Carlsbad, CA, USA). RT was carried out using a High Capacity cDNA Reverse Transcription Kit (Applied Biosystems, Foster City, CA, USA). Quantitative PCR was carried out using TaqMan Gene Expression Assays and the 7500 Fast Real‐Time PCR System (Applied Biosystems). The relative abundance of transcripts was normalized to the constitutive expression of mouse Actb mRNA.
Generation of Snark‐deficient mice. To construct the targeting vector for the disruption of the Snark gene, a neomycin‐resistance gene driven by the herpes simplex virus (HSV) thymidine kinase promoter (tk‐Neo) was substituted for exon 1 of the mouse Nuak2 locus, which encodes the Snark gene. The diphteria toxin gene was inserted into the targeting vector for negative selection (Fig. 1b). J1 mouse ES cells from 129SVJ mice were electroporated with the linearized targeting vector and cultured in the presence of 300 µg/mL G418 for 14 days. G418‐resistant ES cells were screened for homologous recombination using PCR. Correctly targeted ES clones were verified using a Southern blot analysis. Information regarding the PCR primers and Southern blot probes is available on request. Two ES clones containing the Snark‐disrupted allele were obtained. One of the positive clones was injected into C57BL/6 J blastocysts to generate chimeric mice. After successful germline transmission, the F1 offspring were back‐crossed to C57BL/6 J mice for six generations. Offspring from the six‐generation heterozygous intercrosses were used for the experiments. Mouse embryonic fibroblasts derived from E13.5 embryos were prepared according to standard procedures. All of the mice were maintained in plastic cages with hardwood chip bedding in an airconditioned room with a 12:12 h L:D cycle and were given food (Oriental CRF‐1; Oriental Yeast, Tokyo, Japan), irradiated with 30 Gy gamma rays, and given filtered tap water ad libitum. The study was approved by the Institutional Ethics Review Committee for animal experiments at the National Cancer Center Hospital East.
Figure 1.
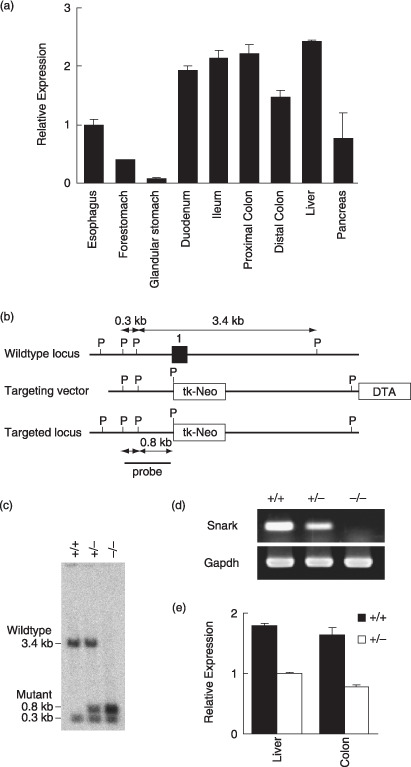
Snark expression in mouse gastrointestinal tract and the generation of Snark‐deficient mice. (a) Relative quantitative (RQ) reverse transcription–polymerase chain reaction (RT‐PCR) quantification of Snark transcripts normalized for Actb in adult C57BL/6 J mouse tissues of the digestive organs. The results are expressed as the mean value ± SD (n = 4) relative to the expression level in the esophagus. (b) Schematic representations of the wild‐type Snark locus, targeting vector, and targeted allele. Exon 1 is indicated by a filled box. The 5′ probe used for Southern hybridization is shown. P, PstI site. (c) Southern blot analysis of genomic DNA from Snark−/– , Snark+/– , and Snark+/+ mouse embryo fibroblasts (MEF) hybridized to the 5′ probe shown (b). (d) RT‐PCR analysis of total RNA from Snark−/– , Snark+/– , and Snark+/+ MEF. (e) RQ RT‐PCR analysis of total RNA from Snark+/– and Snark+/+ liver and large intestine. The results are expressed as the mean value ± SD (n = 3) relative to the expression level in the Snark+/– liver. DTA, diphteria toxin A chain; Gapdh, glyceraldehyde‐3‐phosphate dehydrogenase.
Azoxymethane treatment. AOM (Sigma‐Aldrich, St Louis, MO, USA) was dissolved in PBS at a concentration of 1 mg/mL. For the long‐term experiment, 6‐month‐old male Snark+/– and Snark+/+ mice were injected with 10 mg AOM per kg bodyweight intraperitoneally once a week for 8 weeks (eight administrations in total). The mice were then killed 28 weeks after the last AOM injection. For the short‐term experiment, 6‐month‐old or 4‐week‐old Snark−/– , Snark+/– , and Snark+/+ male mice were injected with 10 mg AOM per kg bodyweight intraperitoneally once a week for 2 or 4 weeks, respectively, and were then killed 1 week after the final AOM administration.
Aberrant crypt foci assay. Food was withheld from the mice for 16 h prior to dissection. The dissected colons were opened longitudinally, rinsed with PBS, and fixed in 4% neutral buffered formalin for 24 h. After fixation, the specimens were dipped in 0.2% methylene blue and examined using light microscopy. Formalin‐fixed and paraffin‐embedded sections of the macroscopic tumors were prepared using standard procedures and were examined after hematoxylin–eosin staining.
Immunohistochemistry. Tissue sections were deparaffinized and exposed to 3% hydrogen peroxide for 15 min to block endogenous peroxidase activity. For heat‐induced epitope retrieval, the sections were placed in a 0.01 M citrate buffer and heated at 95°C using a microwave for 20 min. The non‐specific binding was blocked by preincubation with 2% normal swine serum in PBS (blocking buffer) for 60 min at room temperature. Individual slides were then incubated overnight at 4°C with a monoclonal rat antimouse Ki‐67 antigen antibody (clone TEC‐3; Dako, Glostrup, Denmark) at a dilution of 1:50 in blocking buffer. The slides were washed with PBS, then incubated with Histofine Mousestain kit (Nichirei, Tokyo, Japan) for 45 min at room temperature. After extensive washing with PBS, the color reaction was developed in 2% 3,3′‐diaminobenzidine in 50 mM Tris‐buffer (pH 7.6) containing 0.3% hydrogen peroxide for 5–10 min. The sections were then counterstained with Meyer's hematoxylin, dehydrated, and mounted.
Assessment of metabolic parameters. Serum glucose, triglyceride, and free fatty acid levels were determined using the glucose CII‐test, triglyceride E‐test, and NEFA‐C‐test (Wako Pure Chemical Industries, Osaka, Japan), respectively.
Statistical analysis. Data were analyzed using the Mann–Whitney U‐test for statistical significance. P‐values were considered significant if less than 0.05. The correlation coefficient was measured using Spearman's rank correlation test. P‐values were considered significant if less than 0.05.
Results
Snark expression in mouse gastrointestinal tract and generation of Snark‐deficient mice. To examine the expression profile of Snark in the mouse gastrointestinal tract, quantitative RT‐PCR was carried out using total RNA from 3‐month‐old C57BL/6 mice. The expression level of Snark in the small and large intestines were comparable to that in the liver, in which Snark expression was confirmed in a previous study (Fig. 1a).( 5 )
To evaluate Snark function in vivo, we established Snark‐deficient mice (Fig. 1b,c). F1 heterozygous (Snark+/– ) mice with mixed background were backcrossed to the C57B6/J strain for six generations. Sixth‐generation Snark+/– mice were intercrossed to generate animals homozygous for the mutant Snark allele (Snark−/– ). RT‐PCR analysis of Snark−/– mouse embryo fibroblasts isolated on embryonic day 13.5 showed that Snark mRNA expression was completely abolished by the biallelic mutation at the Snark locus, whereas the hemiallelic mutation reduced Snark expression (Fig. 1d). The expression of Snark was reduced in the liver and large intestine of adult Snark+/– mice (Fig. 1e). The biallelic mutation of Snark was lethal after embroyonic day 16.5; Snark−/– embryos frequently exhibited excencephaly, and less than 10% of the Snark−/– mice were born. Meanwhile, Snark+/– mice were viable and were born at the expected Mendelian ratio (Table 1).
Table 1.
Embryonic lethality of Snark−/– mice
| Time | –/– | +/– | +/+ | |||
|---|---|---|---|---|---|---|
| n | % | n | % | n | % | |
| E12.5† | 2§ | 18¶ | 6§ | 55¶ | 3§ | 27¶ |
| E14.5† | 6§ | 25¶ | 13§ | 54¶ | 5§ | 21¶ |
| E16.5† | 12§ | 22¶ | 27§ | 48¶ | 17§ | 30¶ |
| P21‡ | 6§ | 2¶ | 191§ | 62¶ | 110§ | 36¶ |
Embryonic day at the time of genotyping of the embryos.
‡Post‐delivery day at the time of genotyping of the pups.
§Number of the embryos or pups with each genotype.
¶Percentage of the embryos or pups with each genotype.
Presence of metabolic disorders in AOM‐treated mature Snark+/– mice. To evaluate the relevance of Snark deficiency in colorectal tumorigenesis, mature (6 months old) Snark+/– and Snark+/+ mice were treated with 10 mg per kg bodyweight AOM intraperitoneally for 8 weeks and killed 28 weeks thereafter. The total dose of AOM was 2.80 ± 0.25 mg for the Snark+/– mice and 2.58 ± 0.17 mg for the Snark+/+ mice. The bodyweights of the Snark+/– mice were higher than those of the Snark+/+ mice at the start of the experiment, and this difference became more pronounced at the end of the experiment (Table 2). The AOM‐treated mice did not show any unusual signs during the experimental period with the exception of two Snark+/– mice that exhibited bodyweight loss and rough fur during the last 2 weeks of the experimental period. In these mice, huge tumors occupied and obstructed their colons. The bodyweight loss and the rough fur might have been caused by malnutrition as a result of the intestinal obstruction.
Table 2.
Bodyweight, serum parameters, and colorectal lesions induced by long‐term azoxymethane (AOM) treatment in Snark+/+ and Snark+/– mice
| Genotype | +/+ | +/– |
|---|---|---|
| Number of animals | 12 | 12 |
| Age (months)† | 6 | 6 |
| Age (months)‡ | 13 | 13 |
| AOM administration (weeks) | 8 | 8 |
| Mean total dose of AOM (mg) | 2.58 ± 0.17 | 2.80 ± 0.25 |
| Bodyweight (g)† | 31.33 ± 1.40 | 34.08 ± 1.63§§ |
| Bodyweight (g)‡ | 34.07 ± 1.80 | 37.67 ± 1.80‡‡ |
| Blood glucose (mg/dL)‡ | 106.03 ± 9.46 | 134.38 ± 17.90‡‡ |
| Serum triglyceride (mg/dL)‡ | 44.80 ± 8.17 | 61.07 ± 14.02§§ |
| Serum free fatty acid (mEq/L)‡ | 0.76 ± 0.12 | 0.58 ± 0.06§§ |
| Incidence of adenoma§ | 3/12 | 6/12 |
| Mean number of tumors/ tumor bearing mice | 1.00 ± 0 | 2.00 ± 0.58§§ |
| Mean size of adenoma (mm) | 5.66 ± 1.22 | 4.65 ± 0.55 |
| Ki‐67 positivity in adenomatous epithelia (%) | 28.66 ± 7.02 | 25.61 ± 5.77 |
| Ki‐67 positivity in non‐ tumorous epithelia (%) | 10.04 ± 2.57 | 10.65 ± 2.60 |
| Incidence of aberrant crypt foci¶ | 12/12 | 12/12 |
| Mean number of foci/colon | 6.92 ± 1.09 | 19.42 ± 1.76†† |
| Mean number of aberrant crypts/focus | 1.92 ± 0.20 | 2.37 ± 0.21†† |
Values at the time of AOM administration.
‡Values at the time of dissection.
§Number of mice with adenoma/total mice.
¶Number of mice with aberrant crypt foci/total mice.
††,
‡‡,
Significantly different from the corresponding values in Snark+/+ mice at levels of P < 0.01, P < 0.02, and P < 0.05, respectively.
The metabolic parameters of the AOM‐treated mice (including the two mice with emaciation) were examined. The serum glucose and triglyceride concentration were higher in the Snark+/– mice, whereas the free fatty acid concentration was lower compared with the levels in the Snark+/+ mice (Table 2).
Susceptibility of mature Snark+/– mice to AOM‐induced tumorigenesis. Six of the 12 Snark+/– mice (including the two mice with emaciation) and 3 out of 12 Snark+/+ mice harbored macroscopic tumors in their large intestines (Table 2). No spontaneous colorectal tumors were detected in age‐matched or older untreated mice of either genotypes to date (10 Snark+/– mice and eight Snark+/+ mice, data not shown). Although the individual tumor sizes were similar in the Snark+/– and Snark+/+ mice, the frequency of multiple tumors was higher in the Snark+/– mice: five out of six tumor‐harboring Snark+/– mice had multiple (two to four) tumors, whereas all three Snark+/+ mice had single tumors (Table 2). All of the tumors that developed in the Snark+/– and Snark+/+ mice appeared to be exophytic rounded or flattened polyps projecting into the intestinal lumen. Pathologically, these tumors were composed of tubules formed by enterocytes with moderate cytological atypia and had not invaded the submucosal layer (Fig. 2a). These tumors were diagnosed as tubular adenomas.( 18 ) Adenocarcinoma was not detected in any of the examined specimens. No obvious tumors were seen in any other organs, including the liver and lungs. Cell proliferation in non‐tumorous and adenomatous epithelia was estimated using Ki‐67 staining. No significant differences were observed between the Snark+/– and Snark+/+ mice (Table 2).
Figure 2.

Representative neoplastic and preneoplastic colorectal lesions induced by azoxymethane in Snark+/– mice. (a) Macroscopic and microscopic views of a tubular adenoma that developed in a Snark+/– mouse. The microscopic views were acquired using hematoxylin–eosin staining. Original magnification: left bottom, ×4; right, ×100. (b) Representative features of aberrant crypt foci (ACF). ACF were detected using methylene blue staining. The arrowheads indicate the luminal openings of the crypts. Original magnification: ×40.
Susceptibility of mature Snark+/– mice to AOM‐induced ACF formation. At least one ACF was detected in all of the mice of both genotypes (2, 3; Table 2). The mean number of ACF per total colon (from the anal verge to the ileocecal junction) was 6.92 ± 1.09 in the Snark+/+ mice, whereas that in the Snark+/– mice was approximately three times higher (19.42 ± 1.76). The mean numbers of aberrant crypts per focus were 2.37 ± 0.21 in the Snark+/– mice and 1.92 ± 0.20 in the Snark+/+ mice (Table 2). Figure 3a shows the distribution of ACF with multiple crypts for each genotype. The percentages of ACF with more than three crypts were 39.09 ± 8.31% in the Snark+/– mice and 25.05 ± 7.66% in the Snark+/+ mice (P = 0.025), whereas the percentages of ACF with more than four crypts were 19.97 ± 6.40% in the Snark+/– mice and 8.87 ± 5.77% in the Snark+/+ mice (P = 0.022). Six‐month‐old Snark+/– and Snark+/+ mice were treated with AOM for 2 weeks and the animals’ colons were examined for ACF 3 weeks after the first AOM administration. Three of the five Snark+/+ mice did not have any ACF, whereas at least four ACF were found in five out of five Snark+/– mice. The mean number of ACF per ACF‐bearing colon was 6.60 ± 1.69 in Snark+/– mice and 2.00 ± 1.00 Snark+/+ mice (Table 3).
Figure 3.

Distribution of aberrant crypt focus (ACF) size, and correlation between ACF and obesity in Snark+/– and Snark+/+ mice. (a) Total number and size distribution of ACF in each mouse. (b) Correlation between ACF numbers and bodyweight or metabolic parameters. Significant correlations between bodyweight and ACF number were observed in both Snark+/– and Snark+/+ mice.
Table 3.
Age, bodyweight, and aberrant crypt foci (ACF) induced by short‐term azoxymethane (AOM) treatment in Snark+/+ , Snark+/– , and Snark−/– mice
| Genotype | +/+ | +/– | +/+ | +/– | –/– |
|---|---|---|---|---|---|
| Number of animals | 5 | 5 | 5 | 6 | 5 |
| Age (months)† | 6 | 6 | 2 | 2 | 2 |
| AOM administration (weeks) | 2 | 2 | 4 | 4 | 4 |
| Bodyweight (g)† | 34.49 ± 1.22 | 39.72 ± 1.65§ | 29.51 ± 0.45 | 28.79 ± 0.80 | 26.90 ± 1.09 |
| Incidence of ACF‡ | 2/5 | 5/5 | 4/5 | 6/6 | 5/5 |
| Number of foci/colon | 2.00 ± 1.00 | 6.60 ± 1.69§ | 0.80 ± 0.20 | 1.50 ± 0.20¶ | 4.00 ± 1.26§ |
| Mean number of aberrant crypts/focus | 1.00 ± 0 | 1.00 ± 0 | 1.20 ± 0.37 | 1.00 ± 0 | 1.22 ± 0.15 |
Values at the time of dissection.
‡Number of mice with aberrant crypt foci/total mice.
Significantly different from the corresponding values in Snark+/+ mice at levels of P < 0.01 and P < 0.05, respectively.
Correlation of ACF incidence with bodyweight in AOM‐treated mice. A significant correlation between bodyweight and the number of ACF was observed in the Snark+/– mice (ρ = 0.677, P = 0.0248). Although the correlation coefficient and significance were less than those for Snark+/– mice, the Snark+/+ mice also exhibited a correlation between bodyweight and the number of ACF (ρ = 0.558, P = 0.0444). No significant correlations between the number of ACF and the serum glucose, triglyceride, or free fatty acid concentrations were observed.
Obesity‐independent contribution of Snark deficiency to ACF formation. To evaluate the obesity‐independent contribution of Snark deficiency to ACF formation, preobese 4‐week‐old Snark−/– , Snark+/– , and Snark+/+ mice were treated with AOM for 4 weeks (Table 3). At the end of the AOM treatment, no significant differences in bodyweight were seen among the three genotypes. The incidences of ACF were five out of five, six out of six, and four out of five in the Snark−/– , Snark+/– , and Snark+/+ mice, respectively. Furthermore, the number of ACF was higher in the Snark+/– mice (1.50 ± 0.20) than in the Snark+/+ mice (0.80 ± 0.20), and the number was much higher in the Snark−/– mice (4.00 ± 1.26).
Discussion
To clarify the physiological roles of SNARK, we established Snark‐deficient mice. Snark+/– mice developed normally and did not exhibit any obvious abnormalities. No significant differences in bodyweight were observed between Snark+/– and Snark+/+ mice at the time of weaning. However, Snark+/– mice fed ordinary mouse chow exhibited mature‐onset obesity at 4 months of age and thereafter. Although the food intake was not increased, oxygen consumption was decreased in the Snark+/– mice (K. Tsuchihara et al., manuscript in preparation, 2008). Thus, we assume that lower energy consumption caused the obesity of Snark+/– mice. Mature Snark+/– mice exhibited significant fat deposition accompanied with metabolic disorders, like glucose intolerance and increased serum triglyceride level. Interestingly, the serum free fatty acid concentration was significantly reduced in Snark+/– mice. Together, these findings suggest that fat synthesis and deposition were enhanced. Meanwhile, fat utilization was impaired in Snark+/– mice (K. Tsuchihara et al., manuscript in preparation, 2008). AOM‐treated mice showed similar findings to those observed in AOM‐untreated mice (Table 2), suggesting that AOM treatment did not affect the impairment of metabolic regulation that is characteristic of Snark+/– mice.
Aberrant crypt foci are regarded as preneoplastic lesions in rodent models and humans.( 19 , 20 , 21 , 22 , 23 , 24 , 25 ) Although the C57BL/6 strain is known to be resistant to the induction of colon tumors by AOM,( 26 ) at least one ACF was detected in all of the mice in the long‐term experiment (Table 2). The high AOM dose and the relatively long experimental period might have contributed to the increased susceptibility to ACF formation seen in wild‐type mice. However, the number of ACF was significantly higher in the Snark+/– mice compared with the Snark+/+ mice. The multiplicity of each ACF was also different. Moreover, the incidence of tumorigenesis was significantly higher in the Snark+/– mice (Table 2). These results strongly suggest that the hemiallelic loss of Snark contributed to an increase in the frequency of carcinogen‐induced neoplastic and preneoplastic lesions. As no spontaneous tumors were detected in age‐matched or older untreated mice, the colorectal tumorigenesis observed in this experiment might have depended on the AOM treatment. The short‐term experiment revealed that the loss of Snark expression affected the incidence of AOM‐induced carcinogenesis initiation (Table 3). The profile of the proliferating cell population was not different between the Snark+/– and Snark+/+ mice (Table 2). It also suggests that the Snark deficiency participated in tumor formation but not in cell proliferation in vivo.
A significant correlation between the number of ACF and bodyweight was observed in both Snark+/– and Snark+/+ mice. The dosage of AOM in the Snark+/– mice was 10% higher than that of the Snark+/+ mice due to the bodyweight gain. According to the previous report, this difference is negligible on ACF formation.( 27 ) These results suggest the obesity‐dependent contribution of Snark deficiency to the susceptibility to carcinogen‐induced preneoplastic lesions (Fig. 3b).
Meanwhile, plots of bodyweight versus ACF number showed that the ranges of ACF numbers were clearly different between Snark+/– and Snark+/+ mice. The number of ACF was larger in the Snark+/– mice than in the Snark+/+ mice when mice with similar bodyweights were compared, suggesting that Snark deficiency may contribute to ACF formation in a manner that is independent of obesity. To clarify this issue, preobese 4‐week‐old Snark+/– , Snark+/+ , and surviving Snark−/– mice were treated with AOM. An increased number of ACF in Snark‐deficient mice may support an obesity‐independent function of Snark in the suppression of tumor formation.
The precise mechanisms responsible for the suppression of ACF formation by Snark remain to be elucidated. We plan to investigate the direct effect of Snark on the maintenance of genome integrity and the regulation of cell proliferation. How and which metabolic disorders are responsible for enhancing tumor susceptibility may also be an interesting line of study. We expect that Snark‐deficient mice may be useful as a new rodent model for investigating the relationships between tumorigenesis and metabolic disorders.
Acknowledgments
This work was supported by the Japanese Ministry of Health, Labour, and Welfare for the Third‐Term Comprehensive 10‐Year Strategy for Cancer Control, and Grants‐in‐Aid for Cancer Research from the Japanese Ministry of Health, Labour, and Welfare and the Ministry of Education, Science, Sports, and Culture.
References
- 1. Hardie DG, Hawley SA, Scott JW. AMP‐activated protein kinase – development of the energy sensor concept. J Physiol 2006; 574: 7–15. [DOI] [PMC free article] [PubMed] [Google Scholar]
- 2. Kahn BB, Alquier T, Carling D, Hardie DG. AMP‐activated protein kinase: ancient energy gauge provides clues to modern understanding of metabolism. Cell Metab 2005; 1: 15–25. [DOI] [PubMed] [Google Scholar]
- 3. Lizcano JM, Goransson O, Toth R et al . LKB1 is a master kinase that activates 13 kinases of the AMPK subfamily, including MARK/PAR‐1. EMBO J 2004; 23: 833–43. [DOI] [PMC free article] [PubMed] [Google Scholar]
- 4. Manning G, Whyte DB, Martinez R, Hunter T, Sudarsanam S. The protein kinase complement of the human genome. Science 2002; 298: 1912–34. [DOI] [PubMed] [Google Scholar]
- 5. Lefebvre DL, Bai Y, Shahmolky N et al . Identification and characterization of a novel sucrose‐non‐fermenting protein kinase/AMP‐activated protein kinase‐related protein kinase, SNARK. Biochem J 2001; 355: 297–305. [DOI] [PMC free article] [PubMed] [Google Scholar]
- 6. Lefebvre DL, Rosen CF. Regulation of SNARK activity in response to cellular stresses. Biochim Biophys Acta 2005; 1724: 71–85. [DOI] [PubMed] [Google Scholar]
- 7. Suzuki A, Kusakai G, Kishimoto A, Minegichi Y, Ogura T, Esumi H. Induction of cell–cell detachment during glucose starvation through F‐actin conversion by SNARK, the fourth member of the AMP‐activated protein kinase catalytic subunit family. Biochem Biophys Res Commun 2003; 311: 156–61. [DOI] [PubMed] [Google Scholar]
- 8. Cobb S, Wood T, Tessarollo L et al . Deletion of functional gastrin gene markedly increases colon carcinogenesis in response to azoxymethane in mice. Gastroenterology 2002; 123: 516–30. [DOI] [PubMed] [Google Scholar]
- 9. Cowey S, Hardy RW. The metabolic syndrome: A high‐risk state for cancer? Am J Pathol 2006; 169: 1505–22. [DOI] [PMC free article] [PubMed] [Google Scholar]
- 10. Cowey SL, Quast M, Belalcazar LM et al . Abdominal obesity, insulin resistance, and colon carcinogenesis are increased in mutant mice lacking gastrin gene expression. Cancer 2005; 103: 2643–53. [DOI] [PubMed] [Google Scholar]
- 11. Frezza EE, Wachtel MS, Chiriva‐Internati M. Influence of obesity on the risk of developing colon cancer. Gut 2006; 55: 285–91. [DOI] [PMC free article] [PubMed] [Google Scholar]
- 12. Hirose Y, Hata K, Kuno T et al . Enhancement of development of azoxymethane‐induced colonic premalignant lesions in C57BL/KsJ‐db/db mice. Carcinogenesis 2004; 25: 821–5. [DOI] [PubMed] [Google Scholar]
- 13. Niho N, Mutoh M, Komiya M, Ohta T, Sugimura T, Wakabayashi K. Improvement of hyperlipidemia by indomethacin in Min mice. Int J Cancer 2007; 121: 1665–9. [DOI] [PubMed] [Google Scholar]
- 14. Niho N, Mutoh M, Takahashi M, Tsutsumi K, Sugimura T, Wakabayashi K. Concurrent suppression of hyperlipidemia and intestinal polyp formation by NO‐1886, increasing lipoprotein lipase activity in Min mice. Proc Natl Acad Sci USA 2005; 102: 2970–4. [DOI] [PMC free article] [PubMed] [Google Scholar]
- 15. Niho N, Takahashi M, Kitamura T et al . Concomitant suppression of hyperlipidemia and intestinal polyp formation in Apc‐deficient mice by peroxisome proliferator‐activated receptor ligands. Cancer Res 2003; 63: 6090–5. [PubMed] [Google Scholar]
- 16. Niho N, Takahashi M, Shoji Y et al . Dose‐dependent suppression of hyperlipidemia and intestinal polyp formation in Min mice by pioglitazone, a PPARγ ligand. Cancer Sci 2003; 94: 960–4. [DOI] [PMC free article] [PubMed] [Google Scholar]
- 17. Weber RV, Stein DE, Scholes J, Kral JG. Obesity potentiates AOM‐induced colon cancer. Dig Dis Sci 2000; 45: 890–5. [DOI] [PubMed] [Google Scholar]
- 18. Krutovskikh VA, Turusov VS. Tumours of the intestines. In: Turusov VS, Mohr U, eds. Pathology of Tumours in Laboratory Animals, 2nd edn. Lyon: International Agency for Research on Cancer, 1994; 195–211. [Google Scholar]
- 19. Bird RP. Role of aberrant crypt foci in understanding the pathogenesis of colon cancer. Cancer Lett 1995; 93: 55–71. [DOI] [PubMed] [Google Scholar]
- 20. Hata K, Yamada Y, Kuno T et al . Tumor formation is correlated with expression of β‐catenin‐accumulated crypts in azoxymethane‐induced colon carcinogenesis in mice. Cancer Sci 2004; 95: 316–20. [DOI] [PMC free article] [PubMed] [Google Scholar]
- 21. Hurlstone DP, Cross SS. Role of aberrant crypt foci detected using high‐magnification‐chromoscopic colonoscopy in human colorectal carcinogenesis. J Gastroenterol Hepatol 2005; 20: 173–81. [DOI] [PubMed] [Google Scholar]
- 22. Nambiar PR, Nakanishi M, Gupta R et al . Genetic signatures of high‐ and low‐risk aberrant crypt foci in a mouse model of sporadic colon cancer. Cancer Res 2004; 64: 6394–401. [DOI] [PubMed] [Google Scholar]
- 23. Pretlow TP, Pretlow TG. Mutant KRAS in aberrant crypt foci (ACF): initiation of colorectal cancer? Biochim Biophys Acta 2005; 1756: 83–96. [DOI] [PubMed] [Google Scholar]
- 24. Takahashi M, Minamoto T, Yamashita N, Kato T, Yazawa K, Esumi H. Effect of docosahexaenoic acid on azoxymethane‐induced colon carcinogenesis in rats. Cancer Lett 1994; 83: 177–84. [DOI] [PubMed] [Google Scholar]
- 25. Yamashita N, Minamoto T, Onda M, Esumi H. Increased cell proliferation of azoxymethane‐induced aberrant crypt foci of rat colon. Jpn J Cancer Res 1994; 85: 692–8. [DOI] [PMC free article] [PubMed] [Google Scholar]
- 26. Suzuki R, Kohno H, Sugie S, Nakagama H, Tanaka T. Strain differences in the susceptibility to azoxymethane and dextran sodium sulfate‐induced colon carcinogenesis in mice. Carcinogenesis 2006; 27: 162–9. [DOI] [PubMed] [Google Scholar]
- 27. McLellan EA, Bird RP. Aberrant crypts: potential preneoplastic lesions in the murine colon. Cancer Res 1988; 48: 6187–92. [PubMed] [Google Scholar]