

Abstract
Natural killer cells are an important component of innate resistance to viruses, bacteria, certain parasites, and tumors. The activating receptor natural killer group 2D (NKG2D) plays a critical role in the elimination of tumor cells by cytotoxic effector cells. It has been shown that the strength of an antitumor immune response might be critically dependent on NKG2D ligard surface levels. Thus, it is essential to regulate the expression of NKG2D ligands in order to ensure effective tumor immunosurveillance and the elimination of pathogen‐infected cells. In the present study, we found that interferon (IFN)‐α and IFNγ exert opposing effects on major histocompatibility complex class I‐related chain A (MICA) expression in human tumor cells. IFNα promotes expression of the NKG2D ligand MICA in tumor cells and therefore enhances their sensitivity to natural killer lysis. In contrast, IFNγ exerts the opposite effect. IFNα promotes MICA expression at the level of transcription by augmenting MICA promoter activity. IFNγ modulates MICA expression not only at the transcriptional level, but also at the post‐translational level by promoting proteolytic cleavage by matrix metalloproteinases. Further study is needed to clarify the precise regulatory mechanisms. The pathways involved in NKG2D ligand induction might represent a promising target for improving immune responses to cancer or infections. (Cancer Sci 2008; 99: 1279–1286)
Abbreviations:
- CTL
cytotoxic T lymphocyte
- ELISA
enzyme‐linked immunosorbent assay
- FITC
fluorescein isothiocyanate
- HLA
human leukocyte antigen
- IFN
interferon
- mAb
monoclonal antibody
- MHC
major histocompatibility complex
- MIC
major histocompatibility complex class I‐related chain
- MMP
matrix metalloproteinase
- MT‐MMP
membrane‐type matrix metalloproteinase
- NK
natural killer
- NKG2D
natural killer group 2D
- NKG2A
natural killer group 2A
- PBS
phosphate‐buffered saline
- PCR
polymerase chain reaction
- sMICA
soluble major histocompatibility complex class I‐related chain A
- TIMP
tissue inhibitor of matrix metalloproteinase
- ULBP
UL16‐binding protein
Natural killer cells are an important component of innate resistance to viruses, bacteria, certain parasites, and tumors. They are characterized by a strong cytolytic activity against tumor or virus‐infected cells as well as by the ability to release cytokines and chemokines that exert regulatory effects on the adaptive immune responses. NK cell activity is regulated tightly by signals from an array of cell‐surface inhibitory and activating receptors.( 1 , 2 , 3 ) The NKG2D receptor is a key activating receptor on NK cells.( 4 , 5 ) Triggering of NKG2D can induce cytotoxic lysis of the stressed target cells expressing ligands for NKG2D, despite the expression of normal levels of MHC class I molecules. NKG2D receptor is also expressed on CD8+αβT, γδT cells, and macrophages. It serves as a primary activation receptor in NK cells and macrophages and thus stimulation via NKG2D is sufficient to activate these cells. It also acts as a costimulatory receptor in CD8+ T cells and γδT cells, requiring T cell receptor‐mediated signaling for full activation of these effector cells. Therefore, NKG2D plays a critical role in the elimination of tumor cells by cytotoxic effector cells. The ligands of NKG2D are MICA, MICB, and the ULBP family in humans and Rae1, H60, and Mult1 in mice. They are minimally expressed on normal tissues but are upregulated on the surface of stressed cells under conditions of infection and tumorigenesis.( 4 , 5 , 6 ) MICA and MICB are stress‐induced class I‐like molecules with three extracellular domains that neither associate with β2 microglobulin nor bind peptides. ULBP proteins only have MHC class I structure with α1 and α2 domains and use glycosylphosphatidyl inositol anchors for cell surface expression.
Owing to the importance of NKG2D signaling in the activation of NK cells and costimulation of T cells, it has been shown that the strength of an antitumor immune response might be critically dependent on NKG2DL surface levels.( 5 , 6 , 7 ) Thus, it is essential to regulate the expression of NKG2D ligands in order to ensure effective tumor immunosurveillance and elimination of pathogen‐infected cells. However, relatively little is known about the regulatory factors and molecular mechanisms that trigger NKG2D ligand gene expression. In our research, we have found that IFNα and IFNγ exert opposing effects on the expression of NK cell receptors in NK cells. IFNα can upregulate the expression of activating receptor NKG2D and inhibit the expression of inhibitory receptors NKG2A and KIR2DL1, whereas IFNγ promotes NKG2A expression but downregulates NKG2D expression.( 8 , 9 ) In the present study, we found that these two types of IFN also have differential effects on tumor cells. IFNα promotes expression of the NKG2D ligand MICA in tumor cells and therefore enhances their sensitivity to NK lysis. However, IFNγ exerts the opposite effect.
Materials and Methods
Cell lines, stimulation and antibodies. The human cervical carcinoma cell lines Hela and Caski, human erythroleukemia K562 cells, and the human Burkitt's lymphoma cell line Raji were preserved in our laboratory. All cells were cultured at 37°C with 5% CO2 in RPMI‐1640 supplemented with 10% heat‐inactivated fetal bovine serum. Recombinant human IFNα was obtained from Changchun Changsheng Gene Pharmaceutical (Changchun, China). Recombinant human IFNγ was purchased from Shanghai Clone Biotechnological Pharmaceutical (Shanghai, China). Goat antihuman MICA mAb, mouse antihuman MICB mAb, mouse antihuman ULBP3 mAb, and neutralizing mouse antibodies against human NKG2D and human IFNγ mAb were purchased from R & D Systems (Minneapolis, MN, USA). Mouse antihuman HLA‐ABC monoclonal antibody was obtained from murine ascites by inoculation with anti‐HLA‐ABC hybridoma (BB7.7, IgG2b), purchased from American Type Culture Collection (Manassas, VA, USA). FITC‐labeled rabbit antigoat or antimouse antibodies were from eBioscience (San Diego, CA, USA). Mouse anti‐MMP9, anti‐MT2‐MMP, and anti‐TIMP mAb were obtained from Santa Cruz Biotechnology (Santa Cruz, CA, USA). The broad‐spectrum MMP inhibitor GM6001 was purchased from Calbiochem (San Diego, CA, USA) and was used at 10 µM working concentration.
Isolation of peripheral blood‐NK cells. Peripheral blood mononuclear cells were isolated by Ficoll‐Hypaque density gradient centrifugation (Amersham Pharmacia Biotech, Piscataway, NJ, USA) from heparinized venous blood obtained from normal healthy volunteer donors. NK cells were isolated with the NK cell isolation kit (Miltenyi Biotec). Non‐NK cells were indirectly magnetically labeled by using a cocktail of biotin‐conjugated antibodies and the NK Cell MicroBead Cocktail (Miltenyi Biotec). Isolation of highly pure NK cells was achieved by depletion of magnetically labeled cells. The percentage of NK cells after isolation was evaluated using FITC‐conjugated anti‐CD3 mAb and plycoenythrin‐conjugated anti‐CD56 mAb (Becton Dickinson) in flow cytometry and was routinely >95%.
Cytotoxicity assay. Target tumor cells were labeled by incubation for 1 h at 37°C with Na51CrO4 (New England Nuclear, Boston, MA, USA) and washed three times. Labeled targets (104/well) were then incubated in a total volume of 200 µL with effector cells in 10% fetal bovine serum in RPMI‐1640 in 96‐well round‐bottom microtiter plates to obtain the differential effector : target cell ratio. Four replicate wells were used. The plate was centrifuged then incubated for 4 h, after which the supernatant was harvested and counted in a gamma counter (model 5500; Beckman Instrument, Irvine, CA, USA). The percentage of cytotoxicity was calculated as follows:
| 100 × ([experimental release – spontaneous release]/[maximum release – spontaneous release]). |
The spontaneous release was less than 15% of the maximum release.
Analysis of mRNA abundance by real‐time PCR. Total RNA from tumor cell lines was obtained using using TRIzol (Invitrogen). The concentration and quality of the extracted total RNA was determined by measuring light absorbance at 260 nm (A260) and the ratio of A260/A280. Reverse transcription was carried out with 2 µg total RNA according to the manufacturer's protocol for M‐MLV reverse transcriptase (Promega, Madison, WI, USA). First‐strand cDNA was synthesized from the total RNA of cells, in a total volume of 25 µL, using OligodT primer (15T). Triplicate 20‐µL PCR reactions were carried out using SYBR green master mix (Tiangen), initially for 10 min at 95°C followed by 42 cycles of 95°C for 15 s, 60°C for 60 s, and 72°C for 15 s in the MiniOption:003825 sequence detection system (Bio‐Rad). Primer efficiency and specificity for the genes was demonstrated by the overlapping amplification profiles and melting curving of equal quantities of cDNA. The levels of mRNA were normalized to that of β‐actin. The primers were as follows: MICA forward 5′‐CCT CTG AGG CCT CCC TGC G‐3′, MICA reverse 5′‐CCT TGG CCA TGA ACG TCA GG‐3′; MMP9 forward 5′‐ACC TCG AAC TTT GAC AGC GAC‐3′, MMP9 reverse 5′‐GAG GAA TGA TCT AAG CCC AGC‐3′; MT2‐MMP forward 5′‐ATC CCC TAT GAC CGC ATT GAC‐3′, MT2‐MMP reverse 5′‐CCC CTG CCA GAC ACT GAT G‐3′; TIMP1 forward 5′‐CTT CTG GCA TCC TGT TGT TG‐3′, TIMP1 reverse 5′‐AGA AGG CCG TCT GTG GGT‐3′; β‐actin forward 5′‐CAC TGT GTT GGC GTA CAG GT‐3′, β‐actin reverse 5′‐TCA TCA CCA TTG GCA ATG AG‐3′.
Flow cytometry. Cell surface expression of NKG2D ligands and HLA class I molecules was detected by flow cytometry. Detached cells were incubated with anti‐MICA, anti‐MICB, anti‐ULBP3, and anti‐HLA‐ABC antibodies separately, followed by incubation with FITC‐labeled rabbit antimouse IgG or rabbit antigoat IgG (eBioscience). After incubation for 30 min at 4°C, cells were washed three times in washing buffer and fixed in PBS containing 1% (w/v) paraformaldehyde. The samples were examined on a flow cytometry FACScan (Becton Dickinson, Mountain View, CA, USA) and the data were analyzed with WinMDI software (Scripps Research Institute).
Western blotting. Tumor cells were collected and resuspended in lysis buffer (30 mmol/L Tris–HCl [pH 7.5], 150 mmol/L sodium chloride, 1 mmol/L phenylethylsufonyl fluoride, 5 mmol/L edetic acid, 1% Nonidet P‐40, 1 mmol/L sodium orthovanadate, and 10 mg/mL aprotinin) for 15 min at 4°C. The suspension was then vortexed and centrifuged at 10 000 g for 10 min. The supernatant was collected and mixed with an equivalent volume of 2× protein loading buffer containing 2‐mercaptoethanol, and boiled for 5 min before loading onto sodium dodecylsulfate–polyacrylamide gel electrophoresis. Upon completion of gel electrophoresis, proteins were transferred onto nitrocellulose membranes and blotted against primary antibodies for 1 h at room temperature. Membranes were washed with PBS containing 0.05% Tween‐20 (pH 7.4) and incubated with horseradish peroxidase‐conjugated secondary antibody for 1 h. Protein bands were visualized by enhanced chemiluminescence (Amersham Pharmacia Biotech).
Plasmid construct. The human full‐size MICA promoter fragment was amplified by PCR using platinum Taq polymerase (Invitrogen Life Technologies) with genomic DNA from the human Hela cell line as template. The forward (5′‐ATCTCGAGCAGGTGCTTCTGAGAGGCA‐3′) and reverse (5′‐ATAAGCCTCGACGTCGCCACCCTCTC‐3′) primers contain restriction sites for XhoI and HindIII, respectively, at the 5′ end. The amplified band was cloned into the pMD18‐T vector to produce the pMD18‐T/MICA promoter. The plasmid obtained was digested with XhoI and HindIII and it was then ligated into the luciferase reporter pGL3 basic vector (Promega) to yield pMICA‐LUC. Plasmid inserts and promoter constructs were verified by sequence analysis.
Transfections and luciferase assays. The human cervical carcinoma cell lines Hela and Caski were cultured in RPMI‐1640 medium supplemented with 10% fetal bovine serum. At 80–90% confluence, transfections were carried out in triplicate in 24‐well plates using Lipofectamine 2000 (Invitrogen) according to the manufacturer's instructions. Cells were cotransfected with pMICA‐LUC and pRL‐TK renilla luciferase vector (Promega; 30:1), which was used as an internal control. Cells were then washed with PBS and incubated overnight in the culture medium containing 10% fetal bovine serum before they were stimulated with IFNγ or IFNα (1000 u/mL) for 48 h. Cell extracts were assayed for firefly and Renilla luciferase activities using the dual luciferase reporter assay system (Promega) as instructed by the manufacturer. The activity of MICA promoter was determined by calculating the ratio of firefly : Renilla luciferase activity. Data were expressed as a percentage of the control (MICA promoter activity in cells transfected with pMICA‐LUC and incubated with the culture medium alone).
Detection of sMICA by ELISA. The level of sMICA in cell culture supernatants was determined using the Human MICA DuoSet ELISA Development Kit (R & D Systems), following the manufacturer's instructions.
Statistical analysis. Statistical analysis was carried out using a paired Student's test. A value of P < 0.05 was considered statistically significant.
Results
Opposing effects of IFNα and IFNγ on the expression of MICA in tumors. First, we observed the effects of IFNα and IFNγ on MICA expression in the human cervical carcinoma cell line Hela and the human erythroleukemia K562 cell line, both of which were found to express MICA. Hela and K562 cells were starved for 4 h in serum‐free medium and then cocultured with 1000 u/mL IFNα or IFNγ for 0, 24, 48, and 72 h separately or stimulated with different dosages of IFNα or IFNγ for 48 h. Real‐time PCR analysis revealed that the transcripts of MICA in both cell lines increased after incubation with 1000 u/mL IFNα for 24 h, and were more significantly augmented when incubated for 48 and 72 h. The results were further confirmed by the dose responses of IFNα on both cell lines for 48 h, which showed that more than 500 u/mL IFNα enhanced the expression of MICA transcripts, whereas 1000 and 2000 u/mL exerted more significant effects (Fig. 1a). In contrast, stimulation with 1000 u/mL IFNγ for at least 24 h or >500 u/mL IFNγ for 48 h decreased MICA transcripts in both cell lines (Fig. 1a). Subsequently, we further detected MICA protein expression with flow cytometry. The results showed that IFNα promotes surface MICA protein expression in Hela and K562 cells, whereas IFNγ exerts an opposing effect (Fig. 1c). Similar results were also obtained by detecting MICA protein expression with immunocytochemistry analysis (data not shown). To further observe the exact effect of both IFN on MICA expression, we first incubated Hela or K562 cells with 1000 u/mL IFNα for 48 h, and then washed and stimulated cells with 1000 u/mL IFNγ for 12 h. FACS analysis revealed that MICA expression was higher with sequential exposure to IFNα and then IFNγ stimulation than with IFNγ treatment alone on both Hela and K562 cell lines (Fig. 1c).
Figure 1.
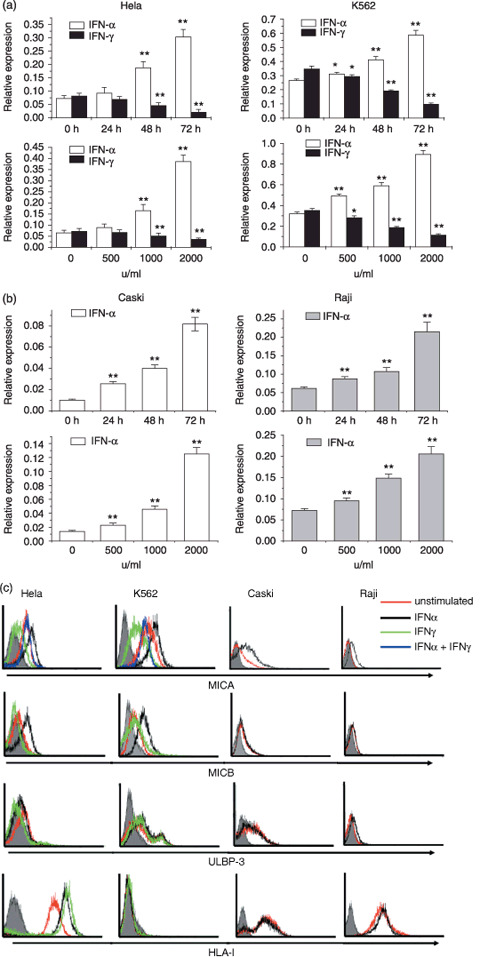
Effect of interferon (IFN)‐α or IFNγ on the expression of major histocompatibility complex class I‐related chain (MIC) A in tumor cell lines. (a) Real‐time polymerase chain reaction (PCR) analysis of MICA mRNA in Hela and K562 cell lines. Hela and K562 cells were starved for 4 h in serum‐free medium and then cocultured with 1000 u/mL IFNα or IFNγ for 0, 24, 48, and 72 h separately or stimulated with different dosages of IFNα or IFNγ for 48 h separately. Then, transcripts of MICA were measured by real‐time PCR. The relative expression of mRNA was normalized to that of β‐actin. (b) Expression of MICA mRNA in Caski and Raji cell lines. Caski and Raji cells were starved for 4 h and then treated with 1000 u/mL IFNα for 0, 24, 48, and 72 h or stimulated with different dosages of IFNα for 48 h, respectively. The relative expression of mRNA was normalized to that of β‐actin. (c) FACS analysis of natural killer group 2D ligands (MICA, MICB, UL16‐binding protein [ULBP3]) and human leukocyte antigen (HLA) class I molecule expression on untreated tumor cell lines and treatment with 1000 u/mL IFNα or IFNγ for 72 h. Shaded histograms, isotype control stainings; red lines, staining of unstimulated cells; black lines, expression of IFNα‐treated cells; green lines, expression of IFNγ‐treated cells; blue lines, expression of cells exposed first to IFNα and then to IFNγ stimulation. All experiments were repeated three times with the representative experiment shown here. Values are shown as mean ± SEM. *P < 0.05, **P < 0.01 versus unstimulated control (0 h or 0 u/mL).
Furthermore, we observed the effect of IFNα on MICA expression in the low MICA expression tumor cell line (the human cervical carcinoma cell Caski) and the MICA negative expression tumor cell line (human Burkitt's lymphoma cell Raji). As indicated in Figure 1b,c, IFNα stimulation also upregulated the mRNA and protein expression of MICA in the Caski cell line and induced MICA expression in Raji cells both in a time‐ and dose‐dependent manner.
The expression of NKG2D ligands and HLA class I molecules on the above four tumor cell lines and the effect of IFNα and IFNγ detected by FACS is shown in Figure 1c. We found that, in addition to the promotion of MICA expression, IFNα also enhanced MICB expression on Hela and K562 cells, whereas IFNγ did not impair MICB expression. We did not find an effect of IFNα or IFNγ on ULBP expression in the four tumor cell lines (Fig. 1c; data not shown). Both IFNα and IFNγ stimulation increased HLA class I expression on the Hela cell line, but they did not influence expression on the K562, Caski, or Raji cell lines (Fig. 1c).
Altered MICA expression by IFNα or IFNγ results in differential susceptibility of tumors to NK lysis. To investigate whether changes in the level of MICA expression on tumor cells influenced the recognition of NKG2D by NK cells, we observed the cytotoxicity of freshly isolated NK cells against tumors pretreated with IFNα or IFNγ. Our results showed that the susceptibility of the four tumor cell lines to NK lysis was augmented significantly at different effector : target ratios when tumor cells were pretreated with 1000 u/mL IFNα for 72 h. When NKG2D–MICA interactions were blocked with a mAb against MICA (anti‐MICA), the killing of both IFNα‐treated or unstimulated Hela and K562 cells was reduced to nearly the same level (Fig. 2a). Due to the low‐level expression of MICA on Caski cells and the negative MICA expression on Raji cells, blocking of MICA did not influence the cytotoxicity of NK cells against these two unstimulated cell lines. However, when MICA expression was upregulated by IFNα, blockade with anti‐MICA antibody did indeed attenuate the enhancement of NK lysis against IFNα‐stimulated Caski and Raji cells to their basal level (Fig. 2a). Furthermore, pretreating NK cells with neutralizing mouse antibodies against human NKG2D attenuated NK lysis against the above four tumor cell lines more strongly then MICA blockade (Fig. 2a). This is possibly due to the expression of other NKG2D ligands (MICB and ULBP) by tumor cell lines and the enhancement of MICB expression by IFNα on Hela and K562 cell lines (Fig. 1c). These results demonstrate that the interaction of NKG2D and its ligands is the main event during NK lysis, and increased NK cytolysis by IFNα is mainly due to the increased level of MICA or MICB on tumor cells and the promotion of recognition by NK cells.
Figure 2.
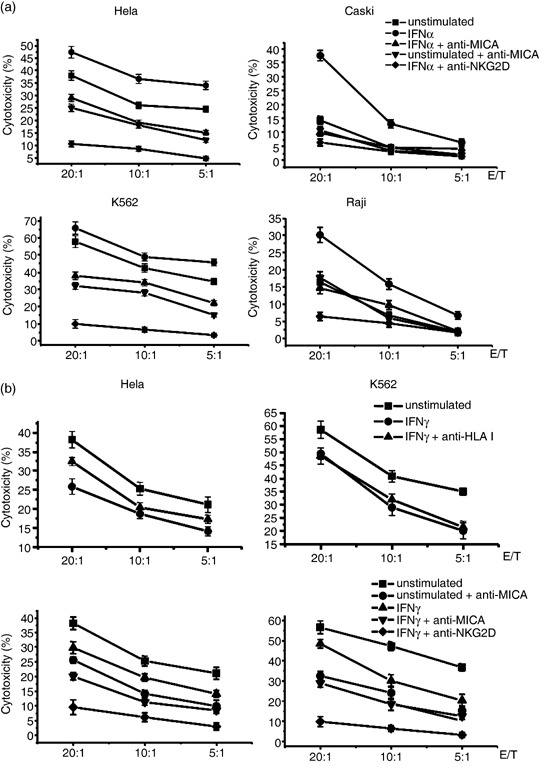
Cytotoxicity of natural killer (NK) cells to tumor cells pretreated with interferon (IFN)‐α or IFNγ. (a) Specific lysis of NK cells to solid tumor cell lines (Hela and Caski) and hematological tumor cells (K562 and Raji) pretreated with IFNα. Tumor cell lines were treated with culture medium (unstimulated) or 1000 u/mL IFNα for 72 h and used as targets in the chromium release assay. Assays were carried out in the presence of anti‐major histocompatibility complex class I‐related chain A (MICA) antibody or isotype control. For natural killer group 2D (NKG2D) blockade, primary NK cells were preincubated with mouse antihuman NKG2D monoclonal antibody for 1 h and then used as effector cells for NK lysis. (b) Specific lysis of NK cells to Hela and K562 cell lines pretreated with IFNγ. Tumor cell lines were treated with medium or 1000 u/mL IFNγ for 72 h and used as targets in the chromium release assay. Assays were carried out in the presence of blocking anti‐human leukocyte antigen (HLA)‐ABC, anti‐MICA antibody, or isotype control. Primary NK cells were also preincubated with mouse antihuman NKG2D monoclonal antibody or isotype antibody for 1 h and then used as effector cells for NK lysis to examine the effect of NKG2D blockade. All experiments were carried out at least three times.
After incubation with 1000 u/mL IFNγ for 72 h, the sensitivity of Hela and K562 cells to NK lysis diminished significantly (Fig. 2b). Our previous work and that by other researchers has found that IFNγ might augment the expression of MHC class I molecules on tumor cells, which results in reduced NK cytolysis.( 10 , 11 , 12 ) To explore whether the reduced sensitivity of IFNγ‐treated Hela and K562 cells to NK lysis was due to increased MHC class I molecules on cell surfaces, we blocked the HLA class I molecules on IFNγ‐treated or unstimulated Hela and K562 cells with anti‐HLA‐ABC antibody before detecting their killing by NK cells. As shown in Figure 2b, pretreatment of IFNγ‐treated K562 cells with anti‐HLA‐ABC antibody did not affect the cytotoxicity. The reason may be that K562 cells did not express any HLA class I molecules and IFNγ treatment did not induce HLA expression as shown in Figure 1c. As for Hela cells, blockade with anti‐HLA‐ABC antibody augmented the killing by NK cells, but did not reach the level of IFNγ‐untreated cells. This indicates that HLA class I upregulation by IFNγ on Hela cells (Fig. 1c) was partly involved in the inhibitory effect of IFNγ on NK cell target killing. Furthermore, the addition of anti‐MICA blocking antibody or NKG2D blockade reduced the killing of both IFNγ‐treated or unstimulated Hela and K562 cells (Fig. 2b). Although IFNγ reduced MICA expression on Hela and K562 cell lines, it did not inhibit the expression completely. That is, IFNγ‐treated Hela and K562 cells still express some level of MICA. These results further indicate that reduced MICA expression was the main cause for the reduced killing.
Interferon‐α augments MICA promoter activity. To further determine whether IFNα and IFNγ regulate MICA expression at the transcriptional level, a human MICA promoter sequence was amplified and cloned into the luciferase reporter pGL3‐basic vector. The transcriptional activity of the MICA promoter–luciferase construct in the presence and absence of IFNα or IFNγ was evaluated after transfection with the MICA promoter construct or with the pGL3 luciferase reporter vector as control. As shown in Figure 3, the activity of the MICA promoter was increased significantly in Hela and Caski cell cultures exposed to IFNα. These data provide evidence that IFNα promotes MICA expression at the level of transcription, which, in turn, upregulates the cell surface expression of MICA. Although we did find that IFNγ downregulated MICA transcription in a time‐ and dose‐dependent manner in Hela and K562 cells (Fig. 1a), the results showed that IFNγ treatment did not affect the luciferase activity of either cell type (Fig. 3). It is possible that in addition to promoter activity, there may be other mechanisms for IFNγ to interfere with MICA transcription.
Figure 3.
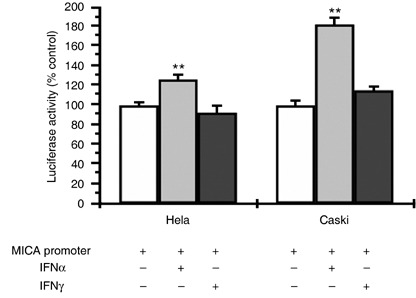
Effects of interferon (IFN)‐α and IFNγ on major histocompatibility complex class I‐related chain A (MICA) promoter activity. The human MICA gene promoter region was amplified by polymerase chain reaction and then cloned into the luciferase reporter pGL3 basic‐vector. The human cervical carcinoma cell lines Hela and Caski were transiently transfected with pMICA‐LUC and pRL‐TK. The transfected cells were then incubated for 48 h with 1000 u/mL IFNα or IFNγ before being harvested. Cell lysates were analyzed for firefly and renilla luciferase activities. Data were expressed as a percentage of the control (MICA promoter activity in cells transfected with pGL3‐MICA and incubated with the culture medium alone). Data are mean ± SEM from three independent experiments. **P < 0.01 compared with unstimulated control.
Interferon‐γ promotes the shedding of membrane MICA through influencing the expression of MMP. Recently, it has been described that tumor cells shed MICA in a soluble form (sMICA) and by that might escape from NKG2D‐mediated surveillance through downregulation of NKG2D surface expression on CD8+ T, γδT, and NK cells.( 13 , 14 , 15 ) sMICA is released by proteolytic shedding from the tumor cell surface by metalloproteinases.( 16 ) Therefore, apart from regulation at the transcriptional level, shedding of MICA is also involved in the modulation of membrane MICA expression on the surface of tumor cells. It has been found that soluble HLA class I molecules and soluble non‐classical HLA‐G were also released from the cell surface by MMP, and IFNγ seemed to drive the MMP‐dependent cleavage of HLA class I soluble forms.( 17 , 18 ) In order to investigate whether IFNγ diminishes MICA expression on the tumor cell surface through increasing the cleavage function of MMP, we observed the effect of IFNγ on membrane metalloproteinase expression in Hela and K562 cells. The membrane‐related metalloproteinases observed include MT1‐MMP, MT2‐MMP, MT3‐MMP, MMP2, MMP9, and TIMP1 and TIMP2. Real‐time PCR analysis revealed that IFNγ treatment did not impair the transcription of MT1‐MMP, MT3‐MMP, MMP2, and TIMP2 (data not shown). When Hela and K562 cell lines were stimulated with 1000 u/mL IFNγ for 12 h, the mRNA expression of MMP9 and MT2‐MMP increased significantly and were sustained at higher levels for at least 48 h. However, the transcription of TIMP1, which is an MMP inhibitor, diminished from 12 h after IFNγ stimulation (Fig. 4a). Similar results were obtained at the protein level by western blotting (Fig. 4b). We concluded that IFNγ might disturb the balance of MMP–TIMP by upregulating the expression of MMP9 and MT2‐MMP and downregulating TIMP1 expression and therefore promoting the cleavage of MICA by MMP, which results in a reduction in the surface level of MICA on tumor cells.
Figure 4.

Effects of interferon (IFN)‐γ on matrix metalloproteinase (MMP) expression. Hela and K562 cell lines were stimulated with 1000 u/mL IFNγ for the indicated times. (a) mRNA expression of MMP9, membrane‐type matrix metalloproteinase (MT‐MMP), and tissue inhibitor of matrix metalloproteinase (TIMP) was measured by real‐time polymerase chain reaction. (b) MMP protein expression in Hela and K562 cell lines was detected by western blotting.
To further confirm the effect of IFNγ on sMICA release, we detected the concentration of sMICA by ELISA in culture supernatants of Hela and K562 cell lines stimulated with IFNγ or medium. The results showed that the concentration of sMICA in the culture supernatants of both cells stimulated with 1000 u/mL IFNγ for 72 h increased compared with unstimulated cells. This effect was inhibited significantly by a neutralizing antibody to IFNγ (Fig. 5). We also observed the effect of the broad‐spectrum MMP inhibitor GM6001 on the release of sMICA and found a pronounced reduction of sMICA release (Fig. 5), which demonstrated the contribution of MMP to the shedding of membrane MICA. These results indicated that IFNγ promoted the shedding of sMICA through altering the balance of MMP–TIMP and augmenting the cleavage function of MMP.
Figure 5.
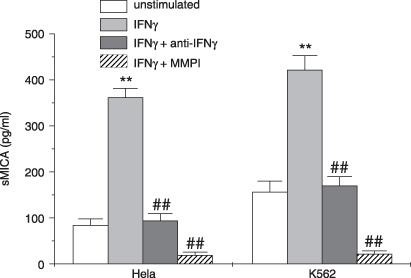
Detection of soluble major histocompatibility complex class I‐related chain A (sMICA) by enzyme‐linked immunosorbent assay (ELISA) in culture supernatants of Hela and K562 cell lines. Hela and K562 cell lines were treated with 1000 u/mL interferon (IFN)‐γ or medium and in the presence of neutralizing antibody to IFNγ or matrix metalloproteinase (MMP) inhibitor GM6001 for 72 h. Then culture supernatants were collected and used for detection of sMICA by ELISA. Data are mean ± SEM from three independent experiments. **P < 0.01 compared with unstimulated control. ## P < 0.01 compared with the IFNγ‐stimulated group.
Discussion
The interaction of NKG2D and its ligands potentially plays a central role in tumor immunity based on the fact that the NKG2D pathway is largely resistant to inhibitory signals delivered by the interaction of inhibitory NK receptors with their MHC class I ligands. The levels of NKG2D ligands might determine the strength of antitumor immune responses. Therefore, tight regulation of NKG2D ligand expression is important. Some factors have been found to be involved in the regulation of NKG2D ligand expression, but their precise mechanisms are still unclarified. Cell surface expression of MICA, which is under the control of a heat shock promoter, could be induced by cellular stress (e.g. by heat shock, transformation, and viral or bacterial infections).( 4 , 5 , 6 , 7 ) Upregulation of MICA has also been reported to occur upon DNA damage, oxidative stress, and treatment with retinoic acid or the histone deacetylase inhibitor sodium valproate.( 4 , 5 , 6 , 7 , 19 )
We had previously shown that IFNα and IFNγ exert distinct effects on the expression of NK cell receptors in NK cells. IFNα upregulates expression of the activating receptor NKG2D and inhibits expression of the inhibitory receptors NKG2A and KIR2DL1, whereas IFNγ promotes NKG2A expression but downregulates NKG2D expression.( 8 , 9 ) Here, we postulate a hypothesis that IFNα and IFNγ might exert differential effects on the expression of NKG2D ligands in the same tumor microenvironment. It is reported that MICA expression can be induced on dendritic cell by IFNα or interleukin‐15 stimulation, which in turn activates NK cell activation.( 20 , 21 ) However, IFNγ was found to downregulate the murine NKG2D ligand H60 on tumors.( 22 ) In the present study, we demonstrated that IFNα treatment also promotes MICA expression in human solid and hematological tumor cells. This increased MICA expression renders tumor cells more sensitive to NK lysis. This effect might be one of the mechanisms for IFNα to contribute to immune responses against tumors. By constructing the luciferase reporter pGL3 vector containing the MICA promoter, we further demonstrated that IFNα promotes MICA expression at the level of transcription. In contrast to the effect of IFNα, IFNγ stimulation reduced MICA expression and therefore diminished the susceptibility of tumors to NK cytolysis.
Although we did detect a reduction of MICA expression at the transcriptional level after IFNγ stimulation by real‐time PCR analysis (as shown in Fig. 1a), we failed to find evidence that IFNγ impaired the activity of the MICA promoter. To date, the transcriptional regulation mechanism of MICA is still poorly defined. In addition to the activity of the MICA promoter, there are regulatory elements upstream and downstream of the promoter sequence that might regulate MICA transcription. Many transcription factors, such as specificity protein 1 and specificity protein 3, also play important roles in the regulation of MICA transcription.( 23 , 24 ) Other regulatory mechanisms, such as DNA methylation, may also be involved in its transcription. In the present study, we amplified and cloned the full‐size human MICA promoter fragment (–6 to –578) into the pGL‐3 luciferase reporter vector and observed its transcriptional activity. It is possible that IFNγ represses MICA transcription through acting on other regulatory elements upstream or downstream of the promoter sequence, or by acting on transcriptional control factors. Further study is needed to clarify the precise regulatory mechanisms.
There have been some reports that the mRNA expression of some NKG2D ligands does not always correlate with cell surface expression levels in peripheral blood and tumor cell lines, which suggests that NKG2D ligand expression is regulated at a level other than transcription.( 7 , 25 ) It is possible that MICA protein expression is not only regulated transcriptionally, but also post‐translationally at the cell surface. It was shown that the cell surface expression of MICA is also downregulated by proteolytic shedding mediated by MMP that are secreted by tumor cells.( 16 ) However, IFNγ has been found to drive the production of some soluble molecules (e.g. soluble HLA I) in a metalloproteinase‐dependent fashion.( 18 ) Here, we tried to explore whether IFNγ is also involved in the release of sMICA and therefore reduces the cell surface expression of MICA. Our results showed that IFNγ upregulates the expression of MMP9 and MT2‐MMP and downregulates expression of the MMP inhibitor TIMP1. Further, IFNγ stimulation increased the production of sMICA in culture supernatants of Hela and K562 cells. Thus, the results shed light on the possibility that IFNγ modulates MICA expression not only at the transcriptional level, but also at the post‐translational level by promoting proteolytic cleavage.
Interferon‐γ is well recognized as an important regulator of immune responses to tumors. It functions to regulate Th1 responses that are critical to CTL responses and IgG antibody production.( 26 ) However, increasing evidence has suggested that IFNγ also exerts negative regulatory effects on immune responses. It has been found to impair the effector function of NK, CTL, and NKT cells through altering the expression of NK cell receptors and their ligands.( 8 , 9 , 27 , 28 ) It induces the generation of regulatory T cells and acts as an important mediator to not only suppress the activation and proliferation of naïve T cells and antigen‐specific T cells, but to also induce the apoptosis of effector T cells.( 29 , 30 , 31 , 32 , 33 ) In the present study, we demonstrated that IFNγ downregulates MICA expression on tumor cells both at the transcriptional and post‐translational levels and therefore inhibits cytotoxicity by NK cells, whereas IFNα exerts an opposing effect. In contrast, Bui and colleagues showed that both IFNα and IFNγ downregulate expression of the NKG2D ligand H60 on tumors.( 22 ) The differening results might be due to distinct regulatory mechanisms for these two NKG2D ligands, the different species used in each study (human and mouse), or the different tumors observed.
In conclusion, we propose for the first time that IFNα and IFNγ exert opposing effects on MICA expression in human tumor cells, although further study is needed to clarify the precise regulatory mechanisms. Cell surface expression of NKG2D ligands should be tightly controlled in order to either avoid attack against autologous healthy cells, which could possibly lead to autoimmunity, or avoid failure to upregulate the ligands in pathological situations, which might result in the development of cancer, or the spread of infection. Future investigations directed at dissecting the mechanisms controlling the regulation of NKG2D ligands offer a better understanding of the role of the NKG2D system in immune responses and how deregulation of this system results in disease. The pathways involved in NKG2D ligand induction might represent a promising target for improving immune responses to cancer or infections.
Acknowledgments
This work was supported by the Natural Science Foundation of China (#30371302, #30471572, #30671901, #90713033) and National 973 Basic Science Program (#2006CB504300, #2007CB815800).
References
- 1. Cerwenka A, Lanier LL. Natural killer cells, viruses and cancer. Nat Rev Immunol 2001; 1: 41–9. [DOI] [PubMed] [Google Scholar]
- 2. Smyth MJ, Hayakawa Y, Takeda K, Yagita H. New aspects of natural‐killer cell surveillance and therapy of cancer. Nat Rev Cancer 2002; 2: 850–61. [DOI] [PubMed] [Google Scholar]
- 3. Hallett WH, Murphy WJ. Natural killer cells: biology and clinical use in cancer therapy. Cell Mol Immunol 2004; 1: 12–21. [PubMed] [Google Scholar]
- 4. Raulet DH. Roles of the NKG2D immunoreceptor and its ligands. Nat Rev Immunol 2003; 3: 781–90. [DOI] [PubMed] [Google Scholar]
- 5. Watzl C. The NKG2D receptor and its ligands – recognition beyond the ‘missing self’? Microbes Infection 2003; 5: 31–7. [DOI] [PubMed] [Google Scholar]
- 6. Cerwenka A, Lanier LL. NKG2D ligands: unconventional MHC class I‐like molecules exploited by viruses and cancer. Tissue Antigen 2003; 61: 335–43. [DOI] [PubMed] [Google Scholar]
- 7. Mistry AR, O’Callaghan CA. Regulation of ligands for the activating receptor NKG2D. Immunology 2007; 121: 439–47. [DOI] [PMC free article] [PubMed] [Google Scholar]
- 8. Zhang C, Zhang J, Sun R, Feng J, Wei H, Tian Z. Opposing effect of IFNγ and IFNα on expression of NKG2 receptors: negative regulation of IFNγ on NK cells. Int Immunopharmacol 2005; 5: 1057–67. [DOI] [PubMed] [Google Scholar]
- 9. Dong Z, Zhang C, Wei H, Sun R, Tian Z. Impaired NK cell cytotoxicity by high level of interferon‐γ in concanavalin A‐induced hepatitis. Can J Physiol Pharmacol 2005; 83: 1045–53. [DOI] [PubMed] [Google Scholar]
- 10. Zhang C, Tian Z, Hou G, Zhang J, Wang J, Sun R. Influence of HLA class I molecules expression on tumor cell resistance to NK lysis and the IFN‐γ regulatory effect. Zhonghua Zhong Liu ZA Zhi 2001; 23: 369–72. [PubMed] [Google Scholar]
- 11. Pende D, Accame L, Pareti L et al . The susceptibility to natural killer cell‐mediated lysis of HLA class I‐positive melanomas reflects the expression of insufficient amounts of different HLA class I alleles. Eur J Immunol 1998; 28: 2384–94. [DOI] [PubMed] [Google Scholar]
- 12. Dunn GP, Koebel CM, Schreiber RD. Interferons, immunity and cancer immunoediting. Nat Rev Immunol 2006; 6: 836–48. [DOI] [PubMed] [Google Scholar]
- 13. Groh V, Wu J, Yee C, Spies T. Tumour‐derived soluble MIC ligands impair expression of NKG2D and T‐cell activation. Nature 2002; 419: 734–8. [DOI] [PubMed] [Google Scholar]
- 14. Jinushi M, Takehara T, Tatsumi T et al . Impairment of natural killer cell and dendritic cell functions by the soluble form of MHC class I‐related chain A in advanced human hepatocellular carcinomas. J Hepatol 2005; 43: 1013–20. [DOI] [PubMed] [Google Scholar]
- 15. Märten A, Von Lilienfeld‐Toal M, Büchler MW, Schmidt J. Soluble MIC is elevated in the serum of patients with pancreatic carcinoma diminishing γδ T cell cytotoxicity. Int J Cancer 2006; 119: 2359–65. [DOI] [PubMed] [Google Scholar]
- 16. Salih HR, Rammensee HG, Steinle A. Cutting edge: down‐regulation of MICA on human tumors by proteolytic shedding. J Immunol 2002; 169: 4098–102. [DOI] [PubMed] [Google Scholar]
- 17. Demaria S, Bushkin Y. Soluble HLA proteins with bound peptides are released from the cell surface by the membrane metalloproteinase. Human Immunol 2000; 61: 1332–8. [DOI] [PubMed] [Google Scholar]
- 18. Haynes LD, Bushkin Y, Love RB, Burlingham WJ. Interferon‐γ drives the metalloproteinase‐dependent cleavage of HLA class I soluble forms from primary human bronchial epithelial cells. Human Immunol 2002; 63: 893–901. [DOI] [PubMed] [Google Scholar]
- 19. Gasser S, Raulet DH. The DNA damage response arouses the immune system. Cancer Res 2006; 66: 3959–62. [DOI] [PubMed] [Google Scholar]
- 20. Jinushi M, Takehara T, Kanto T et al . Critical role of MHC class I‐related chain A and B expression on IFNα‐stimulated dendritic cells in NK cell activation: impairment in chronic hepatitis C infection. J Immunol 2003; 170: 1249–56. [DOI] [PubMed] [Google Scholar]
- 21. Jinushi M, Takehara T, Tatsumi T et al . Autocrine/paracrine IL‐15 that is required for type I IFN‐mediated dendritic cell expression of MHC class I‐related chain A and B is impaired in hepatitis C virus infection. J Immunol 2003; 171: 5423–9. [DOI] [PubMed] [Google Scholar]
- 22. Bui JD, Carayannopoulos LN, Lanier LL, Yokoyama WM, Schreiber RD. IFN‐dependent downregulation of the NKG2D ligand H60 on tumors. J Immunol 2006; 176: 905–13. [DOI] [PubMed] [Google Scholar]
- 23. Venkataraman GM, Suciu D, Groh V, Boss JM, Spies T. Promoter region architecture and transcriptional regulation of the genes for the MHC class I‐related chain A and B ligands of NKG2D. J Immunol 2007; 178: 961–9. [DOI] [PubMed] [Google Scholar]
- 24. Rodríguez‐Rodero S, González S, Rodrigo L et al . Transcriptional regulation of MICA and MICB: a novel polymorphism in MICB promoter alters transcriptional regulation by Sp1. Eur J Immunol 2007; 37: 1938–53. [DOI] [PubMed] [Google Scholar]
- 25. Pende D, Rivera P, Marcenaro S et al . Major histocompatability complex class I‐related chain A and UL16‐binding protein expression on tumor cell lines of different histiotypes: analysis of tumor susceptibility to NKG2D‐dependent natural killer cell cytotoxicity. Cancer Res 2002; 62: 6178–86. [PubMed] [Google Scholar]
- 26. Boehm U, Klamp T, Groot M, Howard C. Cellular responses to interferon‐γ. Annu Rev Immunol 1997; 15: 749–95. [DOI] [PubMed] [Google Scholar]
- 27. Malmberg KJ, Levitsky V, Norell H et al . IFN‐γ protects short‐term ovarian carcinoma cell lines from CTL lysis via a CD94/NKG2A‐dependent mechanism. J Clin Invest 2002; 110: 1515–23. [DOI] [PMC free article] [PubMed] [Google Scholar]
- 28. Ota T, Takeda K, Akiba H et al . IFN‐γ‐mediated negative feedback regulation of NKT‐cell function by CD94/NKG2. Blood 2005; 106: 184–92. [DOI] [PMC free article] [PubMed] [Google Scholar]
- 29. Wang Z, Hong J, Sun W et al . Role of IFN‐γ in induction of Foxp3 and conversion of CD4+CD25−T cells to CD4+ Tregs. J Clin Invest 2006; 116: 2434–41. [DOI] [PMC free article] [PubMed] [Google Scholar]
- 30. Sawitzki B, Kingsley CI, Oliveira V, Karim M, Herber M, Wood KJ. IFN‐γ production by alloantigen‐reactive regulatory T cells is important for their regulatory function in vivo . J Exp Med 2005; 201: 1925–35. [DOI] [PMC free article] [PubMed] [Google Scholar]
- 31. Ding Q, Lu L, Wang B et al . B7H1‐Ig fusion protein activates the CD4+ IFN‐γ receptor+ type 1 T regulatory subsets through IFN‐γ‐secreting Th1 cells. J Immunol 2006; 177: 3606–14. [DOI] [PubMed] [Google Scholar]
- 32. Wood KJ, Sawitzki B. Interferon gamma: a crucial role in the function of induced regulatory T cells in vivo . Trends Immunol 2006; 27: 183–7. [DOI] [PubMed] [Google Scholar]
- 33. Yang YG, Wang H, Asavaroengchai W, Dey BR. Role of interferon‐γ in GVHD and GVL. Cell Mol Immunol 2005; 2: 323–9. [PubMed] [Google Scholar]