

Abstract
Resistance to chemotherapeutic agents represents the chief cause of mortality in cancer patients with advanced disease. Chromosomal aberration and altered gene expression are the main genetic mechanisms of tumor chemoresistance. In this study, we have established an algorithm to calculate DNA copy number using the Affymetrix 10K array, and performed a genome‐wide correlation analysis between DNA copy number and antitumor activity against 5‐fluorouracil (5‐FU)‐based drugs (S‐1, tegafur + uracil [UFT], 5′‐DFUR and capecitabine) to screen for loci influencing drug resistance using 27 human cancer xenografts. A correlation analysis confirmed that the single nuceotide polymorphism (SNP) showing significant associations with drug sensitivity were concentrated in some cytogenetic regions (18p, 17p13.2, 17p12, 11q14.1, 11q11 and 11p11.12), and we identified some genes that have been indicated their relations to drug sensitivity. Among these regions, 18p11.32 at the location of the thymidylate synthase gene (TYMS) was strongly associated with resistance to 5‐FU‐based drugs. A change in copy number of the TYMS gene was reflected in the TYMS expression level, and showed a significant negative correlation with sensitivity against 5‐FU‐based drugs. These results suggest that amplification of the TYMS gene is associated with innate resistance, supporting the possibility that TYMS copy number might be a predictive marker of drug sensitivity to fluoropyrimidines. Further study is necessary to clarify the functional roles of other genes coded in significant cytogenetic regions. These promising data suggest that a comprehensive DNA copy number analysis might aid in the quest for optimal markers of drug response. (Cancer Sci 2007; 98: 577–583)
Differences in the efficacy of anticancer drugs among patients have been associated with polymorphisms or differences in the gene expression profiles of cancer cells. Predicting tumor response based on valid markers is therefore important because patients who are unlikely to respond to a treatment can avoid the adverse effects of unsuccessful treatments and be placed on alternative regimens. Hence, the development of tailor‐made chemotherapy regimens, which would select a suitable regimen for each patient based on biological features including genomic factors and gene expression profiles, is a very critical issue. Several reports have described associations between antitumor activity to anticancer drugs and gene expression levels.( 1 , 2 , 3 , 4 , 5 , 6 ) We have also carried out a similar approach.( 7 ) This method, which is highly sensitive and reproducible as long as the initial RNA is intact, can quantitate RNA abundance. However, although the level of RNA expression and protein can provide clues to causal events, it may be difficult to measure accurately for technical reasons. In addition, RNA may be instable leading to degradation, especially in clinical tissue, and alternative predictive markers of RNA expression may be favorable.
5‐Fluorouracil (5‐FU) is one of the most commonly used anticancer drugs, and oral fluoropyrimidines such as 5′‐deoxy‐5‐fluorouridine (5′‐DFUR), capecitabine, UFT and S‐1 have played a major role in the treatment of various solid tumors.( 8 , 9 ) 5‐FU has two main modes of action that are realized through its active metabolites: 5‐fluoro‐2′‐deoxyuridine‐5′‐monophosphate (FdUMP) and fluorouridine 5′‐triphosphate (FUTP). FdUMP inhibits thymidylate synthase (TS), which subsequently suppresses DNA synthesis, whereas FUTP is incorporated into RNA, resulting in the distortion of gene expression.( 10 ) TS catalyzes the conversion of uridine‐5′‐monophosphate (dUMP) to thymidine‐5′‐monophosphate (dTMP), the latter being necessary for DNA synthesis. The inhibition of TS activity is thought to be a major mechanism responsible for the anticancer effect of 5‐FU. To screen for genes associated with drug sensitivity to fluoropyrimidines, large‐scale microarray analyses of gene expression levels have been carried out.( 7 , 11 ) However, few reports have explored predictive markers other than mRNA expression levels.
Genetic changes in cancer include changes in the genome sequence, amplifications and deletions. Chromosomal imbalance is a key feature of solid tumors as well as many other diseases.( 12 ) The characterization of changes in DNA copy number is important for both our basic understanding of cancer and for cancer diagnosis. Comparative genomic hybridization has been developed to investigate DNA copy number variations across an entire genome.( 13 ) However, comparative genomic hybridization has a limited (∼20 Mb) mapping solution, and fluorescence in situ hybridization and higher‐resolution techniques are laborious on a genomic scale. A high‐density SNP array covering >10 000 SNP was generated recently and has been used widely to examine the genome‐wide copy number profiles of some tumor tissues and cell lines.( 14 , 15 ) To examine the validity of DNA copy number as a predictive marker of drug sensitivity, we developed an analytical method to detect DNA copy number changes using the publicly available Affymetrix 10K SNP genotyping chip, which is useful for high‐resolution analyses of chromosomal aberrations.
In the present study, we explored genomic alterations that might be associated with drug‐resistance to four fluoropyrimidines, S‐1, UFT, capecitabine and 5′‐DFUR, using 27 human cancer xenografts, which are superior to in vitro experiments for the evaluation of prodrugs. We then carried out a correlation analysis between DNA copy number and drug sensitivity. Our results suggest that DNA copy number may be a useful marker of chemoresistance.
Materials and methods
Nude mice and human tumor xenografts. Four gastric carcinoma xenografts (SC‐2, ST‐40, 4–1ST and SC‐4), six colon carcinoma xenografts (KM12C, HCT‐15, KM20C, COL‐1, KM12C/FU and CO‐3), five breast carcinoma xenografts (MC‐5, H‐31, MC‐2, MDA‐MB‐435SHM and MDA‐MD‐231), seven lung carcinoma xenografts (GT3TKB, LC‐11, Lu‐99, LX‐1, LC‐6, Lu‐134 and Lu‐130), and five pancreatic carcinoma xenografts (MIAPaCa, PAN‐4, PAN‐12, H‐48 and BxPC‐3) were used in the present study. KM12C and KM20C were kindly provided by Dr Kiyoshi Morikawa of the National Cancer Institute (Tokyo, Japan). KM12C/FU was established in vivo. KM12C tumor fragments were implanted into nude mice, and 20 mg/kg 5‐FU was administered intravenously once a day. At 3 weeks after implantation, the tumors were removed, then implanted into other mice. This treatment was repeated 57 times to ensure resistance to 5‐FU.( 16 ) MDA‐MB‐435SHM was established from an in vivo xenograft.( 17 ) LX‐1 was kindly provided by Dr K. Inoue of the Cancer Chemotherapy Center (Tokyo, Japan). H‐31 and H‐48 were kindly provided by Dr Tetsuo Taguchi of the Research Institute for Microbial Diseases, Osaka University (Osaka, Japan). AZ‐521 and MDA‐MB‐231 were purchased from the Human Science Research Resource Bank (Osaka, Japan) and the American Tissue Culture Collection (Manassas, VA, USA), respectively. MIAPaCa, HCT‐15 and BxPc‐3 were purchased from Dainippon Pharmaceutical Co. (Tokyo, Japan). The other cell lines were provided by the Central Institute for Experimental Animals (Kawasaki, Japan). Male BALB/c‐nu/nµ nude mice (5 weeks old; weighing 18–20 g) were purchased from CLEA Japan (Tokyo, Japan). The mice were maintained under specific‐pathogen‐free conditions, and were provided with sterile food and water ad libitum. Each human tumor xenograft (2‐mm cubic fragment) or cultured cell line was implanted subcutaneously into nude mice.
Chemicals. Tegafur, gimeracil, oteracil and N4‐pentyloxycarbonyl‐5′‐deoxy‐5‐fluorocytidine (capecitabine) were synthesized in our laboratory. Uracil was purchased from Wako Pure Chemical Industries (Osaka, Japan). 5′‐DFUR was purchased from Nippon Roche (Tokyo, Japan). S‐1 was prepared by mixing tegafur, gimeracil and oteracil at a molar ratio of 1:0.4:1. UFT was prepared by mixing tegafur and uracil at a molar ratio of 1:4. All drugs were dissolved or suspended in 0.5% (w/v) hydroxypropylmethylcellulose solution. [6–14C]‐5‐FU (1.85 GBq/mmol) and [6–3H]‐FdUMP (625 GBq/mmol) were obtained from Moravek Biochemicals (Brea, CA, USA). All other reagents were commercially available and of the highest quality.
Examination of antitumor activity. When the estimated tumor volume (0.5 × length × width2) reached 100–300 mm3, the tumor‐bearing mice were allocated randomly to a test group (day 0, n = 5). UFT, S‐1, 5′‐DFUR and capecitabine were administered orally once a day from day 1 to day 14 (q.d.), as per the reported maximal tolerated dose.( 18 ) The relative tumor volume (RTV) was calculated on day 15 as follows: (tumor volume on day 15)/(tumor volume on day 0). The antitumor effect or inhibition rate (IR [%]) was calculated as follows: IR = (1 − mean RTV of drug‐treated group)/(mean RTV of untreated group) × 100. The tumor growth inhibition rate value on day 15 was regarded as representing the antitumor effect. All animal experiments were carried out in accordance with the Guidelines for the Welfare of Animals in Experimental Neoplasia.( 19 )
Quantification of DNA copy number. Quantitative real‐time polymerase chain reaction (PCR) was carried out using a PRISM 7900 sequence detector (Applied Biosystems, Foster City, CA, USA) and a QuantiTect SYBR Green kit (Qiagen, Valencia, CA, USA). DNA from each tumor was quantified by comparing the target locus to reference line‐1. The quantification of each copy number was based on a previously described method.( 20 ) Each primer sequence has been reported previously.( 20 , 21 ) To verify amplification specificity, the PCR products were examined using a dissociation curve and were analyzed by gel electrophoresis.
Quantification of mRNA expression. Total RNA in each homogenate was isolated using the RNeasy mini kit (Qiagen), as outlined by the manufacturer. After reverse transcription into cDNA using a High Capacity cDNA Archives Kit (Applied Biosystems), the mRNAs of TS and β‐actin, used as an internal reference gene, were determined using a fluorescence‐based real‐time detection method (ABI PRISM 7900). TaqMan Gene Expression Assays (Applied Biosystems), prevalidated assays that include specific primers and probes for each gene, were used for the cDNA quantitation of these genes (assay IDs: thymidylate synthase [TYMS], Hs00426591_m1; B‐actin [ACTB], Hs99999903_m1). For real‐time PCR, TaqMan Universal PCR Master Mix was used (Applied Biosystems). The PCR profile consisted of 2 min at 50°C, 10 min at 95°C, followed by 40 cycles of 30 s at 97°C and 1 min at 60°C in the ABI Prism 7900. The TaqMan analysis yielded values that were expressed as the ratio between two absolute measurements (TS/β‐actin).
TS protein content. The TS protein content was determined by measuring the level of [6–3H]‐FdUMP binding activity in the cytosol of tumor tissue homogenates, based on the method described by Spears and colleagues.( 22 )
XbaI 10K array hybridization. DNA was extracted from each xenograft using the QIAamp mini kit (Qiagen, Chatsworth, CA, USA), according to the manufacturer's instructions. The DNA yields and purity were determined spectrophotometrically by measuring the absorbance of aliquots at 260 and 280 nm. DNA from the xenografts was hybridized to GeneChip Mapping 10K 2.0 arrays (Affymetrix, Santa Clara, CA, USA) according to the manufacturer's instructions. In brief, 250 ng of genomic DNA was digested using the XbaI restriction enzyme, ligated to an adaptor, and amplified by PCR. The resulting amplicons were fragmented, labeled with biotinylated dideoxyATP using terminal deoxynucleotide transferase, and hybridized to the array. Hybridizations were detected using streptavidin–phycoerythin conjugates followed by array scanning. The signal intensity, determined using the GeneChip operating software, was analyzed using GeneChip DNA Analysis software.
Calculation of copy number. To determine the copy number by analyzing the intensity data obtained from the 10K array, we developed an algorithm based on the comparison of intensity values of the samples to reference DNA chip data. The Affymetrix CEL files contain the intensity values for each probe in the chip. To generate a probe set‐specific intensity value, the mean was calculated for each of 20 perfect match probes belonging to one probe set. For normalization, these mean intensities were then divided by the median intensity of all 10 204 mapped probe sets. CEL files of 145 normal DNA samples obtained from Affymetrix for the generation of normal reference data were used to build up a virtual reference, containing the median values of individual normalizations. To generate a DNA profile indicating the DNA copy number in relation to the genomic loci, each individual median‐centered value was divided by the corresponding virtual reference chip intensity. These normalized values were then logarithmically transformed (log2). Finally, the log2 values were ordered according to their genomic location. These data were processed properly and then loaded into GeneSpring software, version 7.2 (Agilent, Palo Alto, CA, USA). A total of 10 032 SNP, excluding 172 SNP with unclear loci, were used for further analysis. All SNP were categorized according to the cytogenetic bands of defined physical positions on the chromosomes.
Correlation analysis between DNA copy number and drug sensitivity. To ascertain that the range of each DNA copy number was sufficient for subsequent analysis, we calculated the entropy, H, using the following formula:
 |
where p(x) is the probability that a value was within decile x of that DNA copy number. SNP whose entropy values were within the lowest 10% were dropped from further analysis. Finally, we selected 9029 SNP for subsequent analysis. To investigate the correlation between genomic alteration and drug sensitivity, we calculated the Pearson correlation coefficients according to the following formula:
 |
where x k represents the log‐transformed DNA copy number of probe set x in the xenograft k, y k is the sensitivity to drug y in the xenograft k, and x mean represents the mean copy number. For this analysis we selected SNP with a significant negative correlation (P < 0.05).
SNP showing a significant negative correlation with antitumor activity were subsequently analyzed using the BioScript Library tool of GeneSpring software. This program calculated the statistical significance of non‐random representation at each chromosome and cytogenetic band. The overlapping P‐value for whether the extracted SNP are significantly located in which chromosomes or cytogenetic band can be calculated using the standard Fisher's exact test and the following formula:
 |
where k is the number of extracted SNP, G is the total number of all SNP, and n and A are the numbers of extracted SNP and all SNP located on each chromosome or cytogenetic band, respectively.
Results
Comparison of DNA copy number detected by 10K array and real‐time PCR. To detect genomic aberrations by analysis of data obtained from the 10K Mapping array, we developed and tested an algorithm based on the comparison of intensity values from the experiment chip and the virtual reference (see Material and Methods). To test the performance of our algorithm for calculating DNA copy number, we examined the copy number of the genes MYC, CDKN2A and ERBB2, for which genomic alterations are well known. It has been reported that the MYC oncogene at chromosome 8q24 and ERBB2 at chromosome 17q12 are commonly amplified, whereas the CDKN2A tumor suppressor on chromosome 9p21 is deleted in a variety of tumor types.( 23 , 24 , 25 ) We examined the normalized values, corresponding to the DNA copy number of its locus. The DNA copy number profiles of three typical xenografts with genomic alterations in these gene‐coding regions are shown in Fig. 1. A genome‐wide view reveals a variety of large regions and several regions of high copy number amplification or deletion. The MYC region on 8q24.21 covers nine adjacent SNP loci, confirming that an area with a minimum size of 1.6 MB was amplified in SC‐2. A prominent deletion of 9p21.2–21.3 encompassing the CDKN2A locus was detected in Lu99, whereas St‐40 was the only human cancer xenograft in which ERBB2 was amplified. To confirm the copy numbers calculated by the 10K array data, we examined the copy number of these genes by quantitative real‐time PCR. As shown in Table 1, the copy number data obtained using the 10K array was highly correlated with that measured by real‐time PCR (P < 0.001).
Figure 1.
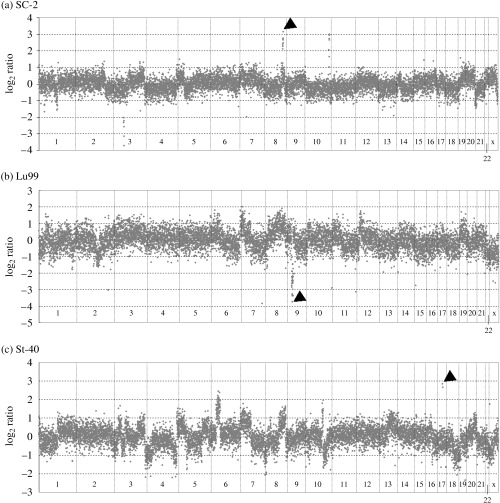
DNA copy number profiles for SC‐2, Lu99 and St‐40 human xenografts. The diagram shows the log2 values of the ratios of the DNA copy numbers with respect to their genomic order from 1pter (left) to Xqter (right) for (a) SC‐2, (b) Lu99 and (c) St‐40, based on their physical positions. The log2 ratio of 0 represents two copies. These copy numbers were calculated using virtual reference data (see Materials and methods), and 0 on the y‐axis represents two copies, which is the normal number of copies for autosomal genes. The aberrant loci indicated by the arrows are located in (a) MYC, (b) CDKN2A and (c) ERBB2. Chromosomal boundaries are displayed as vertical lines.
Table 1.
Correlation of copy numbers measured by 10K array and real‐time polymerase chain reaction
| Gene | r | P‐value |
|---|---|---|
| CDKN2A | 0.9267 | <0.001 |
| ERBB2 | 0.7237 | <0.001 |
| MYC | 0.9407 | <0.001 |
r, Pearson correlation coefficient.
Correlations between copy number and antitumor activity. To screen for loci that may be associated with drug resistance against fluoropyrimidines, we carried out a correlation analysis between drug sensitivity and the normalized intensity of each probe set, corresponding to the DNA copy number, in 27 xenografts. As a result, various SNP with copy number profiles that exhibited a significant negative correlation with sensitivity to each drug were extracted (see Table 2). We next selected 202 SNP whose copy numbers were negatively correlated with more than three 5‐FU‐based drugs. Then, we evaluated the overlap between the SNP associated with antitumor activity and their chromosome or cytogenetic band positions using the standard Fisher's exact test (see Materials and methods). As shown in Table 3, SNP associated with drug sensitivity were significantly located on chromosomes 18, 17 and 11. To specify the candidate regions further, we carried out an additional analysis of these chromosomes and identified candidate SNP located in specific cytogenetic regions (Table 3). There are some genes in these significant cytogenetic regions (P < 1.0 × 10⁻³), and we found that TYMS was coded in 18p11.32, which showed a strong significance (P = 4.63 × 10⁻²⁶; Table 3). We then examined the correlation between TYMS copy number and TYMS mRNA level versus drug sensitivity (Table 4). Both TYMS mRNA level and TYMS copy number exhibited broad negative correlations with antitumor activity against 5‐FU‐based drugs.
Table 2.
Number of single nucleotide polymorphism (SNP) with a significant negative correlation to antitumor activity in response to 5‐fluorouracil (5‐FU)‐based drugs
| Drugs | No. SNP |
|---|---|
| UFT | 414 |
| S‐1 | 447 |
| Capecitabine | 357 |
| 5′‐DFUR | 383 |
A correlation analysis between 9029 SNP and the antitumor activity of 5‐FU‐based drugs was carried out across 27 xenografts to screen for loci associated with drug sensitivity. SNP with a significant correlation were selected based on the following criterion: P < 0.05.
Table 3.
Candidate loci associated with antitumor activity in response to 5‐fluorouracil (5‐FU)‐based drugs
| Chromosome | No. SNP † | P‐value ‡ |
|---|---|---|
| All chromosomes | ||
| 18 | 70 | 5.96 × 10−57 |
| 17 | 14 | 5.17 × 10⁻⁶ |
| 11 | 26 | 2.98 × 10⁻⁵ |
| 15 | 11 | 0.025 |
| 6 | 18 | 0.145 |
| 7 | 13 | 0.219 |
| 14 | 8 | 0.405 |
| 5 | 14 | 0.510 |
| 1 | 13 | 0.766 |
| 20 | 3 | 0.772 |
| 19 | 1 | 0.951 |
| 21 | 1 | 0.964 |
| 10 | 1 | 1 |
| 12 | 1 | 1 |
| 13 | 0 | 1 |
| 16 | 0 | 1 |
| 2 | 2 | 1 |
| 22 | 0 | 1 |
| 3 | 2 | 1 |
| 4 | 0 | 1 |
| 8 | 1 | 1 |
| 9 | 0 | 1 |
| X | 0 | 1 |
| Chromosome 18 | ||
| 18p11.31 | 23 | 1.90 × 10−40 |
| 18p11.32 | 16 | 4.63 × 10⁻²⁶ |
| 18p11.21 | 10 | 7.53 × 10⁻¹⁸ |
| 18p11.22 | 8 | 1.84 × 10⁻¹³ |
| 18p11.23 | 8 | 9.07 × 10⁻¹³ |
| 18q12.2 | 2 | 0.026 |
| 18q22.1 | 1 | 0.357 |
| 18q12.3 | 1 | 0.463 |
| 18q12.1 | 1 | 0.543 |
| 18q11.2 | 0 | 1 |
| 18q21.1 | 0 | 1 |
| 18q21.2 | 0 | 1 |
| 18q21.31 | 0 | 1 |
| 18q21.32 | 0 | 1 |
| 18q21.33 | 0 | 1 |
| 18q22.2 | 0 | 1 |
| 18q22.3 | 0 | 1 |
| 18q23 | 0 | 1 |
| Chromosome 17 | ||
| 17p13.2 | 5 | 1.68 × 10⁻⁷ |
| 17p12 | 7 | 1.64 × 10⁻⁶ |
| 17p13.1 | 1 | 0.201 |
| 17q24.3 | 1 | 0.293 |
| 17p11.2 | 0 | 1 |
| 17q11.1 | 0 | 1 |
| 17q11.2 | 0 | 1 |
| 17q12 | 0 | 1 |
| 17q21.2 | 0 | 1 |
| 17q21.31 | 0 | 1 |
| 17q21.32 | 0 | 1 |
| 17q21.33 | 0 | 1 |
| 17q22 | 0 | 1 |
| 17q23.2 | 0 | 1 |
| 17q23.3 | 0 | 1 |
| 17q24.1 | 0 | 1 |
| 17q24.2 | 0 | 1 |
| 17q25.1 | 0 | 1 |
| 17q25.3 | 0 | 1 |
| Chromosome 11 | ||
| 11q14.1 | 7 | 2.87 × 10⁻⁵ |
| 11q11 | 4 | 3.05 × 10⁻⁵ |
| 11p11.12 | 3 | 1.55 × 10⁻³ |
| 11q14.2 | 2 | 0.045 |
| 11q12.3 | 1 | 0.097 |
| 11q13.4 | 1 | 0.115 |
| 11q12.2 | 1 | 0.133 |
| 11p15.2 | 1 | 0.232 |
| 11q12.1 | 1 | 0.232 |
| 11q21 | 1 | 0.232 |
| 11q14.3 | 1 | 0.248 |
| 11q23.1 | 1 | 0.293 |
| 11q25 | 1 | 0.399 |
| 11q22.1 | 1 | 0.500 |
| 11p11.2 | 0 | 1 |
| 11p12 | 0 | 1 |
| 11p13 | 0 | 1 |
| 11p14.1 | 0 | 1 |
| 11p14.2 | 0 | 1 |
The results of statistical tests concerning the overlap between the locus of SNP correlated with drug sensitivity and all chromosomes, chromosome 18, chromosome 17 and chromosome 11 are shown. †Number of candidate SNP located on each chromosome or cytogenetic band. ‡Overlapped P‐value calculated, based on the redundancy in each candidate SNP on a chromosome or cytogenetic band. The calculation method is described in Materials and Methods.
Table 4.
Comparison of correlations between thymidylate synthase gene (TYMS) copy number, mRNA level and drug sensitivity
| Drug | Copy number/mRNA | r | P‐value |
|---|---|---|---|
| UFT | vs TYMS copy number | −0.591 | 0.001 |
| S‐1 | −0.369 | 0.058 | |
| Capecitabine | −0.538 | 0.004 | |
| 5′‐DFUR | −0.620 | <0.001 | |
| UFT | vs TYMS mRNA | −0.530 | 0.004 |
| S‐1 | −0.374 | 0.055 | |
| Capecitabine | −0.627 | <0.001 | |
| 5′‐DFUR | −0.669 | <0.001 |
r, Pearson correlation coefficient.
Verification of TYMS copy number. The TYMS copy number detected using the 10K array was validated using quantitative real‐time PCR. As shown in Fig. 2a, the copy number data obtained using the 10K array was significantly correlated with that determined by real‐time PCR. Furthermore, we examined the TYMS mRNA expression level and the TS protein level. As shown in Fig. 2b,c, TYMS copy number was significantly correlated with both TYMS mRNA level and TS protein level.
Figure 2.
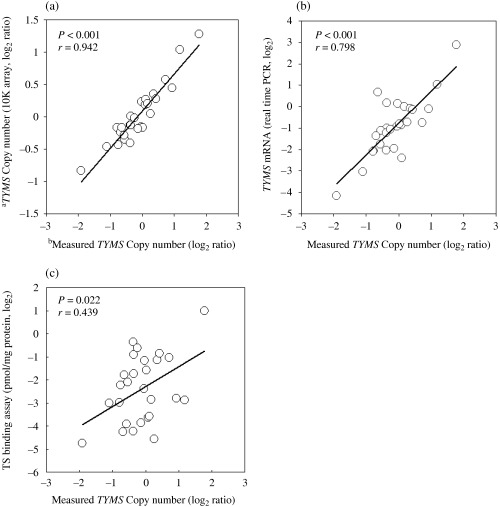
Validation of thymidylate synthase gene (TYMS) copy number. Correlations between TYMS copy number measured by real‐time polymerase chain reaction and inferred by (a) 10K array, (b) TYMS mRNA level and (c) thymidylate synthase protein level. Pearson correlation coefficients, r, and P‐values are shown. alog2 ratio of TYMS copy number inferred by 10K array. bMeasured by quantitative real‐time PCR with reference to Line‐1 control. The log2 ratio of 0 for copy number represents two copies.
Discussion
Changes in DNA copy number frequently cause oncogene activation and drug resistance. Gene amplification is one of the most common mechanisms of overexpression in cancer cells. Here, we showed that a 10K array was capable of detecting genomic aberrations, such as amplifications or deletions, and that the copy numbers of specific loci were associated with antitumor activity in response to treatment with 5‐FU‐based drugs.
The 10K array was initially designed for the genome‐wide examination of a SNP; hence, the software provided with the array for data analysis is not readily suited to the detection of allelic imbalance. To overcome this problem, we developed an algorithm to estimate the copy number of a given gene, and detected small and locally confined genomic aberrations. To examine the reliability of the copy numbers calculated in this manner, we validated the copy number of some genes by real‐time PCR and found that these agreed well with those calculated using the 10K array. These results suggest that copy numbers calculated using the signal intensity of each probe set on 10K arrays can be used for further analysis. The merit of our algorithm is that we could predict the DNA copy number without a reference sample. Generally, the conventional method for prediction of copy number needs a reference, such as normal tissues or normal cells. However, in both in vitro and in vivo experiments it is difficult to use paired samples of both tumor cells and normal cells for measurement of DNA copy number, with the exception of paired parental and drug‐resistant cell lines. In our experiment, we calculate the DNA copy number in tumor tissues using the median signal intensity from 145 normal DNA samples as virtual references, and didn't need a paired sample (see Material and Methods). Furthermore, in the results of the global correlation analysis, we were able to screen efficiently the loci associated with drug sensitivity by applying Fisher's exact test.
We carried out a correlation analysis between copy number and drug sensitivity to screen for loci influencing drug resistance. In a recent report, DNA copy numbers were analyzed as integral numbers estimated using the hidden Markov model.( 20 ) In the present study, however, we analyzed the copy number not as an integral number but as a real number. Tumor tissue is very heterogeneous and contains various cells with various genomic alterations. We therefore believe that the real number reflects the actual copy number in tumor tissues, and is more suitable for further analysis because the real number represents the average of various copy numbers in different cells. The results of the correlation analysis suggested that the copy number of TYMS (18p11.32) showed a strong correlation with drug resistance (Table 3). Change in the copy number of TYMS was also reflected in the level of TYMS expression (Fig. 2), and showed a broad negative correlation with 5‐FU‐based drug sensitivity (Table 4). TS is a key enzyme in folate metabolism that catalyzes the conversion of dUMP to dTMP for the provision of thymidine, a rate‐limiting nucleotide essential for DNA synthesis and repair, and is also a primary target of several chemotherapeutic agents, including 5‐FU. TYMS is one of the most well‐known markers for 5‐FU sensitivity. TYMS amplification has been observed in tumors after treatment with 5‐FU in vitro. ( 26 , 27 ) A similar result was seen in our study between KM12C and KM12C/FU, which were the only paired xenografts comprising parental and drug‐resistant tumors in our experiment (data not shown). In addition, TYMS amplification was found exclusively in cancer lesions of patients who had been treated with 5‐FU.( 28 ) These results suggest that this genomic alteration is associated with acquired resistance to fluoropyrimidines. Although there are some reports about the association between TS expression in tumors before 5‐FU treatment and response to fluoropyrimidines, these experiments have focused not on copy number but on TS protein or mRNA levels in tumor tissues.( 29 , 30 ) These results suggest that amplification of the TYMS gene is associated with not only acquired resistance, but also innate resistance, supporting the possibility that TYMS copy number might be a predictive marker of drug sensitivity to fluoropyrimidines.
Recently Brody et al. reported results similar to ours, and their data suggest that the copy number of TYMS may affect 5‐FU responsiveness.( 31 ) They demonstrated that artificially constructed syngeneic cell lines mimicking the TYMS genotype affect 5‐FU sensitivity in vitro. These results are very interesting and agree with our result. However, they are concerned with these results may prove to be methodologically difficult in discussion because copy number is not uniform among the cells in tumor tissues. As for this point, we analyzed the copy number not as an integral number but as a real number. As a result of this analysis, we certified the association between genomic alteration of the TYMS locus and antitumor activity in the xenograft model. That is to say that we think that our results and those of Brody et al. are complemented mutually. Further clinical data, which show frequency of genomic alteration and association with responsiveness to 5‐FU‐based drugs, are necessary to confirm our finding, and these studies are now ongoing.
The SNP showing significant associations with drug sensitivity were concentrated in some cytogenetic regions (18p, 17p13.2, 17p12, 11q14.1, 11q11 and 11p11.12), and we identified genes other than TYMS that have been associated with chemosensitivity. Transforming growth factor‐induced factor (TGIF) on 18p11.31 is a transcriptional corepressor that interacts with SMAD to negatively regulate the transforming growth factor β1 (TGFβ1)–SMAD response in cells.( 32 ) TGFβ1 is a 25‐kDa polypeptide that is involved in the regulation of many tissues, cells and organ functions, and enhances the lethal effect of DNA‐damaging agents including 5‐FU.( 33 ) The TGFβ1/bone morphogenetic protein signaling pathway is not only required for cytokine signaling, but may also be an important factor for 5‐FU‐mediated apoptosis.( 34 ) Midkine (MDK), located on chromosome 11p11.2, is a heparin‐binding growth factor that has been associated with the development of cancer,( 35 ) and was consistently overexpressed in 5‐FU‐resistant cells compared with their parent cells.( 36 ) Recently, it was reported that when cancer cells that normally do not express MDK were transfected with an MDK expression construct, they become resistant to some drugs including 5‐FU.( 37 ) In addition, small interfering RNA‐mediated knockdown of endogeneous MDK expression could sensitize cells to 5‐FU.( 37 ) These results may indicate that blockade of MDK expression in cancer could be a future strategy for cancer therapeutics. Genes other than those described here have been reported to be associated with drug sensitivity, and further study is necessary to clarify the individual and cooperative functional roles of these genes against chemosensitivity. A validation study for some of these genes is underway.
The ability to predict tumor response based on DNA copy number is important for several reasons. First, DNA is more stable than RNA and is less susceptible to degradation. Second, copy numbers may be more suitable for setting a cut‐off value to predict drug response, as the copy number is an absolute value corresponding to the number of chromosomes whereas mRNA expression is expressed as a value relative to the expression of a housekeeping gene. In clinical practice, not only real‐time PCR (which we used in this study) but also fluorescence in situ hybridization analysis in formalin‐fixed paraffin‐embedded tissue samples might be suitable for detecting the copy number. The practicality of using DNA copy numbers or the gene expression of TYMS as predictive markers of drug sensitivity needs to be evaluated in the near future. Although the levels of protein and RNA expression can provide clues to causal events, gene expression is difficult to measure accurately for technical reasons and may be affected by complex regulation in each tumor's environment. In contrast, we believe that genetic alterations can provide useful information because we can measure the copy number of focused cytogenetic regions, not relative values.
In conclusion, we developed a novel screening method that combines DNA copy numbers with chromosomal information to identify drug‐resistant genes. This promising screening method can be applied to a variety of drugs. In the present study, we suggest that TYMS copy number may be a predictive marker of sensitivity to 5‐FU‐based drugs, and further study is necessary to clarify the functional roles of other genes coded in significant cytogenetic regions. These results provide comprehensive genetic information on drug sensitivity and may serve as the foundation for subsequent functional studies. The results may also enhance the prediction of tumor response to anticancer drugs and contribute to the development of tailor‐made chemotherapy.
References
- 1. Ross DT, Scherf U, Eisen MBC et al. Systematic variation in gene expression patterns in human cancer cell lines. Nat Genet 2000; 24: 227–35. [DOI] [PubMed] [Google Scholar]
- 2. Scherf U, Ross DT, Waltham M et al. A gene expression database for the molecular pharmacology of cancer. Nat Genet 2000; 24: 236–44. [DOI] [PubMed] [Google Scholar]
- 3. Staunton JE, Slonim DK, Coller HA et al. Chemosensitivity prediction by transcriptional profiling. Proc Natl Acad Sci USA 2001; 98: 10 787–92. [DOI] [PMC free article] [PubMed] [Google Scholar]
- 4. Zembutsu H, Ohnishi Y, Tsunoda T et al. Genome‐wide cDNA microarray screening to correlate gene expression profiles with sensitivity of 85 human cancer xenografts to anticancer drugs. Cancer Res 2002; 62: 518–27. [PubMed] [Google Scholar]
- 5. Dan S, Tsunoda T, Kitahara O et al. An integrated database of chemosensitivity to 55 anticancer drugs and gene expression profiles of 39 human cancer cell lines. Cancer Res 2002; 62: 1139–47. [PubMed] [Google Scholar]
- 6. Takechi T, Okabe H, Ikeda K et al. Correlations between antitumor activities of fluoropyrimidines and DPD activity in lung tumor xenografts. Oncol Report 2005; 14: 33–9. [PubMed] [Google Scholar]
- 7. Ooyama A, Takechi T, Toda E et al. Gene expression analysis using human cancer xenografts to identify novel predictive marker genes for the efficacy of 5‐fluorouracil‐based drugs. Cancer Sci 2006; 97: 510–22. [DOI] [PMC free article] [PubMed] [Google Scholar]
- 8. Malet‐Martino M, Martino R. Clinical studies of three oral prodrugs of 5‐fluorouracil (capecitabine, UFT, S‐1): a review. Oncologist 2002; 7: 288–323. [DOI] [PubMed] [Google Scholar]
- 9. Fukushima M, Shimamoto Y, Kato T et al. Anticancer activity and toxicity of S‐1, an oral combination of tegafur and two biochemical modulators, compared with continuous i.v. infusion of 5‐fluorouracil. Anticancer Drugs 1998; 9: 817–23. [DOI] [PubMed] [Google Scholar]
- 10. Langenbach RJ, Danenberg PV, Heidelberger C. Thymidylate synthetase: mechanism of inhibition by 5‐fluoro‐2′‐deoxyuridylate. Biochem Biophys Res Commun 1972; 6: 1565–71. [DOI] [PubMed] [Google Scholar]
- 11. Takechi T, Koizumi K, Tsujimoto H, Fukushima M. Screening of differentially expressed genes in 5‐fluorouracil‐resistant human gastrointestinal tumor cells. Jpn J Cancer Res 2001; 92: 696–703. [DOI] [PMC free article] [PubMed] [Google Scholar]
- 12. Charames GS, Bapat B. Genomic instability and cancer. Curr Mol Med 2003; 3: 589–96. [DOI] [PubMed] [Google Scholar]
- 13. Kallioniemi A, Kallioniemi OP, Sudar D et al. Comparative genomic hybridization for molecular cytogenetic analysis of solid tumors. Science 1992; 258: 818–21. [DOI] [PubMed] [Google Scholar]
- 14. Gaasenbeek M, Howarth K, Rowan AJ et al. Combined array‐comparative genomic hybridization and single‐nucleotide polymorphism‐loss of heterozygosity analysis reveals complex changes and multiple forms of chromosomal instability in colorectal cancers. Cancer Res 2006; 7: 3471–9. [DOI] [PubMed] [Google Scholar]
- 15. Janne PA, Li C, Zhao X et al. High‐resolution single‐nucleotide polymorphism array and clustering analysis of loss of heterozygosity in human lung cancer cell lines. Oncogene 2004; 15: 2716–26. [DOI] [PubMed] [Google Scholar]
- 16. Fukushima M, Fujioka A, Uchida J, Nakagawa F, Takechi T. Thymidylate synthase (TS) and ribonucleotide reductase (RNR) may be involved in acquired resistance to 5‐fluorouracil (5‐FU) in human cancer xenografts in vivo . Eur J Cancer 2001; 37: 1681–7. [DOI] [PubMed] [Google Scholar]
- 17. Nukatsuka M, Fujioka A, Nakagawa F et al. Antimetastatic and anticancer activity of S‐1, a new oral dihydropyrimidine‐dehydrogenase‐inhibiting fluoropyrimidine, alone and in combination with paclitaxel in an orthotopically implanted human breast cancer model. Int J Oncol 2004; 25: 1531–6. [PubMed] [Google Scholar]
- 18. Takechi T, Okabe H, Ikeda K et al. Correlations between antitumor activities of fluoropyrimidines and DPD activity in lung tumor xenografts. Oncol Rep 2005; 14: 33–9. [PubMed] [Google Scholar]
- 19. UKCCCR Guidelines. United Kingdom Co‐Ordinating Committee on Cancer Research (UKCCCR) Guidelines for the Welfare of Animals in Experimental Neoplasia ( 2nd edn). Br J Cancer 1998; 77: 1–10. [DOI] [PMC free article] [PubMed] [Google Scholar]
- 20. Zhao X, Li C, Paez JG et al. An integrated view of copy number and allelic alterations in the cancer genome using single nucleotide polymorphism arrays. Cancer Res 2004; 64: 3060–71. [DOI] [PubMed] [Google Scholar]
- 21. Ulrich CM, Bigler J, Velicer CM, Greene EA, Farin FM, Potter JD. Searching expressed sequence tag databases: discovery and confirmation of a common polymorphism in the thymidylate synthase gene. Cancer Epidemiol Biomarkers Prev 2000; 9: 1381–5. [PubMed] [Google Scholar]
- 22. Spears CP, Shahinian AH, Moran RG, Heidelberger C, Corbett TH. In vivo kinetics of thymidylate synthetase inhibition of 5‐fluorouracil‐sensitive and ‐resistant murine colon adenocarcinomas. Cancer Res 1982; 42: 450–6. [PubMed] [Google Scholar]
- 23. Mitra AB, Murty VV, Pratap M, Sodhani P, Chaganti RS. ERBB2 (HER2/neu) oncogene is frequently amplified in squamous cell carcinoma of the uterine cervix. Cancer Res 1994; 54: 637–9. [PubMed] [Google Scholar]
- 24. Escot C, Theillet C, Lidereau R et al. Genetic alteration of the c‐myc protooncogene (MYC) in human primary breast carcinomas. Proc Natl Acad Sci USA 1986; 83: 4834–8. [DOI] [PMC free article] [PubMed] [Google Scholar]
- 25. Cairns P, Polascik TJ, Eby Y et al. Frequency of homozygous deletion at p16/CDKN2 in primary human tumours. Nat Genet 1995; 11: 210–12. [DOI] [PubMed] [Google Scholar]
- 26. Hidaka S, Yasutake T, Fukushima M et al. Chromosomal imbalances associated with acquired resistance to fluoropyrimidines in human colorectal cancer cells. Eur J Cancer 2003; 39: 975–80. [DOI] [PubMed] [Google Scholar]
- 27. Wang W, Marsh S, Cassidy J, McLeod HL. Pharmacogenomic dissection of resistance to thymidylate synthase inhibitors. Cancer Res 2001; 61: 5505–10. [PubMed] [Google Scholar]
- 28. Wang TL, Diaz LA Jr, Romans K et al. Digital karyotyping identifies thymidylate synthase amplification as a mechanism of resistance to 5‐fluorouracil in metastatic colorectal cancer patients. Proc Natl Acad Sci USA 2004; 101: 3089–94. [DOI] [PMC free article] [PubMed] [Google Scholar]
- 29. Johnston PG, Lenz HJ, Leichman CG et al. Thymidylate synthase gene and protein expression correlate and are associated with response to 5‐fluorouracil in human colorectal and gastric tumors. Cancer Res 1995; 55: 1407–12. [PubMed] [Google Scholar]
- 30. Lenz HJ, Hayashi K, Salonga D et al. p53 point mutations and thymidylate synthase messenger RNA levels in disseminated colorectal cancer: an analysis of response and survival. Clin Cancer Res 1998; 4: 1243–50. [PubMed] [Google Scholar]
- 31. Brody JR, Hucl T, Gallmeier E, Winter JM, Kern SE, Murphy KM. Genomic copy number changes affecting the thymidylate synthase (TYMS) gene in cancer: a model for patient classification to aid fluoropyrimidine therapy. Cancer Res 2006; 19: 9369–73. [DOI] [PubMed] [Google Scholar]
- 32. Wotton D, Lo RS, Lee S, Massague J. A Smad transcriptional corepressor. Cell 1999; 1: 29–39. [DOI] [PubMed] [Google Scholar]
- 33. Raynal S, Nocentini S, Croisy A, Lawrence DA, Jullien P. Transforming growth factor‐β1 enhances the lethal effects of DNA‐damaging agents in a human lung‐cancer cell line. Int J Cancer 1997; 2: 356–61. [DOI] [PubMed] [Google Scholar]
- 34. Alhopuro P, Alazzouzi H, Sammalkorpi H et al. SMAD4 levels and response to 5‐fluorouracil in colorectal cancer. Clin Cancer Res 2005; 17: 6311–16. [DOI] [PubMed] [Google Scholar]
- 35. Muramatsu T. Midkine and pleiotrophin: two related proteins involved in development, survival, inflammation and tumorigenesis. J Biochem (Tokyo) 2002; 3: 359–71. [DOI] [PubMed] [Google Scholar]
- 36. Kang HC, Kim IJ, Park JH et al. Identification of genes with differential expression in acquired drug‐resistant gastric cancer cells using high‐density oligonucleotide microarrays. Clin Cancer Res 2004; 10: 272–84. [DOI] [PubMed] [Google Scholar]
- 37. Kang HC, Kim IJ, Park JH et al. Regulation of MDK expression in human cancer cells modulates sensitivities to various anticancer drugs: MDK overexpression confers to a multi‐drug resistance. Cancer Lett 2007; 1: 40–7. [DOI] [PubMed] [Google Scholar]