

Abstract
To predict the efficacy of the M‐VAC neoadjuvant chemotherapy for invasive bladder cancers, we previously established the method to calculate the prediction score on the basis of expression profiles of 14 predictive genes. This scoring system had clearly distinguished the responder group from the non‐responder group. To further validate the clinical significance of the system, we applied it to 22 additional cases of bladder cancer patients and found that the scoring system correctly predicted clinical response for 19 of the 22 test cases. The group of patients with positive predictive scores had significantly longer survival than that with negative scores. When we compared our results with a previous report describing the prognosis of the patients with cystectomy alone, the results imply that patients with positive scores are likely to benefit from M‐VAC neoadjuvant chemotherapy, but that the chemotherapy would shorten the lives of patients with negative scores. We are confident that our prediction system to M‐VAC therapy should provide opportunities for achieving better prognosis and improving the quality of life of patients. Taken together, our data suggest that the goal of ‘personalized medicine’, prescribing the appropriate treatment regimen for each patient, may be achievable by selecting specific sets of genes for their predictive values according to the approach shown here. (Cancer Sci 2007; 98: 113–117)
Bladdercancer is the second most common genitourinary tumor. There were approximately 357 000 new cases each year worldwide; approximately one‐third of them are likely to be an invasive or a metastatic disease at the time of diagnosis.( 1 , 2 , 3 ) Radical cystectomy is the standard treatment for patients with muscle‐invasive bladder cancer, but the 5‐year survival rate by surgery alone is approximately 50%.( 4 ) Failure to cure is due to the presence of circulated or metastatic cancer cells at the time of operation, indicating a need for eradication of micrometastasis with systemic treatment for improvement of the patients’ prognosis.
Neoadjuvant chemotherapy is usually applied to patients with muscle‐invasive bladder cancer for management of micrometastases to improve their prognosis.( 5 , 6 ) The M‐VAC regimen, a combination of methotrexate, vinblastine, doxorubicin, and cisplatin, prior to radical cystectomy has been shown to improve the prognosis of patients, compared with cystectomy alone.( 7 ) In some clinical trials, down‐staging with drugs before surgical operation was indicated to have significant survival benefits;( 8 , 9 ) moreover, patients who respond to neoadjuvant chemotherapy very well may preserve bladder function and have better quality of life. However, because no method is yet available for predicting the response of an individual patient to chemotherapies such as M‐VAC, a subset of patients suffer from adverse reactions to the drugs without having any benefit. In the worst case, some of these patients lose the opportunity to have additional therapy when their physical condition becomes very serious.
As described above, there is no consideration in present clinical practice of the response to chemotherapy in individual patients. Hence, development of a reliable method to predict the effectiveness of a specific therapy is of critical importance for patients with bladder cancer. cDNA microarray analysis that can enable us to perform high‐throughput quantification of the expression levels of thousands of genes is expected to provide useful information for characterizing the nature of individual cancers and for then identifying some clues to distinguish those tumors showing good response to certain chemotherapy from those showing poor response.
In line with this idea, we previously performed gene expression profile analysis for invasive bladder cancers using cDNA microarray consisting of approximately 28 000 genes and identified 50 genes that were expressed significantly differently between the responder and non‐responder group of the patients treated with M‐VAC neoadjuvant chemotherapy.( 10 ) Among those genes we finally selected 14 ‘predictive’ genes that showed the most significant differences between the two groups and established a numerical prediction scoring system on the basis of expression levels of the 14 genes. This numerical system clearly separated the responder group from the non‐responder group. Furthermore, because quantitative reverse transcription‐PCR (RT‐PCR) data were highly concordant with the cDNA microarray data for those 14 genes, we also developed a quantitative RT‐PCR‐based prediction system that could be feasible for routine clinical use. This quantitative RT‐PCR‐based prediction system also clearly separated the responder group from the non‐responder group.( 10 )
Since the validation of this prediction system using additional test cases is essential and critical for further clinical application, we here further evaluated the prediction system to M‐VAC neoadjuvant chemotherapy using additional test cases. Moreover, we found correlation of the prediction scores calculated by this system with the prognosis of the patient groups. The additional validation suggests that our prediction system for M‐VAC therapy should provide opportunities for achieving better selection of treatment and for improving quality of life (QOL) and prognosis of patients.
Materials and Methods
Patients and tissue samples. Tissue samples and their corresponding clinical information were obtained with written informed consent at five hospitals participating in this study (Kochi Medical School, Kyoto Prefectural University of Medicine, Nagoya City University Graduate School of Medical Sciences, Kanazawa University Graduate School of Medical Sciences, and Iwate Medical University). We obtained 22 additional cases that had been diagnosed histologically as transitional cell carcinoma of the bladder (six female and 16 males mean age 66.7 years in a range of 58–75 years; Table 1). In total, 40 cases were enrolled in our study. Clinical stage was determined according to the UICC TNM classification; we enrolled only the cases without node metastasis, T2aN0M0–T3bN0M0, who were expected to undergo radical cystectomy without prior radiation therapy. From each patient, three to five pieces of cancer tissue were taken at the time of diagnostic biopsy. These samples were immediately embedded, frozen, and stored at −80°C until use.
Table 1.
Clinicopathological features of 22 bladder cancer patients examined as test cases
| ID | Sex | Age | Stage | Grade | Response | Post treatment |
|---|---|---|---|---|---|---|
| BC01026 | M | 58 | T3b | G3 | Responder (CR) | Radiation |
| BC01028 | M | 69 | T3a | G2 | Responder (CR) | Cystectomy |
| BC01029 | F | 67 | T3a | G3 | Responder | TUR‐Bt |
| BC01031 | M | 74 | T3b | G2 | Responder | Cystectomy |
| BC01033 | F | 68 | T3b | G2 | Responder | Cystectony |
| BC01011 | M | 64 | T3b | G2 > G3 | Non‐responder | Cystectomy |
| BC01027 | M | 72 | T2b | G2 | Non‐responder | Cystectomy |
| BC01032 | F | 64 | T3b | G3 >> G2 | Non‐responder | Radiation |
| BC05002 | M | 60 | T3b | G2 | Non‐responder | Radiation |
| BC01034 | M | 60 | T2b | G2 | Responder (CR) | Cystectomy |
| BC01035 | M | 62 | T3b | G1 > G2 | Responder | Cystectomy |
| BC01036 | M | 73 | T3b | G3 | Non‐responder | MVACx4 |
| BC01039 | M | 75 | T3b | G1 = G2 | Non‐responder | Radiation |
| BC01041 | M | 59 | T2b | G1 = G2 | Responder | Cystectomy |
| BC01043 | M | 69 | T3b | G2 | Non‐responder | Radiaton |
| BC01044 | F | 68 | T3b | G3 | Responder | Radiaton |
| BC01045 | M | 73 | T3a | G3 > G2 | Non‐responder | MVACx3 |
| BC01046 | M | 60 | T3b | G2 | Responder | MVACx3, Cystectomy |
| BC01047 | F | 65 | T3b | G2 > G3 | Non‐responder | MVACx3, Cystectomy |
| BC01050 | F | 65 | T3b | G2 | Non‐responder | MVACx3, Cystectomy |
| BC01055 | M | 74 | T3b | G2 > G1 | Non‐responder | MVACx3, Radiation |
| BC04004 | M | 69 | T2 | G2 | Non‐responder | Cystectomy |
CR, complete response(pT0); F, female; M, male; Non‐responder, patient who could not archive downstaging (>pT1 or >T1) after two courses of treatment; Response, response to neoadjuvant M‐VAC treatment; Responder, patient who archived downstaging (≤pT1 or ≤T1) after two courses of treatment; Test, samples used for test cases; TUR‐Bt, transurethral resection of the bladder tumor.
All patients were examined using chest X‐ray, computed tomography (CT) and magnetic resonance imaging (MRI) of their abdomen and pelvis, and confirmed to have neither lymph node nor distant metastases. Patients were given two 28‐day cycles of M‐VAC neoadjuvant chemotherapy, as follows: methotrexate (30 mg per square meter of body‐surface area) on days 1, 15, and 22; vinblastine (3 mg per square meter) on days 2, 15, and 22; and doxorubicin (30 mg per square meter) and cisplatin (70 mg per square meter) on day 2.
Laser microbeam microdissection and T7‐based RNA amplification. Laser microbeam microdissection (LMM) and T7‐based RNA amplification were performed as described previously.( 10 ) The frozen tissues were sliced into 8‐µm sections using a cryostat (Sakura, Tokyo, Japan) and then stained with hematoxylin and eosin for histological examination. Bladder‐cancer cells were selectively enriched for our experiments using the MMI CellCut System with a pulsed ultraviolet narrow‐beam‐focus laser (Molecular Machines & Industries, Glattbrugg, Switzerland) according to the manufacturer's protocols. After two rounds of RNA amplification, we obtained 30–100 µg of amplified RNA (aRNA) for each sample. As a control, normal human bladder poly (A)+ RNA (BD Bioscience, Palo Alto, CA, USA), was amplified using the same method.
cDNA microarray analysis and quantification of signals. A method to fabricate the cDNA microarray slides has been described previously.( 11 ) For analysis of bladder cancer expression profiles, we prepared cDNA microarray containing of a total of 27 648 genes. For hybridization experiments, 9.0 µg of amplified RNA (aRNA) from each cancerous tissue and from the control were reversely transcribed in the presence of Cy5‐dCTP and Cy3‐dCTP (GE Healthcare, NJ, USA), respectively. Hybridization, washing and detection of signals were carried out as described previously.( 12 )
Identification of discriminating genes for chemosensitivity. We applied a random permutation test to identify genes that were expressed at significantly different levels between responders and non‐responders. For gene i, sample mean of the log‐transformed relative expression ratios for responders (X̄r ) and non‐responders (X̄n ) as well as maximum‐likelihood estimate sample standard deviations of those for responders [SD(X̄r )] and non‐responders [SD(Yn)] were calculated.
The discrimination score for gene i was defined as
| Di = (X̄r − X̄n )/[SD(X̄r ) + SD(X̄n )]. |
We determined the empiric distribution of Di under the null hypothesis that there is no association between the responder phenotype and the expression of gene i by the permutation test. Thus, both responders and non‐responders were randomly permutated and Di was calculated for each of the 10 000 times permutations. The results revealed that Di follows a near normal distribution under the null hypothesis, and the P‐value was calculated for the value of Di obtained from the observed phenotype data.
Calculation of prediction score. We calculated the prediction score for a given patient for a set of genes, S, according to the procedure described previously. Each gene in the set S votes for either responder or non‐responder phenotype according to the distances |X̄r – Xi| and |X̄n – Xi|, where Xi denotes the log‐transformed relative expression ratio for gene i for the patient. If |X̄r –Xi| < |X̄n –Xi|, the gene votes for the responder phenotype, while if |X̄r –Xi| > |X̄n – Xi|, the gene votes for the non‐responder phenotype.
The magnitude of a vote for gene i is
| Vi = |Xi − (X̄r + X̄n )/2|. |
Vi is then summed separately for the genes in S that voted for responder and where non‐responder phenotypes as follows
 |
Sr and Sn denote the subsets of S with genes that voted for responder and non‐responder phenotypes, respectively.
The prediction score for a patient j for a set S is then defined as,
| Tj = (Vr − Vn)/(Vr + Vn) × 100. |
Tj is distributed between −100 and 100 with a mean 0, and a higher value of Tj indicates that the patient j is more strongly predicted to have the responder phenotype.
Quantitative RT‐PCR. Quantitative RT‐PCR experiments were performed in duplicate for all of 14 ‘predictive’ genes, and relative expression ratios of each sample were calculated as previously described.( 8 ) We performed quantitative real‐time RT‐PCR of the 14 predictive genes, and estimated their expression levels in 21 additional test cases.
Statistical analysis for prognosis. The endpoints used in this study were overall survival period and relapse‐free period. The Kaplan–Meier product‐limit method was applied to estimate prognostic functions. Kaplan–Meier plots are used to illustrate prognosis in the positive‐score and negative‐score groups.
Results
Validation of the microarray‐based prediction system. In our previous study we established a scoring system to predict the response of M‐VAC neoadjuvant therapy for bladder cancers on the basis of expression levels of a set of 14 predictive genes.( 10 ) This system clearly distinguished the responders from the non‐responders. In this study, we enrolled 22 additional bladder cancer patients whose clinicopathological features are summarized in Table 1. According to their responses to the treatment, we categorized the patients into two groups: ‘responders’, patients who achieved downstaging (≤pT1 or ≤T1) after two courses of M‐VAC neoadjuvant chemotherapy, and ‘non‐responders’, who had not achieved downstaging (≥pT2 or ≥T2) after the two courses of drug treatment. Downstaging was judged according to the specimens obtained during cystectomy and/or through 3‐D diagnostic imaging using CT and MRI.
To further evaluate this prediction system, we examined the scores of these 22 additional cases as described previously.( 10 ) As shown in Fig. 1A, scores for 19 of the 22 cases were concordant with the response to M‐VAC therapy: all of the eight patients who had negative scores revealed poor responses and eight of the 11 patients with positive scores revealed good responses. Table 2 summarizes the comparison of the predicted and observed phenotypes. On the basis of these results, we estimated positive predictive value (PPV) and negative predictive value (NPV) as well as sensitivity and specificity. The sensitivity (proportion of the patients predicted to have the responder phenotype among responders) is estimated to be 1.0 while the specificity (proportion of the patients predicted to have the non‐responder phenotype among non‐responders) is estimated to be 0.727 (Table 2). More importantly, PPV (proportion of responders among the patients predicted to have the responder phenotype) is estimated to be 0.786 (11 of 14 cases) while NPV (proportion of non‐responders among the patients predicted to have the non‐responder phenotype) is estimated to be 1.0 (8 of 8 cases). Those results strongly suggest that the performance of the prediction system is very high although it is not 100% accurate.
Figure 1.
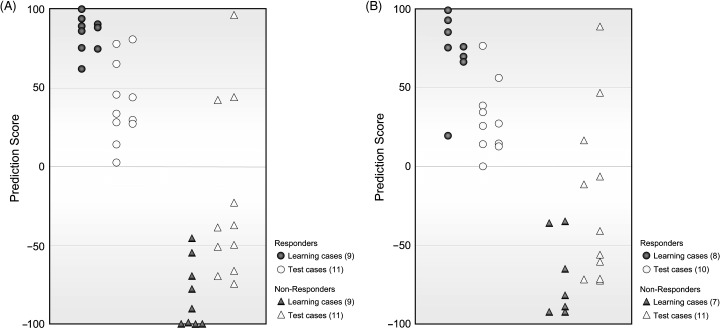
Verification of the prediction of response to M‐VAC neoadjuvant chemotherapy. (A) Distribution of prediction scores for 40 patients with microarray. Grey circles and triangles indicate scores in cross‐validation cases of patients whose expression data were used for selecting discriminating genes (Learning cases). Open circles and triangles represent scores for 22 individual cases (Test cases). High absolute values show high confidence. (B) Distribution of prediction scores for 36 patients with quantitative RT‐PCR. Grey circles and triangles indicate scores in cross‐validation cases of patients whose expression data were used for selecting discriminating genes (Learning cases). Open circles and triangles represent scores for 21 individual cases (Test cases).
Table 2.
Results of comparison between predicted and observed phenotypes
| Observed phenotype | ||
|---|---|---|
| Responder | Non‐Responder | |
| Predicted phenotype | ||
| Responder | 11 | 3 |
| Non‐responder | 0 | 8 |
Validation of the quantitative RT‐PCR‐based prediction system. We previously established a quantitative RT‐PCR‐based predicting system in addition to the microarray‐based prediction system. To validate this RT‐PCR scoring system, we performed quantitative real‐time RT‐PCR on the basis of the expression levels of 14 predictive genes using 21 test cases (one of the 22 cases was not available due to the limited amount of the sample), and then calculated a prediction score for each case. The results showed that 19 of 21 additional cases were correctly predicted for the response to the M‐VAC therapy, similar to those obtained by the microarray‐based system (Fig. 1B). PPV is estimated to be 0.769, while NPV is estimated to be 1.0. These results suggest that the response to M‐VAC by using quantitative RT‐PCR based system was also accurately predicted as well.
Predictive value of the scoring system for prognosis of patients treated with M‐VAC therapy. We next examined whether the predictive scores by the microarray‐based prediction system were associated with the clinical outcome of 40 bladder‐cancer patients treated with M‐VAC, including the test cases. Clinical outcome was available for 32 of the 40 bladder cancer patients. The results showed the 2‐year disease‐free survival rate of patients with a negative score was significantly lower than for those with a positive score (75.9%vs 41.7%; Fig. 2A). Furthermore, we found that overall survival of patients with a negative score was also significantly shorter than those with a negative score (Fig. 2B). Interestingly, none of the patients with a positive prediction score by this prediction system died within 2 years after M‐VAC‐therapy and subsequent surgical operation, but 51.9% of patients with a negative score died within 2 years. Together, the prognosis profiles were strongly associated with the prediction score on the basis of the expression profile.
Figure 2.

Association between prediction score and prognosis.(A) Kaplan–Meier plot based on disease‐free survival, and (B) on overall survival. Solid line indicates positive prediction score group. Dotted line indicates negative prediction score group.
Discussion
Despite recent advances in medicine, approximately 50% of bladder‐cancer patients who received M‐VAC neoadjuvant chemotherapy showed no or very poor response, and a large proportion of them suffer from adverse events such as myelosuppression and/or gastrointestinal and renal toxicity. Although various factors had been reported to be associated with chemosensitivity of bladder cancer, they failed to predict individual responses with high accuracy. To improve the QOL of patients with invasive bladder cancer, establishment of a reliable method to predict response to treatment with anticancer drugs is urgently required.
We previously reported identification of 14 genes that showed a significant difference in expression levels in tumors that showed good response or poor response to M‐VAC neoadjuvant chemotherapy, and established a scoring system on the basis of the expression profiles of these 14 predictive genes.( 10 ) Since further validation using additional cases was critical for its clinical application, we in this study validated the usefulness of our prediction scoring system using 22 additional bladder cancers. Our attempt clearly demonstrated that this system could accurately, although not perfectly, predict the response to M‐VAC therapy. The accuracy, sensitivity and specificity of this system were calculated to be 0.925, 1.0 and 0.727, respectively.
To further confirm the reliability of microarray data and develop more convenient prediction strategies in routine clinical use, we also validated a quantitative real‐time RT‐PCR based‐prediction system. The quantitative RT‐PCR prediction system measuring expression levels of the 14 genes using 21 test cases also accurately predicted for 18 of the 21 cases examined (Fig. 1B). High correlation of the prediction scores using the two methods in each individual patient was observed (P < 0.01; Pearson correlation), and the three cases in whom prediction of the chemosensitivity failed were common (1, 2). However, when we carefully investigated the tumors of these three cases, we interestingly found that two of the cases (BC01027 and BC01047) in fact revealed, through 3‐D diagnostic imaging using CT and MRI, significant reduction of the tumor size (more than 90%) after two courses of M‐VAC therapy. Since we applied the definition of down‐staging to pT1 or T1 by histological diagnosis as a good responder, these two cases were classified to the non‐responder group, but the shrinkage of the tumors seemed to be correlated to the prediction scores. Hence, the remaining one case, BC01043, was the only one that showed an apparent discrepancy between the tumor shrinkage and the prediction score. This discrepancy may be explained by the heterogeneity within the tumors, although it is very speculative at this point.
Down‐staging by M‐VAC neoadjuvant chemotherapy prior to surgery is known to show significant survival benefits in patients with bladder cancer. We then classified patients into two groups according to prediction system (positive or negative score) and compared their prognosis. As shown by Kaplan‐Meier analysis in Fig. 2, the ratios of the disease‐free survival as well as the overall survival of the patients were significantly different between the two groups; the group of patients with the negative prediction score had worse prognosis than that with the positive score (log rank test P < 0.02; disease‐free survival). Moreover, to avoid influence from various treatments after neoadjuvant chemotherapy, we evaluated the predictive value of the scoring system for prognosis of patients using patients with cystectomy alone after treatment of two‐course M‐VAC therapy (12 responders and 6 non‐responders). We confirmed that 2‐year disease‐free survival and overall survival rates of patients with negative scores were also significantly shorter than those with positive scores (log rank test P < 0.02; both disease‐free survival and overall survival). Furthermore, when we compared with the prognosis of bladder cancer patients who underwent cystectomy without any chemotherapy, as reported by Gschwend et al.,( 13 ) the disease‐free survival as well as the overall survival of the group with the negative score by our definition seemed to be much worse than the patients with cystectomy alone, although it may be inappropriate to compare with the data reported by another study. However, the combined data suggest that a subset of patients who showed a poor response (possibly predicted by the negative score of our system) had no obvious benefit from the M‐VAC treatment. The poor responders might have increased the risk of recurrence or metastasis partly due to the suppression of the host immune response and have shortened their lives. Hence, avoidance of the M‐VAC treatment for the possible non‐responder group using prediction of the type offered by this prediction system may provide better QOL.
Furthermore, since it has been reported that tumor grade and tumor stage are important factors for predicting prognosis in advanced bladder cancers,( 14 ) we performed Fisher's exact probability test to examine whether these factors reflect the prediction score of each patient by our prediction system. We confirmed that there was no significant correlation between the prediction score and these factors (data not shown). In addition, we performed multivariate analysis using the Cox proportional hazards model to evaluate these factors and the prediction score by our prediction system for predicting disease‐free survival in advanced bladder cancers. The results showed that the prediction score (positive vs negative; P = 0.03) was independently significant for disease‐free survival, but both tumor stage (T2 vs T3; P = 0.468) and tumor grade (G2 vs G3; P = 0.490) could not be significantly independent predicting factors of predicting 2‐year disease‐free survival in this study. Therefore, these findings suggest that prediction score might be an independent predicting factor for the prognosis of invasive bladder cancer patients.
In conclusion, our predicting system for M‐VAC could be used for advanced bladder therapy, and provides opportunities for achieving better prognosis and improved quality of life for patients. Our data suggest that the goal of ‘personalized medicine’, prescribing the appropriate treatment regimen to each patient, may be achievable by selecting specific sets of genes for their predictive values according to the approach shown here.
Acknowledgments
We thank Drs Naoyuki Kamatani and Atsushi Takahashi, Department of Advanced Biochemical Engineering and Science, Tokyo Women's Medical University for statistical analysis; Ms Yuka Ishizaki and Ms Kie Naito for cDNA microarray and real time RT‐PCR experiments; Ms Emi Okutsu‐Ichihashi and Mr Kazuyuki Hayashi for analysis of data; Ms Tae Makino and Ms Noriko Ikawa for preparation of tissue sections by cryostat.
References
- 1. Parkin DM, Bray F, Ferlay J, Pisani P. Global cancer statistics, 2002. CA Cancer J Clin 2005; 55: 74–108. [DOI] [PubMed] [Google Scholar]
- 2. Sternberg CN. The treatment of advanced bladder cancer. Ann Oncol 1995; 6: 113–26. [DOI] [PubMed] [Google Scholar]
- 3. Ardavanis A, Tryfonopoulos D, Alexopoulos A, Kandylis C, Lainakis G, Rigatos G. Gemcitabine and docetaxel as first‐line treatment for advanced urothelial carcinoma: a phase II study. Br J Cancer 2005; 92: 645–50. [DOI] [PMC free article] [PubMed] [Google Scholar]
- 4. Rosenberg JE, Carroll PR, Small EJ. Update on chemotherapy for advanced bladder cancer. J Urol 2005; 174: 14–20. [DOI] [PubMed] [Google Scholar]
- 5. Fagg SL, Dawson‐Edwards P, Hughes MA, Latief TN, Rolfe EB, Fielding JW. Cis‐diamminedichloroplatinum (DDP) as initial treatment of invasive bladder cancer. Br J Urol 1984; 56: 296–300. [DOI] [PubMed] [Google Scholar]
- 6. Raghavan D, Pearson B, Coorey G et al. Intravenous cis‐platinum for invasive bladder cancer. Safety and feasibility of a new approach. Med J Aust 1984; 140: 276–8. [PubMed] [Google Scholar]
- 7. Pectasides D, Pectasides M, Nikolaou M. Adjuvant and neoadjuvant chemotherapy in muscle invasive bladder cancer: literature review. Eur Urol 2005; 48: 60–8. [DOI] [PubMed] [Google Scholar]
- 8. Grossman HB, Natale RB, Tangen CM et al. Neoadjuvant chemotherapy plus cystectomy compared with cystectomy alone for locally advanced bladder cancer. N Engl J Med 2003; 349: 859–66. [DOI] [PubMed] [Google Scholar]
- 9. Splinter TA, Scher HI, Denis L et al. The prognostic value of the pathological response to combination chemotherapy before cystectomy in patients with invasive bladder cancer. European Organization for Research on Treatment of Cancer – Genitourinary Group. J Urol 1992; 147: 606–8. [DOI] [PubMed] [Google Scholar]
- 10. Takata R, Katagiri T, Kanehira M et al. Predicting response to methotrexate, vinblastine, doxorubicin, and cisplatin neoadjuvant chemotherapy for bladder cancers through genome‐wide gene expression profiling. Clin Cancer Res 2005; 11: 2625–36. [DOI] [PubMed] [Google Scholar]
- 11. Ono K, Tanaka T, Tsunoda T et al. Identification by cDNA microarray of genes involved in ovarian carcinogenesis. Cancer Res 2000; 60: 5007–11. [PubMed] [Google Scholar]
- 12. Okabe H, Satoh S, Kato T et al. Genome‐wide analysis of gene expression in human hepatocellular carcinomas using cDNA microarray: identification of genes involved in viral carcinogenesis and tumor progression. Cancer Res 2001; 61: 2129–37. [PubMed] [Google Scholar]
- 13. Gschwend JE, Dahm P, Fair WR. Disease specific survival as endpoint of outcome for bladder cancer patients following radical cystectomy. Eur Urol 2002; 41: 440–8. [DOI] [PubMed] [Google Scholar]
- 14. Angulo JC, Sanchez‐Chapado M, Lopez JI, Flores N. Primary cisplatin, methotrexate and vinblastine aiming at bladder preservation in invasive bladder cancer: multivariate analysis on prognostic factors. J Urol 1996; 155: 1897–902. [PubMed] [Google Scholar]