

Abstract
To study the effects of suppressed α‐mannosidase Man2c1 gene expression on EC9706 human esophageal carcinoma cells, the cells were treated with short interfering RNA. Growth inhibition of EC9706 cells was observed when Man2c1 expression was inhibited in this way. Flow cytometric analysis showed accumulation of cells in S and G2–M phases, as well as cell apoptosis. The mitotic index test showed cell‐cycle arrest at the M checkpoint. Although the percentage of cells in (pro)metaphase increased, the proportion of cells in anaphase and telophase decreased. Apoptosis was trigged by mitotic arrest. Furthermore, microtubules in EC9607 cells were examined by means of fluorescence staining of α‐tubulin. Although control cells showed a nest‐like microtubule network, the microtubule network in experimental cells was vague and condensed at the perinuclear region. Some cells with Man2c1 suppression had large protrusions of cytoplasm, some of which linked with the main body through a long, thin connection. Western blotting showed that tubulin polymerization was inhibited. The data imply that induction of mitotic arrest and consequent apoptosis resulted from microtubule disorganization, which appears to be one of the major cellular mechanisms by which suppressed expression of the Man2c1 gene causes growth inhibition of EC9706 esophageal carcinoma cells. In addition, Man2c1 suppression results in upregulation of E‐cadherin, α‐catenin, and β‐catenin expression in cells. (Cancer Sci 2008; 99: 2428–2434)
We previously reported that suppression of α‐mannosidase Man2c1 gene expression in the human nasopharyngeal carcinoma cell line CNE‐2L2 resulted in significant reduction of malignant activities, including growth, tumorigenesis, and metastasis potentialities.( 1 ) In order to examine whether suppression of Man2c1 gene expression had similar effects on other tumor cells, the human esophageal carcinoma cell line EC9706 was chosen as the target in the present study. We found that when Man2c1 gene expression was suppressed, cell growth was inhibited and most of the cells died. To explore whether cell growth inhibition trigged by Man2c1 suppression was mediated by cell‐cycle regulation, the cell cycle was analyzed using a flow cytometer. The results showed S and G2–M accumulations and a high sub‐G0–G1 peak. Apoptosis was further confirmed by a DNA fragmentation test.
Accumulation in S and G2–M phases may result in apoptosis. It is known that cell‐cycle progression can be arrested at specific checkpoints and cell‐cycle arrest can result in apoptosis.( 2 , 3 , 4 ) For example, interphase apoptosis is coupled with arrest at the G1–S checkpoint( 5 ) and mitotic arrest causes mitotic death.( 3 ) Based on the S and G2–M accumulations, we speculated that mitotic arrest was trigged by Man2c1 suppression in these cells. The speculation was confirmed by a mitotic index assay.
In higher eukaryotic cells a number of crucial processes, including cell division, depend on the cytoskeleton. The cytoskeleton is composed of proteins including microtubules. Microtubules are dynamically in continuous assembly and disassembly by alternate polymerization and depolymerization of α‐tubulin and β‐tubulin dimers.( 6 ) Microtubule inhibitors, such as paclitaxel,( 7 ) vincristine,( 8 ) nocodazole,( 9 ) evodiamine,( 10 ) and the isocoumarin derivative 185322,( 11 ) can cause mitotic arrest and consequent apoptosis in various cells. It was found that induction of mitotic arrest and apoptosis by evodiamine in the human leukemic T‐lymphocyte cell line CCRF‐CEM was through enhancement of polymerized tubulin levels.( 10 ) In contrast, treatment with 185322 resulted in an increase in soluble β‐tubulin, consistent with inhibition of tubulin polymerization and consequent apoptosis in the human multiple myeloma cell lines U266 and RPMI8266.( 11 ) Whether tubule polymerization is promoted or inhibited, these studies imply that disturbance of tubule polymerization is associated with the mechanism resulting in mitotic arrest and apoptosis.
In our previous studies, we observed that with suppression of Man2c1 gene expression CNE‐2L2 cells showed a marked decrease in lamellipodia,( 1 ) and human T‐cell lymphoma Jurkat cells exhibited much more filopodia and lamellipodia than the controls,( 12 ) indicating rearrangement of the cytoskeleton. Therefore, the microtubule network and tubule polymerization were examined in the present study. Interestingly, the microtubule network in cells with Man2c1 suppression was vague and condensed at the perinuclear region compared to the nest‐like microtubule network in the controls. Furthermore, a large protrusion of cytoplasm was observed in some cells, some of which was linked with the main body through a long, thin connection. Polymerization of tubules was inhibited in the cells. The present study demonstrates that inhibition of α‐mannosidase Man2c1 gene expression causes mitotic arrest and consequent apoptosis resulting from microtubule disarrangement in association with inhibition of tubule polymerization in esophageal carcinoma EC9706 cells. This may be one of the major mechanisms for inhibition of cell growth.
Materials and Methods
Cell lines and animals. The human esophageal squamous cell carcinoma cell line EC9706 was developed by Han et al.( 13 ) The human embryonic kidney cell line GP‐293 was obtained from the Cell Culture Center (Institute of Basic Medical Sciences, Chinese Academy of Medical Sciences, Beijing, China). The cells were propagated in RPMI‐1640 (Gibco‐BRL, Rockville, MD, USA) containing 10% fetal calf serum (FCS) (Gibco‐BRL). BALB/c athymic nude mice aged approximately 4 weeks were supplied by the Institute of Laboratory Animal Science (Chinese Academy of Medical Sciences).
Construction of virus vector containing short interfering RNA and generation of recombinant virus. pXSNhU6+27‐siMan2c1 and pXSNhU6+27‐siegfp were constructed following the procedures introduced by Liu et al.( 14 ) The retrovirus vector pXSNhU6+27 was constructed from pLXSN (Clontech, Palo Alto, CA, USA) and pAVU6+27 (Clontech). All of the oligonucleotides used are listed in Table 1. The synthetic oligonucleotides were annealed and inserted into pXSNhU6+27 downstream of the U6+27 promotor. The configuration of the constructs was verified by DNA sequencing. Generation of recombinant retroviruses was carried out in GP‐293 cells according to the procedures introduced by Liu et al.( 14 )
Table 1.
Sequences of the oligonucleotides used
| Name | Sequence |
|---|---|
| siMan2c1‐1 sense | 5′‐tcgagcagggccagaacttctttctaacgagaaagaagttctggccctgcaaaa‐3′ |
| siMan2c1‐1 antisense | 5′‐ctagttttgcagggccagaacttctttctcgttagaaagaagttctggccctgc‐3′ |
| siMan2c1‐2 sense | 5′‐tcgagcgctttctcacccagaaattaacgaatttctgggtgagaaagcgcaaaa‐3′ |
| siMan2c1‐2 antisense | 5′‐ctagttttgcgctttctcacccagaaattcgttaatttctgggtgagaaagcgc‐3′ |
| siMan2c1‐3 sense | 5′‐tcgagcctgtgttcgtagtgcaagaaacgtcttgcactacgaacacaggcaaaa‐3′ |
| siMan2c1‐3 antisense | 5′‐ctagttttgcctgtgttcgtagtgcaagacgtttcttgcactacgaacacaggc‐3′ |
| siMan2c1‐4 sense | 5′‐tcgagcgacctacccactacaatacaacggtattgtagtgggtaggtcgcaaaa‐3′ |
| siMan2c1‐4 antisense | 5′‐ctagttttgcgaccyacccactacaataccgttaacttcagggtcagcttgc‐3′ |
| siegfp sense | 5′‐tcgagcaagctgaccctgaagttaacgaacttcagggtcagcttgcaaaa‐3′ |
| siegfp antisense | 5′‐ctagttttgcaagctgaccctgaagttcgttaacttcagggtcagcttgc‐3′ |
| pXSN upstream | 5′‐agcctccgcctcctctt‐3′ |
| pXSN downstream | 5′‐gaacctgcgtgcaatccatctt‐3′ |
| pAVU6+27 upstream | 5′‐ggatccaaggtcgggcaggaag‐3′ |
| pAVU6+27 downstream | 5′‐cttgcatgcctgcaggtcctagta‐3′ |
| Man2c1 upstream | 5′‐tgtgttccaccgggatgtc‐3′ |
| Man2c1 downstream | 5′‐tgtggcatgaatggtgtgttg‐3′ |
Viral infection of cells. When cell culture reached 70–80% confluence in six‐well plates, the culture medium was replaced with 3 mL flash Dulbecco's modified Eagle's medium (Gibco‐BRL) containing 10% FCS. Retrovirus supernatant (1 mL) was added together with polybrene (6 µg/mL final concentration) into each well and the cells were incubated at 37°C overnight. The next day, the medium was replaced with fresh medium supplemented with G418 (400 µg/mL, active component geneticin; Gibco‐BRL). After 7–10 days, G418‐resistant cell pools were established.
Polymerase chain reaction. Insertion of short interfering RNA (siRNA) into pAVU6+27 was examined by polymerase chain reaction (PCR) upstream and downstream of the polyclonal site of pAVU6+27 as primers. Integration of pXSNhU6+27 siRNA into genomic DNA was determined by PCR upstream and downstream of the polyclonal site of pXSN as primers. The PCR was carried out using 1 µL diluted template in a 50‐µL reaction system at 94°C for 5 min, then at 94°C for 45 s, 58°C for 45 s, and 72°C for 90 s for 30 cycles, followed by 72°C for 5 min for the final extension. PCR products were examined by electrophoresis on a 1.5% agarose gel containing ethidium bromide.
Real‐time PCR. Total RNA was extracted from cells with Trizol reagent (Gibco‐BRL). cDNA was synthesized using the Reverse Transcription System (Promega, Madison, WI, USA). Sequences upstream and downstream of Man2c1 were used as the primers. Real‐time reverse transcription‐PCR was run using the SYBR Premix Ex Taq Kit (Takara, Otsu, Shiga, Japan) according to the manufacturer's instructions. The PCR microplate was from Axygen (Union City, CA, USA).
Enzyme activity assay. The enzymatic activity of α‐mannosidase Man2c1 in cells was assayed according to procedures described previously with p‐nitro‐phenyl‐α‐d‐mannopyranoside as the substrate.( 1 ) One unit equals 1 nmol/L p‐nitro‐phenyl‐α‐d‐mannopyranoside hydrolyzed in 1 min at 37°C.
Cell cloning. Cell suspension with a density of 4 cells/mL and 0.2mL RPMI‐1640 containing 15% FCS were plated into each well on 96‐well plates (Corning Costar Corporation, Corning, NY, USA). The cells were incubated at 37°C, 5% CO2. The cloned cells were expanded and stored in liquid nitrogen.
Cell proliferation assay. Approximately 500 cells in 200 µL RPMI‐1640 containing 10% FCS were seeded into each well on 96‐well plates. At the end of days 1–6, 20 µL solution from the CellTiter 96 Aqueous One Solution Cell Proliferation Assay Kit (Promega) was applied to each well and the plates were incubated at 5% CO2, 37°C for 2.5 h. The supernatant in the wells was moved to new plates and the absorbance at 490 nm was determined. The assay was repeated four times.
Colony formation. Colony formation was carried out in soft agar according to procedures described previously.( 1 ) Cells (1 × 10⁴) were seeded into the top of the agar. After 14 days incubation at 5% CO2, 37°C, the number of colonies with a diameter >500 µm was counted and the colony‐formation rate was calculated. The experiment was repeated three times.
Tumorigenesis in nude mice. The tumorigenesis assay was carried out according to a method used previously.( 1 ) Briefly, 2 × 10⁶ cells in 0.2 mL phosphate‐buffered saline (PBS) were inoculated subcutaneously into the right armpit of nude mice with eight mice in each group. Eight weeks later, the mice were killed and tumors were excised and weighed.
Cell‐cycle analysis. DNA content analysis was carried out following the procedures described by Liu et al.( 14 ) Briefly, cells were fixed with cold ethanol at 4°C overnight and then stained with propidium iodide. After treatment with RNaseA, the cell cycle was analyzed using a flow cytometer.
DNA fragmentation. DNA fragmentation was carried out according to a method described previously.( 15 )
Immunofluorescence staining. Cells on coverslips were fixed with 4% paraformaldehyde for 30 min at room temperature and permeabilized with 0.5% Triton‐X100 in PBS for 2 min at room temperature. Cells were then washed three times with PBS and blocked with 10% FCS for 1 h. Cells were stained with monoclonal antibody to α‐tubulin (Santa Cruz Biotechnology, Santa Cruz, CA, USA). Goat antimouse IgG conjugated with fluorescein isothiocyanate (Sigma, St Louis, MO, USA) was used as the secondary antibody. The nuclei were counterstained with 4′,6‐diamidino‐2‐phenylindole (10 mg/mL, in PBS) for 20 min. The mitotic index was calculated as the percentage of mitotic cells versus the total cell count (200 cells). Mitotic cells were further categorized into prometaphase/metaphase and anaphase/telophase. The calculation was repeated three times. Confocal images were acquired with a laser scanning confocal microscope.
Analysis of microtubule polymerization. Cells were lysed in microtubule‐stabilizing buffer (20 mmol/L Tris‐HCl pH 6.8, 2 mmol/L ethylenediaminetetraacetic acid, 0.5% Nonident P‐40, 1 mmol/L MgCl2, 0.5 µg/mL paclitaxel, complete protease inhibitor mixture [Roche Diagnostics, West Sussex, UK], and 100 µg/mL phenylmethylsulfonyl fluoride) and centrifuged at 12 000g for 10 min at 4°C. The supernatants (containing soluble tubulin) and the pellets (containing polymerized tubulin) were subjected to immunoblot analysis with anti‐α‐tubulin. Goat antimouse secondary antibody conjugated with horseradish peroxidase (Pharmingen, San Diego, CA, USA) was used as the secondary antibody. β‐Actin was used as an internal control. The protein bands were visualized using SuperSignal West Pico Trial Kit (Pierce, Rockford, IL, USA).
Western blotting. Western blot analysis was carried out following procedures described previously.( 1 ) Mouse monoclonal antibody to human E‐cadherin was a product of Zymed Laboratories (South San Francisco, CA, USA). Mouse monoclonal antibodies to human α‐catenin and β‐catenin were purchased from Santa Cruz Biotechnology.
Results
Development of the EC9706 cell line with Man2c1 suppression. Insertion of Man2c1 siRNA into pAVU6+27 was analyzed by PCR with upstream and downstream of the polyclonal site of pAVU6+27 as primers. Figure 1a shows that the PCR products from pAVU6+27‐siMan2c1 and pAVU6+27‐siEGFP (enhanced green fluorescence protein) were 50 bp longer than that from pAVU6+27, indicating insertion of the siRNA into pAVU6+27. Insertion of siRNA was confirmed by nucleotide sequencing. pAVU6+27‐siegfp, pAVU6+27‐siMan2c1, and pAVU6+27 were digested with BamHI and XhoI. The digested DNA was inserted into pXSN digested with BamHI and XhoI to produce pXSNU6+27‐siegfp, pXSNU6+27‐siMan2c1, and pXSNU6+27. The relevant retroviruses were produced in GP‐293 cells.
Figure 1.
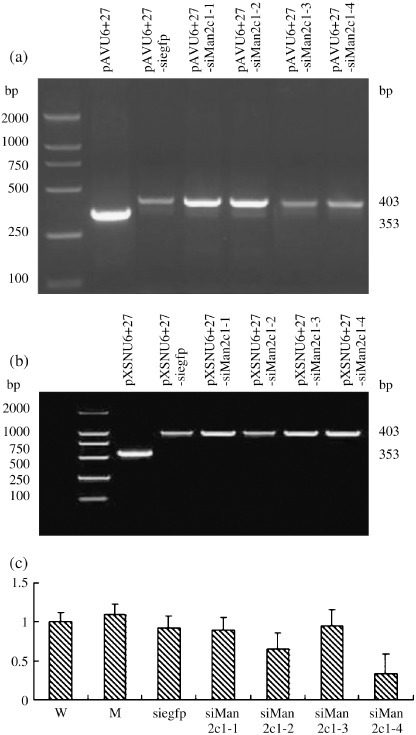
(a) Development of EC9706 cells with Man2c1 suppression. Insertion of siMan2c1 and siegfp into pAVU6+27 was analyzed by polymerase chain reaction (PCR). pAVU6+27‐siMan2c1‐1, ‐2, ‐3, ‐4, and pAVU6+27‐siegfp represent pAVU6+27 inserted with siMan2c1‐1, ‐2, ‐3, ‐4, and siegfp, respectively. pAVU6+27‐siegfp, pAVU6+27‐siMan2c1, and pAVU6+27 were digested with BamHI and XhoI, and the digested DNA was inserted into pXSN similarly digested with BamHI and XhoI to produce pXSNU6+27‐siegfp, pXSNU6+27‐siMan2c1, and pXSNU6+27, respectively. The relevant retroviruses were produced in GP‐293 cells. (b) Integration of short interfering (si) RNA was analyzed by genomic PCR. (c) Man2c1 mRNA expression in cells assayed by real‐time PCR. The data for Man2c1 was standardized by β‐actin expression. Man2c1 mRNA and β‐actin mRNA for wild‐type (W) cells were normalized as 1. W, M, siegfp, and siMan2c1‐1, ‐2, ‐3, and 4 represent wild‐type cells, and cells infected with retroviruses harboring pXNSU6+27, pXNSU6+27‐siegfp, and pXNSU6+27‐siMan2c1‐1, ‐2, ‐3, and ‐4, respectively.
Infection of EC9706 cells with the retroviruses harboring pXNSU6+27, pXNSU6+27‐siegfp, and pXNSU6+27‐siMan2c1 was analyzed by genomic PCR upstream and downstream of the polyclonal site of pXSN as primers. The relevant PCR products shown in Figure 1b indicate integration of the relevant expression box into host DNA. Real‐time PCR revealed that expression of Man2c1 mRNA was profoundly inhibited in the cells integrated with siMan2c1‐2 or siMan2c1‐4 (Fig. 1c). The inhibition incidence reached 34 and 67% for siMan2c1‐2 and siMan2c1‐4, respectively. The enzymatic activity of α‐mannosidase Man2c1 in wild‐type (W) cell was 41 ± 8 units/mg protein. A reduction was observed in the cells treated with siMan2c1. The activities were 37 ± 10, 24 ± 6, 40 ± 14, and 18 ± 11 units/mg protein for cells treated with siMan2c1‐1, siMan2c1‐2, siMan2c1‐3, and siMan2c1‐4, respectively (siMan2c1‐2 or siMan2c1‐4 vs W, paired t‐test, P < 0.05). Transduction with the irrelevant DNA (siegfp) or mock did not affect the catalytic activity (42 ± 10 and 37 ± 6 units/mg protein, respectively). The assay was carried out four times.
Man2c1 suppression inhibited growth and tumorigenesis of EC9706 cells. The cells integrated with siMan2c1‐4 were cloned. Most of the cells died in cloning. Of the 28 clones obtained in two 96‐well plates, 15 clones died in cell expansion. Growth of the remaining cells was very slow. Two of these clones, B7 and D2, together with the controls, the wild‐type cells and the cells integrated with siegfp were used in the present study. Real‐time PCR showed 55 and 86% inhibition of Man2c1 gene expression in B7 and D2 cells, respectively. Growth curves (Fig. 2a) and the colony‐formation test (Fig. 2b) showed marked inhibition of cell growth caused by Man2c1 suppression. The colony‐formation rate in soft agar was 20.2 ± 0.7, 21.3 ± 0.6, 8.3 ± 0.4, and 6.5 ± 0.7% for wild type, siegfp, B7, and D2 cells, respectively (paired t‐test, B7 or D2 vs wild type, P < 0.01).
Figure 2.
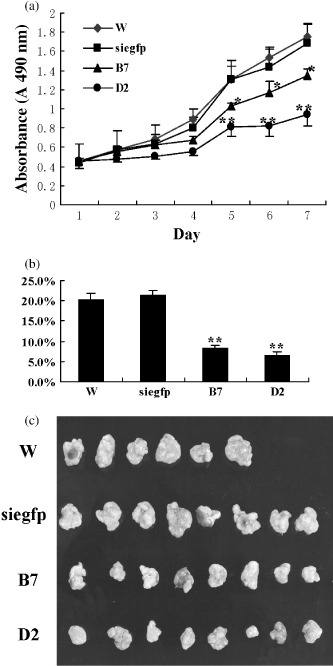
Man2c1 suppression caused inhibition of growth and tumorigenesis of cells. (a) Growth curves. Five hundred cells in culture medium were seeded into each well on 96‐well plates. Cell growth was continually detected and the test was repeated four times. B7 and D2 were two cell clones with Man2c1 suppression. The difference between B7 or D2 and wild type (W) was significant (paired t‐test, *P < 0.05, **P < 0.01). (b) Colony‐formation rates assayed in soft agar. Colonies with a diameter of more than approximately 500 µm were counted on day 14. The experiment was repeated three times. The difference between B7 or D2 and W was significant (paired t‐test, **P < 0.01). (c) Comparison of tumor size at the time of mouse death.
Tumorigenesis was observed in all of the mice inoculated with EC9706 cells. Two mice inoculated with wild‐type cells died in the middle of the experiment. They were not included in the data analysis. Figure 2c shows a comparison of the tumor size at the time of mouse death. The average weights of the tumors were 3.03 ± 0.65, 2.74 ± 1.06, 1.52 ± 0.53, and 1.47 ± 0.62 g for wild type, siegfp, B7, and D2, respectively. The differences between B7 or D2 and wild type were significant (paired t‐test, P < 0.05).
Man2c1 suppression induced mitotic arrest and apoptosis. To explore the mechanisms of the inhibitive effect of Man2c1 suppression on cell growth, cell‐cycle analysis was carried out. As showed in Figure 3a and in Table 2, Man2c1 suppression caused accumulations of the cells in S phase and in G2–M phase. In addition, a marked increase of cells in the sub‐G0–G1 region was observed in B7 and D2 cells, implying induction of apoptosis by Man2c1 suppression. The apoptosis was confirmed by DNA fragmentation test (Fig. 3b). The extent of cell accumulation in S and G2–M phases correlated with the extent of apoptosis.
Figure 3.
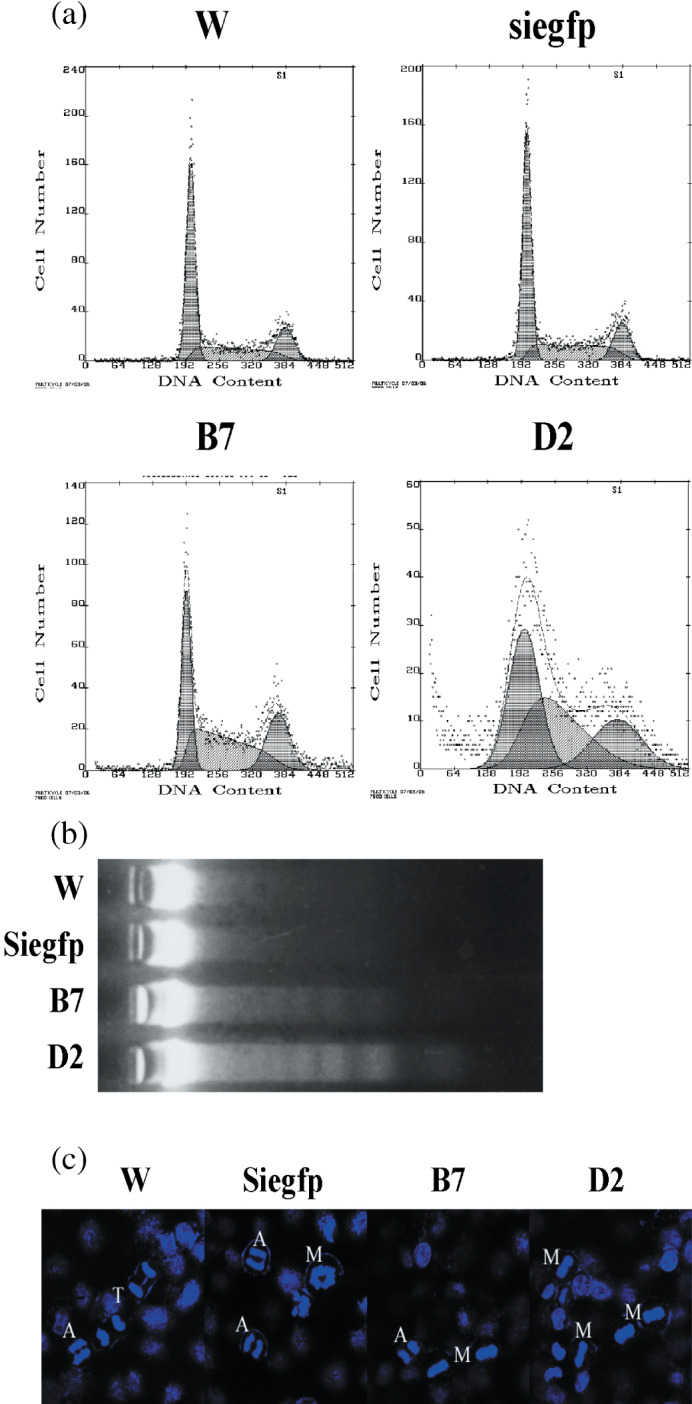
Man2c1 suppression caused mitotic arrest and apoptosis of cells. (a) Cells were stained with propidium iodide and cell‐cycle analysis was carried out using a flow cytometer. (b) Apoptosis assayed by DNA fragmentation test. (c) Mitosis. Cell nuclei were stained with 4′,6‐diamidino‐2‐phenylindole. In contrast to the controls, later stages of mitosis (anaphase and telophase) were rarely detected in the cells with Man2c1 suppression (B7 and D2). A, anaphase; M, metaphase; PM, premetaphase; T, telophase; W, wild type.
Table 2.
Effects of Man2c1 suppression on the cell‐cycle profile
| Group | Sub‐G0–G1 (%) | G0–G1 (%) | S (%) | G2–M (%) |
|---|---|---|---|---|
| W | 1.55 | 59.6 | 26.5 | 14.2 |
| Siegfp | 1.44 | 58.2 | 27.0 | 14.8 |
| B7 | 7.30 | 48.3 | 33.9 | 17.8 |
| D2 | 17.6 | 28.5 | 43.9 | 27.2 |
W and siegfp represent wild‐type cells and those inserted with siegfp, respectively. B7 and D2 were two cell clones with Man2c1 suppression.
Because apoptosis has been reported to be caused by mitotic arrest,( 6 , 7 , 8 , 9 , 10 ) the mitotic index of cells was detected. The mitotic index was 7.20 ± 0.66, 6.45 ± 0.73, 10.81 ± 1.36, and 15.04 ± 1.18% for W, siegfp, B7, and D2 cells, respectively. In evaluating nuclear morphology, we noted that the later stages of mitosis (anaphase/telophase) were rarely present in B7 and D2 cells (Table 3; Fig. 3c). The data indicated that Man2c1 suppression caused mitotic arrest.
Table 3.
Effects of Man2c1 suppression on mitotic index, and the percentage of cells in prometaphase/metaphase and anaphase/telophase
| Cell | Mitotic index (%) | Cells in prometaphase/metaphase (%) | Cells in anaphase/telophase (%) |
|---|---|---|---|
| W | 7.2 ± 1.6 | 2.7 ± 0.8 | 4.5 ± 0.7 |
| Siegfp | 6.4 ± 0.7 | 2.2 ± 0.5 | 4.3 ± 0.3 |
| B7 | 10.8 ± 1.4* | 7.9 ± 0.9** | 2.9 ± 0.8* |
| D2 | 15.4 ± 2.2** | 13.1 ± 2.2** | 1.9 ± 0.4** |
Data are expressed as mean ± SD. Values significantly different from wild type (W) are indicated as *P < 0.05 and **P < 0.01 (paired t‐test). B7 and D2 were two cell clones with Man2c1 suppression.
Man2c1 suppression caused microtubule disorganization. Because mitotic arrest can be caused by microtubule disorganization( 8 , 9 , 10 ) we examined the microtubule network by immunofluorescence staining of α‐tubulin. Figure 4a shows a nest‐like microtubule network in W and siegfp cells. However, microtubule organization was different in cells with Man2c1 suppression (D2). The microtubule network was vague and condensed at the perinuclear region compared to that in the controls. Furthermore, a large protrusion of cytoplasm was observed in some cells, some of which were linked with the main body through a long, thin connection. To determine if Man2c1 suppression caused microtubule disorganization by affecting tubulin polymerization, we assayed the cells for soluble and polymerized tubulins. Immunoblotting analysis of β‐actin was used as a control for protein loading. Figure 4b shows a decrease in polymerized tubulin in the cells with Man2c1 suppression compared with the control cells.
Figure 4.
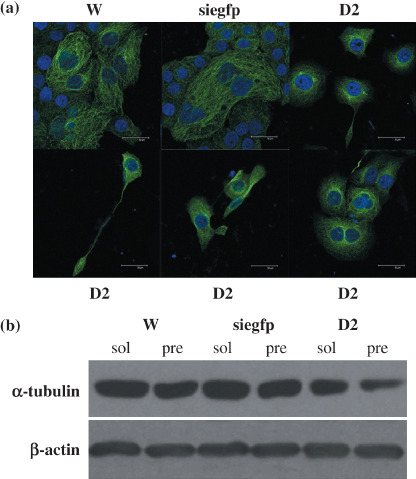
Effects of Man2c1 suppression on microtubule network and tubule polymerization. (a) Cells fixed with 4% paraformaldehyde and permeabilized with 0.5% Triton‐X100 in phosphate‐buffered saline were stained with anti‐α‐tubulin and 4′,6‐diamidino‐2‐phenylindole. The microtubule network was examined using a laser scanning confocal microscope. (b) Polymerization of α‐tubulein was analyzed by immunoblotting. Cells were lysed in microtubule‐stabilization buffer. α‐Tubulin in the soluble (sol) and insoluble (pre) fractions was detected. β‐Actin was used as an internal control.
Man2c1 suppression caused enhanced expression of α‐cadherin, E‐catenin, and β‐catenin. Figure 5 shows enhanced expression of E‐cadherin, α‐catenin, and β‐catenin in B7 and D2 cells compared with W and mock (M) cells.
Figure 5.
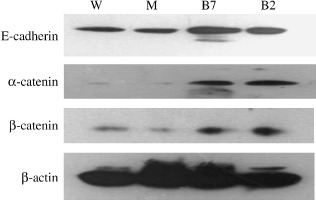
Enhanced expression of E‐cadherin, α‐catenin and β‐catenin in cells with Man2c1 suppression. Western blot analysis was carried out for expression of E‐cadherin, α‐catenin, and β‐catenin in cells. B7 and D2 were clones with Man2c1 suppression. β‐Actin was used as an internal control. M, mock cells; W, wild‐type cells.
Discussion
We previously reported marked growth inhibition of the human nasopharyngeal carcinoma cell CNE‐2L2, which was caused by suppression of α‐mannosidase Man2c1 gene expression.( 1 ) Similar effects were reported by Suzuki et al. with Man2c1 suppression in Hek293 cells.( 16 ) In the present study, similar effects were observed in the human esophageal carcinoma cell line EC9706. Cell‐cycle analysis showed that Man2c1 suppression resulted in S and G2–M accumulations and apoptosis of cells.
The cell cycle contains several checkpoints, and cell‐cycle progression can be controlled or arrested at these checkpoints. The accumulation of cells at G2–M phase in the present study showed that the cell cycle was arrested at the G2 or M checkpoints. The mitotic index test demonstrated that the arrest was mainly at the M checkpoint, because the percentage of cells in (pro)metaphase increased and the proportion of cells in anaphase and telophase decreased. Mitotic arrest has been reported to result in apoptosis. If a cell cannot exit mitosis, it undergoes apoptosis.( 3 , 10 , 17 ) Even if cells can exit mitosis and enter the cell cycle again, some would become arrested in G1 and undergo apoptosis again, instead of entering S phase.( 18 , 19 ) This explains the accumulation of cells in S and G2–M phases as well as apoptosis observed simultaneously in the cells with Man2c1 suppression.
Mitotic arrest can be caused by microtubule disturbance.( 7 , 8 , 9 , 10 , 11 ) In our previous studies, cytoskeleton reorganization was observed in cells with Man2c1 suppression. Man2c1 suppression caused a decrease in the number of lamellipodia in the human nasopharyngeal carcinoma cell line CNE‐2L2( 1 ) and an increase in the numbers of filopodia and lamellipodia in the human T‐cell leukemia cell line Jurkat.( 12 ) The data suggest that Man2c1 suppression might also affect arrangement of the cytoskeleton in EC7906 cells. The cytoskeleton is a complex network of protein filaments that includes intermediate filaments, microtubules, and actin filaments. Microtubules are composed of alternate α‐tubulin and β‐tubulin molecules. Therefore, microtubules in EC9607 cells were examined by means of fluorescence staining of α‐tubulin using a laser scanning confocal microscope. Interestingly, microtubule disorganization was observed in cells with Man2c1 suppression.
The central event in mitosis is the attachment of kinetochores to microtubules. Cells undergo mitosis with a bipolar mitotic spindle, which is composed of microtubules and various proteins that interact with them. Therefore, mitotic arrest in EC9706 cells with Man2c1 suppression is certainly associated with microtubule disorganization. Microtubules are dynamic structures in continuous assembly and disassembly through alternate polymerization and depolymerization of α‐tubulin and β‐tubulin dimers. Disruption of microtubule dynamics can lead to apoptosis.( 6 ) Interference of tubule polymerization by microtubule inhibitors has been reported to result in mitotic arrest and consequent apoptosis of cells.( 10 , 11 ) In the present study, reduced polymerization of tubules was also observed in the cells with Man2c1 suppression. It can be postulated that disorganization of microtubules in the cells might be somehow associated with the disturbance of tubule polymerization. Taken together, the data imply that induction of mitotic arrest and consequent apoptosis resulting from microtubule disorganization appears to be a major cellular mechanism by which reduced Man2c1 gene expression causes growth inhibition of the esophageal carcinoma cell line EC9706.
In our previous work on the nasopharyngeal carcinoma cell CNE‐2L2, we observed that E‐cadherin expression was enhanced in cells with suppressed expression of the Man2c1 gene. The E‐cadherin–catenin complex plays a crucial role in mediating cell adhesion in epithelial cells( 20 ) and cell–cell contact plays an important part in growth inhibition of both normal( 21 , 22 ) and malignant cells.( 23 ) Enhanced expression of E‐cadherin, α‐catenin, and β‐catenin implies that the E‐cadherin–catenin complex might also play a role in the growth inhibition of EC9706 cells caused by Man2c1 suppression.
Although we know that α‐mannosidase functions in trimming mannoses on N‐glycans, the exact function of Man2c1 has not yet been clarified. Recently, Suzuki et al. reported that Man2c1 is involved in the processing of free oligosaccharides, formed in the cytosol from misfolded glycoproteins, by the peptide N‐glycanase.( 16 ) Chantret and Moore reviewed the literature dealing with free‐oligosaccharide regulation during mammalian protein N‐glycosylation and reported that free oligosaccharides are transported from the endoplasmic reticulum to the cytoplasm and from the cytoplasm into lysosomes by trafficking machinery comprising oligosaccharide‐specific endoplasmic reticulum and lysosomal transporters, an endo‐β‐N‐acetyl‐glucosaminidase, and cytosolic Man2c1, and are eventually cleaned in lysosomes.( 24 ) Thus, reduced expression of Man2c1 does not play a part in the regulation of microtubule complex formation, the cell cycle, and apoptosis through the free oligosaccharides formed. α‐Mannosidase might also function in other way in cells. We previously reported that suppressed expression of Man2c1 resulted in enhancement of concanavalin A (Con A) binding to cells.( 12 , 15 ) Because the receptor for Con A is a high‐mannose oligosaccharide,( 25 ) enhanced Con A binding implies an increase in high‐mannose oligosaccharides in N‐glycans, indicating a reduction in the α‐mannosidase activity of cells. Most proteins, including those involved in construction of the cytoskeleton, are O‐glycosylated or N‐glycosylated, for example, α‐tubulin has three potential N‐glycosylation sites. N‐glycosylation is an important post‐translational modification of proteins. Derivatization of proteins with N‐glycans different in composition or structure would have effects on protein conformation, transportation, expression, stability, activity, and antigenicity, which consequently affects the biological behavior of cells.( 26 ) Thus, it could be speculated that suppressed expression of Man2c1 would act on microtubule‐complex formation, and consequently the cell cycle and apoptosis mechanisms, through modification of protein N‐glycosylation.
Acknowledgments
This work was supported by the National Basic Research Program of China (no. 2001CB510004) and the National High Technology Research and Development Program of China (no. 2002BA711A03).
These authors contributed equally to this work.
References
- 1. Yue W, Jin YL, Shi GX et al . Suppression of 6A8 α‐mannosidase gene expression reduced the potentiality of growth and metastasis of human nasopharyngeal carcinoma. Int J Cancer 2004; 108: 189–95. [DOI] [PubMed] [Google Scholar]
- 2. Alberts B, Johnson A, Lewis J, Raff M, Roberts K, Walter P. Molecular Biology of the Cell, 4th edn. New York: Garland Science, 2002. [Google Scholar]
- 3. Blagosklonny MV. Mitotic arrest and cell fate: why and how mitotic inhibition of transcription drives mutually exclusive events. Cell Cycle 2007; 6: 70–4. [DOI] [PubMed] [Google Scholar]
- 4. Erenpreisa M, Cragg MS. Mitotic death: mechanism of survival? A review. Cancer Cell Int 2001; 1: 1–7. [DOI] [PMC free article] [PubMed] [Google Scholar]
- 5. Liu HC, Chen GG, Vlantis AC, Leung BCS, Tong MCF, Van Hasselt CA. 5‐Fluorouracil mediates apoptosis and G1/S arrest in laryngeal squamous cell carcinoma via a p53‐independent pathway. Cancer J 2006; 12: 482–93. [DOI] [PubMed] [Google Scholar]
- 6. Mollinedo F, Gajate C. Microtubules, microtubule‐interfering agents and apoptosis. Apoptosis 2003; 8: 413–50. [DOI] [PubMed] [Google Scholar]
- 7. Blagosklonny MV, Fojo T. Molecular effects of paclitaxel: myths and reality. Int J Cancer 1999; 83: 151–6. [DOI] [PubMed] [Google Scholar]
- 8. Horwitz SB. Mechanism of action of taxol. Trends Pharmacol Sci 1992; 13: 134–6. [DOI] [PubMed] [Google Scholar]
- 9. Jordan MA, Wilson L. Microtubules as a target for anticancer drugs. Nat Rev Cancer 2004; 4: 253–65. [DOI] [PubMed] [Google Scholar]
- 10. Huang Y‐C, Guh J‐H, Teng C‐M. Induction of mitotic arrest and apoptosis by evodiamine inhuman leukemic T‐lymphocytes. Life Sci 2004; 75: 35–49. [DOI] [PubMed] [Google Scholar]
- 11. Kawano T, Agata N, Kharbanda S, Avigan D, Kufe D. A novel isocoumarin derivative induces mitotic phase arrest and apoptosis of human multiple myeloma cells. Cancer Chemother Pharmacol 2007; 59: 329–35. [DOI] [PubMed] [Google Scholar]
- 12. Qu L, Ju JY, Chen SL et al . Inhibition of α‐mannosidase Man2c1 gene expression enhances adhesion of Jurkat cells. Cell Res 2006; 16: 622–31. [DOI] [PubMed] [Google Scholar]
- 13. Han YL, Wei F, Xu X et al . Establishment and comparative genomic hybridization analysis of human esophageal carcinomas cell line EC9706. Chin J Med Genet 2002; 19: 455–7. [PubMed] [Google Scholar]
- 14. Liu CM, Liu DP, Dong WJ, Liang CC. Retrovirus vector‐mediated stable gene silencing in human cells. Biochem Biophys Res Comm 2004; 313: 716–20. [DOI] [PubMed] [Google Scholar]
- 15. Shi GX, Liu Y, Li L, Zhu LP. Inhibition of 6A8 α‐mannosidase causes oncosis – like death of BJAB cells. Cell Mol Biol 2002; 48: OL369‐77. [PubMed] [Google Scholar]
- 16. Suzuki T, Hara I, Nakano M et al . Man2C1, an α‐mannosidase is involved in trimming free oligosaccharides in the cytosol. Biochem J 2006; 400: 33–41. [DOI] [PMC free article] [PubMed] [Google Scholar]
- 17. Bhalla KN. Microtubule‐targeted anticancer agents and apoptosis. Oncogene 2003; 22: 9075–86. [DOI] [PubMed] [Google Scholar]
- 18. Joprdan MA, Wendell K, Gardiner S, Derry WB, Copp H, Wilson L. Mitotic block induced in Hela cells by low concentrations of paclitaxel (taxol) results in abnormal mitotic exit and apoptotic cell death. Cancer Res 1996; 56: 816–25. [PubMed] [Google Scholar]
- 19. Tao W, South VJ, Zhang Y et al . Induction of apoptosis by an inhibitor of the mitotic kinesin KSP requires both activation of the spindle assembly checkpoint and mitotic slippage. Cancer Cell 2005; 8: 49–59. [DOI] [PubMed] [Google Scholar]
- 20. Beavon IRG. The E‐cadherin–catenin complex in tumor metastasis: structure, function and regulation. Eur J Cancer 2000; 36: 1607–20. [DOI] [PubMed] [Google Scholar]
- 21. Wieser RJ, Oesch F. Contact‐dependent regulation of growth of diploid human fibroblasts is dependent upon the presence of terminal galactose residues on plasma membrane glycoproteins. Exp Cell Res 1988; 176: 80–6. [DOI] [PubMed] [Google Scholar]
- 22. Wieser RJ, Janik‐Schmitt B, Renauer D, Schafer A, Heck R, Oesch F. Contact‐dependent inhibition of growth of normal diploid human fibroblasts by plasma membrane glycoproteins. Biochimie 1988; 70: 1661–71. [DOI] [PubMed] [Google Scholar]
- 23. Modiano JF, Ritt MG, Wojcieszyn J, Smith R 3rd. Growth arrest of melanoma cells is differentially regulated by contact inhibition and serum deprivation. DNA Cell Biol 1999; 18: 357–67. [DOI] [PubMed] [Google Scholar]
- 24. Chantret I, Moore SE. Free oligosaccharide regulation during mammalian protein N‐glycosylation. Glycobiol 2008; 18: 210–24. [DOI] [PubMed] [Google Scholar]
- 25. Rosen FS, Steiner LA, Unanue ER. MacMillan Dictionary of Immunology. London: MacMillan Press, 1989. [Google Scholar]
- 26. Kukuruzinska MA, Lennon K. Protein N‐glycosylation: molecular genetics and functional significance. Crit Rev Oral Biol Med 1998; 9: 415–48. [DOI] [PubMed] [Google Scholar]