

Abstract
Cisplatin is an effective chemotherapeutic agent for ovarian cancer, but the sensitivity of cancers differs in individual cases. Because cisplatin is reported to suppress glucose uptake, we investigated the correlation between glucose uptake and sensitivity to the drug. A fluorescent derivative of D‐glucose, 2‐NBDG (2‐[N‐(7‐nitrobenz‐2‐oxa‐1,3‐diaxol‐4‐yl) amino]‐2‐deoxyglucose), was used to evaluate glucose uptake. Two ovarian cancer cell lines, SKOV‐3 as a relatively resistant line and OVCAR‐3 as a relatively sensitive line, were analyzed. Both cell lines had a decreased number of cells accompanied by cell death 24 h after cisplatin treatment, but not at 3 h. In contrast, glucose uptake was decreased 3 h after high‐dose cisplatin treatment, which correlated with the sensitivity to the drug at 24 h. The protein levels of glucose transporter 1 (GLUT1) did not change with cisplatin treatment. In contrast, the membrane localization of GLUT1 disappeared after cisplatin treatment. Other cisplatin‐resistant cell lines did not show an early decrease in glucose uptake after cisplatin treatment. The early decrease in glucose uptake and later cell death also correlated in cultured cancer cells from ovarian cancer patients. Thus, the decrease in glucose uptake at an early time point after high dose cisplatin treatment reflected cisplatin chemosensitivity in ovarian cancer cells. Measuring glucose uptake might be useful as a rapid evaluation of cisplatin chemosensitivity in ovarian cancer patients. (Cancer Sci 2010)
The standard treatment for advanced ovarian cancer is surgery followed by chemotherapy.( 1 ) First‐line chemotherapy is the combination of a platinum‐based agent, such as cisplatin or carboplatin, with paclitaxel or docetaxel. Although the response rate of advanced disease to first line chemotherapy is generally 70–80%, it is not effective for the remaining patients.( 2 , 3 , 4 ) Even if the first treatment is effective, approximately 70% of patients relapse within 5 years.( 4 ) In the case of a relapse, the response rate is better for patients who relapsed more than 6 months after the last platinum treatment, but the response rate is approximately 30–60%,( 5 ) with the rest of the cases being platinum‐resistant. The response rate to chemotherapy is currently determined by conventional imaging, such as computed tomography (CT) or MRI, after completing several courses of chemotherapy.( 6 ) The development of an assay to predict chemosensitivity before the completion of treatment is imperative to avoiding ineffective chemotherapy.
In the early 1920s, Warburg et al. ( 7 ) reported that cancer cells exhibit an increased rate of glycolysis. Cancer cells tend to use glycolysis for energy production much more than oxidative phosphorylation, even in the presence of sufficient oxygen. In addition, malignant tumors have a wide hypoxic region where glycolysis is more effective than oxidative phosphorylation.( 8 ) Thus, glucose uptake is increased in cancer cells, and an increased expression of glucose transporters, especially GLUT1, is frequently observed in many types of cancers.( 9 ) Using this characteristic of cancer cells, 2‐fluoro‐2‐deoxy‐D‐glucose‐positron emission tomography (FDG‐PET) is widely used in the clinical diagnosis of cancer.( 10 ) FDG‐PET is reportedly also useful for predicting the response to chemotherapy,( 11 , 12 ) including that of gynecological malignancies.( 13 , 14 , 15 ) On the cellular level, various chemotherapeutic drugs suppress glucose uptake in cell lines, including ovarian cancer,( 16 ) hematopoietic precursor cells,( 17 ) gastrointestinal stromal tumor (GIST),( 18 ) breast cancer,( 19 , 20 ) gastric cancer( 21 ) and mesothelioma.( 22 )
Here, we report that glucose uptake decreases over a short period of time after cisplatin treatment in not only ovarian cancer cell lines, but also primary cultured cells derived from patient specimens. The decrease in glucose uptake correlated with drug sensitivity. We propose monitoring the glucose uptake of cultured cancer cells after cisplatin treatment as a novel chemosensitivity assay.
Materials and Methods
Cell lines and cell culture. A human ovarian cancer cell line, SKOV‐3, was purchased from American Type Culture Collection (ATCC, Manassas, VA, USA). Another ovarian cancer cell line, OVCAR‐3, and uterine corpus cancer cell line, SAWANO, were purchased from RIKEN Cell Bank (Tsukuba, Japan). SKOV‐3 was maintained in DMEM/F12 with 10% fetus bovine serum (FBS), OVCAR‐3 in RPMI 1640 with 10% FBS, and SAWANO in minimum essential medium (MEM) with 15% FBS, all with 100 units/mL penicillin and 100 μg/mL streptomycin.
Establishment of cisplatin‐resistant cells. Cisplatin‐resistant cells were developed by continuous exposure to cisplatin, as described previously.( 23 , 24 ) Briefly, SKOV‐3 cells were initially cultured with 2 μg/mL cisplatin, and the dose was gradually increased to 3 μg/mL within 3 weeks. After switching the culture medium several times, 1 week without cisplatin and another with cisplatin, the cells began to grow in the presence of 3 μg/mL cisplatin. The cells are referred to as CisR/SKOV‐3 and were cultured in cisplatin‐free medium for at least 1 week before use. The growth rate of CisR/SKOV‐3 was approximately the same as that of parent SKOV‐3 cells (data not shown).
Reagents. The 1 mg/mL stock solution of cisplatin (Sigma‐Aldrich, St Louis, MO, USA) was prepared by diluting powder cisplatin with distilled water before use. 2‐[N‐(7‐nitrobenz‐2‐oxa‐1,3‐diaxol‐4‐yl) amino]‐2‐deoxyglucose (2‐NBDG) was purchased from Peptide Institute (Ibaraki, Japan). The 2 mM stock solution of 2‐NBDG was prepared in distilled water. Propidium iodide (PI) solution (1 mg/mL) was purchased from Invitrogen (Carlsbad, CA, USA).
Cell count and viability assay. For cell count, we applied trypan blue exclusion assay. An MTS assay (Promega, Madison, WI, USA) was performed according to the manufacturer’s protocol. The details are in Appendix S1.
Apoptosis assay. The number of apoptotic cells was assessed by the Annexin V‐FITC Apoptosis Detection Kit (Bio Vision, Mountain View, CA, USA). The details are in Appendix S1.
Glucose uptake assay. The glucose uptake assay was performed as previously described( 25 ) with some modification. Cells were plated and treated with cisplatin as described in the live cell‐count assay. After cisplatin treatment (3 or 24 h), the supernatant was discarded and the cells were washed with glucose‐free medium. The medium was replaced with 2 mL of glucose‐free DMEM and incubated at 37°C for 15 min. The 2‐NBDG stock solution was added to each dish at a final concentration of 10 μM and incubated for 1 h at 37°C. The concentration of 2‐NBDG was 50 μM for human samples. The incubation medium was removed and the cells washed twice with cold PBS. Cells were trypsinized and resuspended in cold PBS with PI at a final concentration of 2 μg/mL, and maintained at 4°C. The cells were analyzed by flow cytometry and dead cells labeled with PI eliminated from further analysis. A gate was set for the cells with a stronger signal than the frequency peak of 0 μg/mL cisplatin in the histogram and applied to cisplatin‐treated cells. The 2–NBDG uptake was defined as the cell number within the gate divided by the total cell number.
Metabolic analysis. The glucose concentration was measured with Glucose C2 (Wako, Osaka, Japan). Oxygen tension was monitored using a Clark‐type oxygen electrode system (Model 203; Instech Laboratories, Plymouth Meeting, PA, USA). MitoTracker Red CMxROS (Invitrogen) was used for measurement of the mitochondrial membrane potential. The details are in Appendix S1.
Real Time RT‐PCR. Semi‐quantitative RT‐PCR was performed as previously described.( 26 ) The details including primer sequence are in Appendix S1.
Immunocytochemistry. The rabbit anti‐GLUT1 polyclonal antibody (Abcam, Cambridge, UK) was used as the primary antibody. Anti‐rabbit IgG Alexa Fluor 594 (Molecular Probes, Eugene, OR, USA) was used as the secondary antibody. The details are in Appendix S1.
Western blotting. Western blotting was performed as previously described.( 27 ) The primary antibody against GLUT1 was the same that was used in the immunocytochemistry.
Clinical cancer samples. Surgically resected human ovarian cancer specimens were collected from four patients with informed consent according to the ethics board of Osaka Medical Center for Cancer and Cardiovascular Diseases. Three of these specimens (#1, 2, 3) were transplanted into 4∼7‐week‐old NOD/SCID mouse subcutaneously or into the renal capsule. The animal study was approved by the Animal Care Committee of Osaka Medical Center for Cancer and Cardiovascular Diseases. For sample #2, the patient specimen was used directly. After mechanical dissociation, the specimens were enzymatically digested at 37°C for 3 h with 2.8 U of Liberase Blendzyme 3 (Roche, Basel, Switzerland) in 20 mL of serum‐free DMEM/F12. After filtering through a 40‐μm cell strainer (BD), the cells were plated in DMEM/F12 with 10% FBS and cultured for several days. The cells were then treated with cisplatin for 3 h and subjected to further analysis.
Statistical analysis. Statistical analysis was performed using GraphPad Prism 4 (GraphPad Software, San Diego, CA, USA). Significance of the results was tested with the unpaired t‐test or one‐way anova with Tukey test. P < 0.05 was considered significant.
Results
Conventional cell viability assays did not predict eventual cell death after cisplatin treatment. Two ovarian cancer cell lines, SKOV‐3 and OVCAR‐3, were treated with cisplatin. The effect of various doses of cisplatin was assessed at the earlier time point of 3 h, and at the later time point of 24 h. First, cell viability was assessed by trypan blue exclusion assay. A decrease in the number of viable cells was observed 24 h after cisplatin treatment at the relatively low dose of 5 μg/mL in both cell lines (Fig. 1A). The number of dead cells increased in OVCAR‐3 cells at the same low dose, but it only marginally increased in SKOV‐3 cells at the high dose of 20 μg/mL, indicating that cisplatin induced cell death in OVCAR‐3 cells and cell‐cycle arrest in SKOV‐3 cells at the low dose (Fig. S1A). In contrast, no significant difference was seen in the number of viable or dead cells in these cell lines at 3 h, even at the high dose (Figs 1A and S1A).
Figure 1.
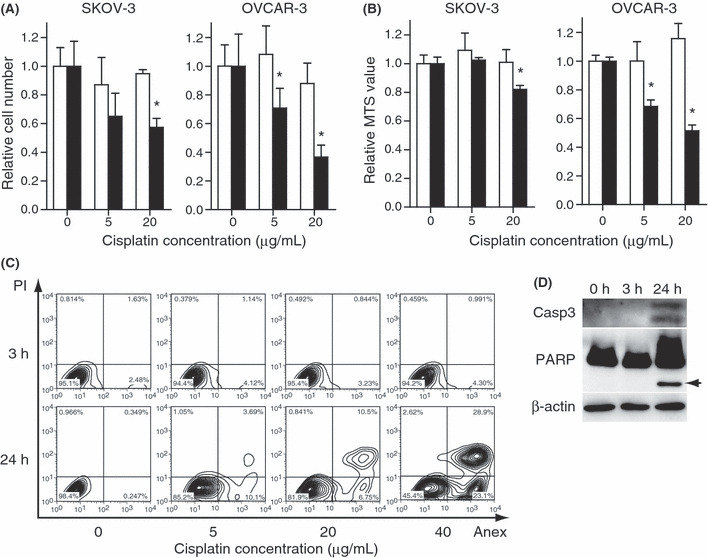
SKOV‐3 cells and OVCAR‐3 cells were treated with cisplatin at the indicated doses. (A) Cell viability assessed by counting the number of viable cells or (B) the MTS assay. The values are relative to the untreated control group. The white bars indicate 3 h and black bars 24 h after cisplatin treatment. The results are the normalized mean values for three independent replicates. The experiments were repeated three times, and representative results are shown. *P < 0.05 compared with the control. (C) The apoptotic events for SKOV‐3 were assessed by flow cytometry with annexin V/PI staining and (D) western blot for the cleaved form of caspase‐3 and poly‐ADP‐ribose polymerase (PARP) (arrow). The cisplatin concentration was 20 μg/mL.
Next, cell viability was assessed by the MTS assay, which reflects the mitochondrial reductase activity.( 28 ) At 24 h, the value decreased marginally in SKOV‐3 cells at the high dose and remarkably in OVCAR‐3 cells at the low dose (Fig. 1B). Again, no difference was observed in these cell lines at 3 h, indicating the mitochondrial reductase activitiy was maintained at the time point. We further assessed cell death by annexin V staining, which is an early marker of apoptosis.( 29 ) At 24 h, the number of early apoptotic cells (annexin V+/PI−) and late apoptotic cells (annexin V+/PI+) increased in a dose‐dependent manner in both cell lines (Fig. 1C and S1B). In contrast, the number of annexin V‐positive cells did not change, even at the higher doses of cisplatin. The cleavage of caspase‐3 and poly‐ADP‐ribose polymerase (PARP) was observed in SKOV‐3 cells at 24 h but not at 3 h (Fig. 1D). Thus, cisplatin impaired the viability of SKOV‐3 and OVCAR‐3 cells in a dose‐dependent manner, although it was impossible to detect the change within a short period of time after cisplatin treatment by conventional methods.
Early decreased glucose uptake after cisplatin treatment correlated with later cell death. To predict later cell death at an early time point after cisplatin treatment, we examined glucose uptake by the cells. Flow cytometry was performed to monitor glucose uptake by detecting the uptake of 2‐NBDG fluorescence within the cells. Simultaneous PI staining was performed to exclude dead cells from the assay. At 3 h after treatment with 20 μg/mL cisplatin, the uptake of 2‐NBDG in SKOV‐3 and OVCAR‐3 cells was significantly decreased (Fig. 2A–C). The SKOV‐3 cells required a higher dose of cisplatin than the OVCAR‐3 cells to achieve a decrease in glucose uptake (Fig. 2C) parallel to the relative resistance of SKOV‐3 cells against cisplatin demonstrated by the cell count and MTS assay (Fig. 1A). The drastic decrease in glucose uptake by OVCAR‐3 cells at 24 h (Fig. 2C) might reflect the severe impairment of cell function before cell death (Fig. S1B). Thus, the early decrease in glucose uptake at a high dose of cisplatin correlated with the sensitivity to the drug in ovarian cancer cell lines. In contrast, the change in the glucose concentration of the culture medium was undetectable 3 h after cisplatin treatment for both cell lines (Fig. 2D). The results indicate that the 2‐NBDG method is useful for detecting the subtle change in cellular glucose uptake.
Figure 2.
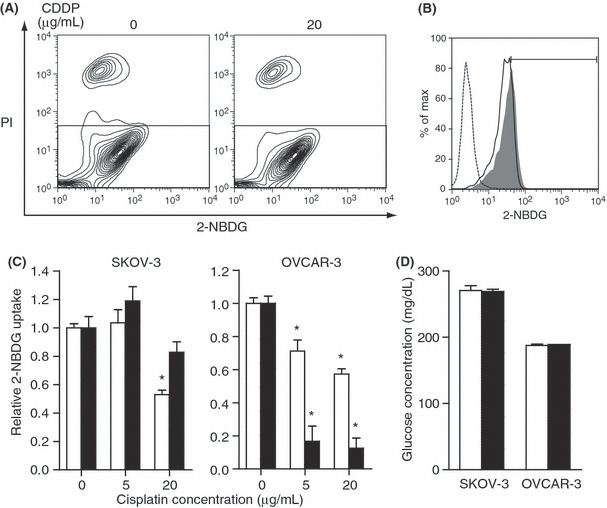
Glucose uptake was evaluated by cellular 2‐[N‐(7‐nitrobenz‐2‐oxa‐1,3‐diaxol‐4‐yl) amino]‐2‐deoxyglucose (2‐NBDG) uptake was determined using flow cytometry. (A) OVCAR‐3 cells were treated with cisplatin at the indicated doses. The scatter plots of the 2‐NBDG and propidium iodide (PI) fluorescence intensity 3 h after treatment are shown. To exclude dead cells, the gate in the lower rectangle was applied for further analysis. (B) Histogram for the same samples in (A). The y‐axis represents the percentage of maximum cell number counts (Max); the x‐axis represents 2‐NBDG fluorescence intensity. The dotted line indicates untreated cells, the gray shading indicates untreated cells with 2‐NBDG, and the solid line indicates cisplatin (20 μg/mL)‐treated cells with 2‐NBDG. In the untreated cells, those showing more 2‐NBDG fluorescence intensity than the histogram peak were gated to represent 2‐NBDG uptake. (C) SKOV‐3 cells and OVCAR‐3 cells were treated with cisplatin at the indicated doses. The 2‐NBDG uptake relative to the untreated group is shown. The white bars indicate 3 h and black bars 24 h after cisplatin treatment. The results are from three independent replicates. The experiments were repeated three times, and representative results are shown. *P < 0.05 compared with the control. (D) Glucose concentration of the medium. Cells were treated with 20 μg/mL cisplatin. The white bars indicate 0 h and black bars 3 h after cisplatin treatment. The results are from three independent replicates. The experiments were repeated three times, and representative results are shown.
Membrane localization of GLUT1 was attenuated at an early time point after cisplatin treatment. To investigate the mechanism of decreased glucose uptake at an early time point after cisplatin treatment, we examined the expression of mRNA encoded by glucose transporter and glycolysis emzymes. The level of GLUT1 expression was decreased 3 h after 20 μg/mL cisplatin treatment of OVCAR‐3 cells but not of SKOV‐3 (Fig. 3A,B). The level of GLUT1 expression was decreased 3 h after 20 μg/mL cisplatin treatment of OVCAR‐3 cells but not of SKOV‐3 (Fig. 3A,B). The GLUT3 gene was not expressed in these cell lines (data not shown). The expression levels of the glycolytic enzymes, phosphofluctokinase‐1 (PFK), and phosphoglycerate kinase (PGK), were also reduced in OVCAR‐3 cells but not in SKOV‐3 cells (Fig. 3A,B). Thus, the expression of genes related to glucose uptake and glycolysis decreased at an early time point after cisplatin treatment only in OVCAR‐3 cells but not in SKOV‐3 cells. Next, we examined the protein levels of GLUT1 by western blotting. The protein levels of GLUT 1 of neither SKOV‐3 nor OVCAR‐3 cells changed at 3 h after 20 μg/mL cisplatin treatment (Fig. 3C). Immunocytochemistry for GLUT1 revealed a strong signal localized at the cytoplasmic membrane in both cell lines. After 3 h cisplatin treatment, the membrane localization of GLUT1 was attenuated (Fig. 3D).
Figure 3.
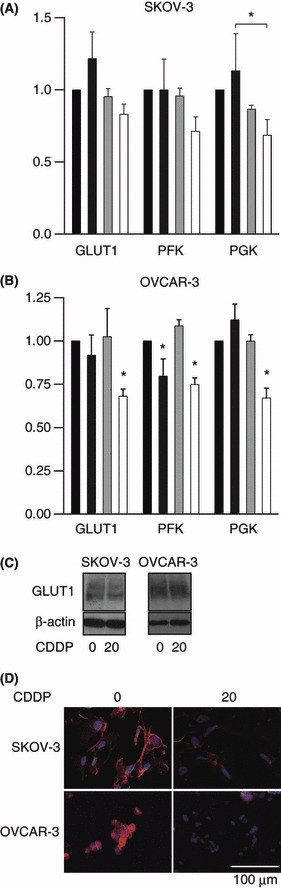
(A,B) Real‐time RT‐PCR of genes related to energy metabolism. (A) SKOV‐3 cells or (B) OVCAR‐3 cells were treated with cisplatin for 3 h. The doses of cisplatin were 0, 5, 10 and 20 μg/mL from left to right. The results are the normalized mean values for three replicates from three independent experiments. *P < 0.05 compared with the control unless otherwise indicated. (C) Western blotting for GLUT1 of SKOV‐3 and OVCAR‐3 cells treated with 20 μg/mL cisplatin for 3 h. (D) Cells were treated with 20 μg/mL cisplatin or water for 3 h and subjected to immunocytochemistry for GLUT‐1 (red). Hoechst 33342 staining (blue) indicates the nucleus. CDDP, cis‐diamminedichloroplatinum(II).
OVCAR‐3 cell oxygen consumption decreased 3 h after cisplatin treatment but mitochondrial membrane potential was not impaired. To investigate the contribution of mitochondrial respiration to the reduction in glucose uptake, we measured the oxygen consumption of OVCAR‐3 cells 3 h after treatment with cisplatin. Oxygen consumption was decreased, even after treatment with 5 μg/mL cisplatin (Fig. 4A). On the other hand, the MTS assay, which reflects the mitochondrial metabolic activity, did not show significant changes at 3 h (Fig. 1B), and the mitochondrial membrane potential at that time point was not decreased with 20 μg/mL cisplatin (Fig. 4B). Taken together, the results indicate that the reduction in oxygen consumption after cisplatin treatment is not likely due to direct mitochondrial impairment, but is a consequence of reduced uptake of glucose, which eventually becomes a substrate of mitochondrial respiration.
Figure 4.
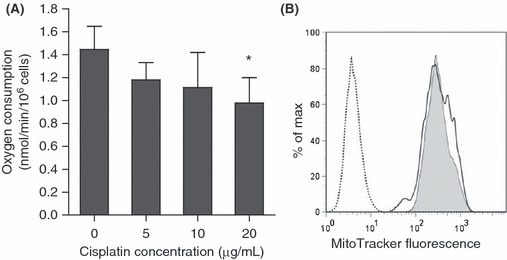
(A) Oxygen consumption of OVCAR‐3 cells after treatment with cisplatin at the indicated doses for 3 h. The results are from three independent replicates. The experiments were repeated three times, and representative results are shown. *P < 0.05 compared with the control. (B) Histogram of mitochondrial membrane potential assessed by MitoTracker 3 h after treatment with 20 μg/mL cisplatin. The y‐axis represents the percentage of maximum cell number counts (Max); the x‐axis represents the mean MitoTracker fluorescence intensity. The dotted line indicates untreated cells. Gray shading indicates untreated cells with the MitoTracker, and the solid line indicates cisplatin (20 μg/mL)‐treated cells with the MitoTracker.
Glucose uptake did not decrease in cisplatin‐resistant cells after cisplatin treatment. To generalize the finding that glucose uptake is useful for predicting cisplatin sensitivity, we examined two resistant cell lines. A uterine corpus cancer cell line, Sawano,( 30 ) is known to be resistant to cisplatin. The sensitivity of Sawano cells to cisplatin was confirmed and compared with OVCAR‐3 cells (Fig. 5A). Glucose uptake did not decrease in Sawano cells 3 h after treatment with 20 μg/mL cisplatin (Fig. 5B). We also generated cisplatin‐resistant SKOV‐3 cells, CisR/SKOV‐3 (Fig. 5C). Glucose uptake did not decrease in CisR/SKOV‐3 cells 3 h after treatment with 20 μg/mL cisplatin (Fig. 5D).
Figure 5.
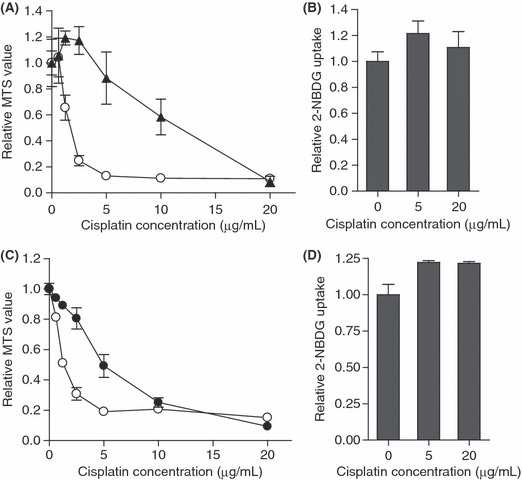
(A) The MTS values relative to untreated control 48 h after treatment with cisplatin at the indicated doses. Sawano cells are indicated by black triangles. The results from the OVCAR‐3 cells are the control indicated by open circles. (B) Sawano cells were treated with cisplatin at the indicated doses and the values of 2‐NBDG uptake relative to the untreated group 3 h after treatment are shown. (C) The MTS values relative to untreated control 72 h after treatment of cisplatin at the indicated doses. CisR/SKOV‐3 cells are indicated by black circles. The results from control SKOV‐3 cells are indicated by open circles. (D) CisR/SKOV‐3 cells were treated with cisplatin at the indicated doses, and the values of 2‐NBDG uptake relative to the untreated group 3 h after treatment are shown. The results are the normalized mean values for three independent replicates. The experiments were repeated three times, and representative results are shown.
Early glucose uptake decrease after cisplatin treatment was only observed in the in vitro cisplatin‐sensitive ovarian cancer cells from patient samples. The ovarian cancer cells from patient samples were subjected to primary culture and treated with cisplatin for 3 h. Glucose uptake was measured by the 2‐NBDG assay. The 2‐NBDG uptake of samples #1 and #2 significantly decreased (Fig. 6A). In contrast, samples #3 and #4 did not exhibit decreased 2‐NBDG uptake after cisplatin treatment. These samples were cultured for several days after cisplatin treatment. Cells from #1 to #2 were eradicated 5 days after treatment (Fig. 5B). In contrast, cancer cells were still viable in cells from #3 to #4 10 days after cisplatin treatment (Fig. 6B). Thus, the early decrease in glucose uptake after cisplatin treatment might be a marker of cisplatin sensitivity in clinical ovarian cancers.
Figure 6.

(A) Ovarian cancer cells from four patients were cultured in vitro, treated with cisplatin at the indicated doses, and the values of 2‐NBDG uptake relative to the untreated group determined 3 h after treatment. The results are the normalized mean values for three independent replicates. *P < 0.05 compared with the control. (B) Phase‐contrast pictures of cells before and after culture with or without 5 μg/mL cisplatin, for 5 days in the case of #1 and #2 and 10 days in the case of #3 and #4.
Discussion
The decrease of glucose uptake and oxygen consumption at an early point after cisplatin treatment was observed. It was not likely to be the consequence of non‐specific events following exposure to the cytotoxic agent, as other cellular function was maintained, including membrane integrity (Fig. 1A), mitochondrial reductase activity (Fig. 1B), mitochondrial membrane potential (Fig. 4B), mRNA levels of house‐keeping genes (TBP in Fig. 3A,B) and GLUT1 protein levels (Fig. 3C). This early decrease in glucose uptake was not observed in cisplatin‐resistant cancer cells. These findings were also applicable to primary cultures of clinical samples.
The molecular mechanism underlying the decrease in glucose uptake after cisplatin treatment is not completely understood. Although cisplatin is known to be a DNA‐damaging agent, <1% of cisplatin binding is to nuclear DNA, most binding is to mitochondrial DNA, phospholipids and other molecules.( 31 ) Indeed, cisplatin is reported to affect multiple cellular components, not just DNA, but also RNA, plasma membrane, microfilaments, mitochondria and endoplasmic reticulum.( 31 ) Consequently, there are many possible mechanisms for an acute decrease in glucose uptake.
We observed a rapid change in the distribution of GLUT1 after cisplatin treatment. The interaction between cisplatin and the plasma membrane might affect GLUT1 distribution. Cisplatin also possibly binds to tublin and inhibits the transport of GLUT1 to the plasma membrane.
We tested the hypothesis that the acute decrease in glucose uptake by cancer cells after cisplatin treatment is a secondary effect of impaired mitochondrial function. Cisplatin accumulates in mitochondria as mentioned above, and cisplatin preferentially binds to voltage‐dependent anion channels (VDAC) that exist on the mitochondrial outer membrane.( 32 ) Therefore, cisplatin could affect mitochondrial function. However, we revealed that the down‐regulation of glucose uptake proceeded changes in the MTS assay, and the mitochondrial membrane potential was not impaired when glucose uptake was already reduced. Mitochondria are not likely to be the primary site of cisplatin effects.
Perturbation of the glycolysis–mitochondria interaction is another possible mechanism. Cancer cells exhibit a high rate of glycolysis,( 7 ) and increased expression of HK2 is thought to be one of the reasons for this high rate. HK2 phosphorylates glucose to produce glucose 6‐phosphate (G‐6‐P) in an ATP‐dependent manner. The majority of HK2 binds to VDAC in order to easily use mitochondrial ATP.( 33 ) Cisplatin reportedly releases HK2 from VDAC,( 34 ) after which glucose phosphorylation might become less efficient, followed by the down‐regulation of glycolysis‐related genes and glucose uptake. In addition, AKT is reportedly activated in cisplatin‐resistant ovarian cancer cells due to the anti‐apoptosis signals. AKT also enhances the binding of VDAC and HK2,( 35 ) which might explain the minimal change in glucose uptake by cisplatin‐resistant cells in our study.
Here, we showed that an early decrease in glucose uptake after cisplatin treatment correlates with later sensitivity to the drug. Although it is possible that the decreased glucose uptake is the direct cause of the cytotoxic effect, the substantial delay in cell death after the reduction suggests that the events are independent. Cellular cisplatin uptake is known to be a critical parameter for sensitivity,( 36 , 37 , 38 , 39 ) and the reduction in glucose uptake might reflect the cisplatin levels in the cell.
An early decrease in glucose uptake after treatment with chemotherapeutic drugs was previously reported in other cancers. For example, decreased glucose uptake was observed in a GIST cell line 2 h after imatinib treatment,( 18 ) a breast cancer cell line 1 h after 5‐FU,( 19 ) and in a breast cancer cell line 4 h after 5‐FU and doxorubicin.( 20 ) To the best of our knowledge, this report is the first to detect early reduced glucose uptake after cisplatin treatment in ovarian cancer.
We used 2‐NBDG, a fluorescent D‐glucose derivative, to monitor glucose uptake. 2‐NBDG was initially developed to distinguish viable Escherichia coli in 1996.( 40 ) The uptake of 2‐NBDG is inhibited by D‐glucose, and it is incorporated into a cell through GLUT.( 41 ) Once inside the cells, 2‐NBDG, like other 2‐DG derivatives, is rapidly phosphorylated at the C‐6 position by hexokinase.( 42 ) Recently, 2‐NBDG was shown to be useful for monitoring glucose uptake in a variety of mammalian and cancer cells.( 41 , 43 , 44 , 45 ) 2‐NBDG is much more sensitive than measuring the change in the glucose concentration of the medium. A radioactive isotope has been used to measure glucose uptake, but 2‐NBDG can be used more safely in the laboratory. In addition, we showed that flow cytometric analysis with 2‐NBDG is useful for detecting subtle and early changes in glucose uptake.
FDG‐PET is widely used in clinical practice to diagnose various cancers. A decrease of the standard uptake value (SUV), which represents glucose uptake, can be detected before the size of the tumor changes in lung cancer and esophageal cancer.( 11 , 46 ) Avril et al. ( 13 ) characterized a group of ovarian cancer patients with decreased SUV after one or three courses of chemotherapy as metabolic responders and non‐responders. The prognosis was better in metabolic responders than non‐responders. These reports suggest that glucose metabolism changes in cancer cells in vivo over a short period of time after chemotherapy, which is compatible with our in vitro results.
Adjuvant therapy improves the prognosis after surgical tumor removal, even in advanced cases,( 1 , 47 , 48 , 49 ) but PET cannot be used to evaluate chemosensitivity after surgery because it is only useful when the tumor size is more than ∼1 cm. An in vitro 2‐NBDG chemosensitivity assay of the surgically removed specimen can provide information for designing adjuvant therapy. Also, the assay can be applied to recurrent diseases or patients with a tumor that cannot be removed surgically; biopsy samples would be enough for the assay. In addition, the assay can be performed within a short period of time, and does not require a long time culture, although culture conditions require further improvement for application to every patient sample.
Disclosure Statement
The authors have no conflict of interest.
Supporting information
Fig. S1. SKOV‐3 cells and OVCAR‐3 cells were treated with cisplatin at the indicated doses. (A) Cell death was assessed by the number of dead cells per total cell number. The values relative to the untreated control group are shown. The white bars indicate 3 h and black bars 24 h after cisplatin treatment. The results are the normalized mean values for three independent replicates. The experiments were repeated three times, and representative results are shown. (B) The apoptotic events in OVCAR‐3 cells were assessed by flow cytometry with annexin V/PI staining.
Appendix S1. Materials and methods.
Please note: Wiley‐Blackwell are not responsible for the content or functionality of any supporting materials supplied by the authors. Any queries (other than missing material) should be directed to the corresponding author for the article.
Supporting info item
Supporting info item
Acknowledgments
The authors thank Toshiko Yasuda for secretary assistance. The research was supported (in part) by a Grant‐in‐Aid for Scientific Research from the Japan Society for the Promotion of Science.
References
- 1. Aebi S, Castiglione M. Epithelial ovarian carcinoma: ESMO clinical recommendations for diagnosis, treatment and follow‐up. Ann Oncol 2008; 19(Suppl 2): ii14–6. [DOI] [PubMed] [Google Scholar]
- 2. Bookman MA, McGuire WP III, Kilpatrick D et al. Carboplatin and paclitaxel in ovarian carcinoma: a phase I study of the Gynecologic Oncology Group. J Clin Oncol 1996; 14: 1895–902. [DOI] [PubMed] [Google Scholar]
- 3. McGuire WP, Hoskins WJ, Brady MF et al. Cyclophosphamide and cisplatin compared with paclitaxel and cisplatin in patients with stage III and stage IV ovarian cancer. N Engl J Med 1996; 334: 1–6. [DOI] [PubMed] [Google Scholar]
- 4. Ozols RF, Bundy BN, Greer BE et al. Phase III trial of carboplatin and paclitaxel compared with cisplatin and paclitaxel in patients with optimally resected stage III ovarian cancer: a Gynecologic Oncology Group study. J Clin Oncol 2003; 21: 3194–200. [DOI] [PubMed] [Google Scholar]
- 5. Markman M, Rothman R, Hakes T et al. Second‐line platinum therapy in patients with ovarian cancer previously treated with cisplatin. J Clin Oncol 1991; 9: 389–93. [DOI] [PubMed] [Google Scholar]
- 6. Therasse P, Eisenhauer EA, Verweij J. RECIST revisited: a review of validation studies on tumour assessment. Eur J Cancer 2006; 42: 1031–9. [DOI] [PubMed] [Google Scholar]
- 7. Warburg O. On respiratory impairment in cancer cells. Science 1956; 124: 269–70. [PubMed] [Google Scholar]
- 8. Brown JM, Giaccia AJ. The unique physiology of solid tumors: opportunities (and problems) for cancer therapy. Cancer Res 1998; 58: 1408–16. [PubMed] [Google Scholar]
- 9. Macheda ML, Rogers S, Best JD. Molecular and cellular regulation of glucose transporter (GLUT) proteins in cancer. J Cell Physiol 2005; 202: 654–62. [DOI] [PubMed] [Google Scholar]
- 10. Bourguet P, Blanc‐Vincent MP, Boneu A et al. Summary of the standards, options and recommendations for the use of positron emission tomography with 2‐[18F]fluoro‐2‐deoxy‐D‐glucose (FDP‐PET scanning) in oncology (2002). Br J Cancer 2003; 89(Suppl 1): S84–91. [DOI] [PMC free article] [PubMed] [Google Scholar]
- 11. Weber WA, Petersen V, Schmidt B et al. Positron emission tomography in non‐small‐cell lung cancer: prediction of response to chemotherapy by quantitative assessment of glucose use. J Clin Oncol 2003; 21: 2651–7. [DOI] [PubMed] [Google Scholar]
- 12. Wieder HA, Brucher B, Zimmermann F et al. Time course of tumor metabolic activity during chemoradiotherapy of esophageal squamous cell carcinoma and response to treatment. J Clin Oncol 2004; 22: 900–8. [DOI] [PubMed] [Google Scholar]
- 13. Avril N, Sassen S, Schmalfeldt B et al. Prediction of response to neoadjuvant chemotherapy by sequential F‐18‐fluorodeoxyglucose positron emission tomography in patients with advanced‐stage ovarian cancer. J Clin Oncol 2005; 23: 7445–53. [DOI] [PubMed] [Google Scholar]
- 14. Nishiyama Y, Yamamoto Y, Kanenishi K et al. Monitoring the neoadjuvant therapy response in gynecological cancer patients using FDG PET. Eur J Nucl Med Mol Imaging 2008; 35: 287–95. [DOI] [PubMed] [Google Scholar]
- 15. Schwarz JK, Grigsby PW, Dehdashti F, Delbeke D. The role of 18F‐FDG PET in assessing therapy response in cancer of the cervix and ovaries. J Nucl Med 2009; 50(Suppl 1): 64S–73S. [DOI] [PubMed] [Google Scholar]
- 16. Minn H, Kangas L, Knuutila V, Paul R, Sipila H. Determination of 2‐fluoro‐2‐deoxy‐D‐glucose uptake and ATP level for evaluating drug effects in neoplastic cells. Res Exp Med (Berl) 1991; 191: 27–35. [DOI] [PubMed] [Google Scholar]
- 17. Zhou R, Vander Heiden MG, Rudin CM. Genotoxic exposure is associated with alterations in glucose uptake and metabolism. Cancer Res 2002; 62: 3515–20. [PubMed] [Google Scholar]
- 18. Cullinane C, Dorow DS, Kansara M et al. An in vivo tumor model exploiting metabolic response as a biomarker for targeted drug development. Cancer Res 2005; 65: 9633–6. [DOI] [PubMed] [Google Scholar]
- 19. Engles JM, Quarless SA, Mambo E, Ishimori T, Cho SY, Wahl RL. Stunning and its effect on 3H‐FDG uptake and key gene expression in breast cancer cells undergoing chemotherapy. J Nucl Med 2006; 47: 603–8. [PubMed] [Google Scholar]
- 20. Direcks WG, Berndsen SC, Proost N et al. [18F]FDG and [18F]FLT uptake in human breast cancer cells in relation to the effects of chemotherapy: an in vitro study. Br J Cancer 2008; 99: 481–7. [DOI] [PMC free article] [PubMed] [Google Scholar]
- 21. Suttie SA, Park KG, Smith TA. [18F]2‐fluoro‐2‐deoxy‐D‐glucose incorporation by AGS gastric adenocarcinoma cells in vitro during response to epirubicin, cisplatin and 5‐fluorouracil. Br J Cancer 2007; 97: 902–9. [DOI] [PMC free article] [PubMed] [Google Scholar]
- 22. Saito Y, Furukawa T, Arano Y, Fujibayashi Y, Saga T. Comparison of semiquantitative fluorescence imaging and PET tracer uptake in mesothelioma models as a monitoring system for growth and therapeutic effects. Nucl Med Biol 2008; 35: 851–60. [DOI] [PubMed] [Google Scholar]
- 23. Behrens BC, Hamilton TC, Masuda H et al. Characterization of a cis‐diamminedichloroplatinum(II)‐resistant human ovarian cancer cell line and its use in evaluation of platinum analogues. Cancer Res 1987; 47: 414–8. [PubMed] [Google Scholar]
- 24. Mabuchi S, Kawase C, Altomare DA et al. mTOR is a promising therapeutic target both in cisplatin‐sensitive and cisplatin‐resistant clear cell carcinoma of the ovary. Clin Cancer Res 2009; 15: 5404–13. [DOI] [PMC free article] [PubMed] [Google Scholar]
- 25. Zou C, Wang Y, Shen Z. 2‐NBDG as a fluorescent indicator for direct glucose uptake measurement. J Biochem Biophys Methods 2005; 64: 207–15. [DOI] [PubMed] [Google Scholar]
- 26. Okuyama H, Krishnamachary B, Zhou YF, Nagasawa H, Bosch‐Marce M, Semenza GL. Expression of vascular endothelial growth factor receptor 1 in bone marrow‐derived mesenchymal cells is dependent on hypoxia‐inducible factor 1. J Biol Chem 2006; 281: 15554–63. [DOI] [PubMed] [Google Scholar]
- 27. Endo H, Murata K, Mukai M, Ishikawa O, Inoue M. Activation of insulin‐like growth factor signaling induces apoptotic cell death under prolonged hypoxia by enhancing endoplasmic reticulum stress response. Cancer Res 2007; 67: 8095–103. [DOI] [PubMed] [Google Scholar]
- 28. Slater TF, Sawyer B, Straeuli U. Studies on succinate‐tetrazolium reductase systems. iii. points of coupling of four different tetrazolium salts. Biochim Biophys Acta 1963; 77: 383–93. [DOI] [PubMed] [Google Scholar]
- 29. Koopman G, Reutelingsperger CP, Kuijten GA, Keehnen RM, Pals ST, Van Oers MH. Annexin V for flow cytometric detection of phosphatidylserine expression on B cells undergoing apoptosis. Blood 1994; 84: 1415–20. [PubMed] [Google Scholar]
- 30. Satoh T, Nishida M, Miyazaki Y et al. [Establishment of a cisplatin‐resistant new human endometrial adenocarcinoma cell line, Sawano cells]. Hum Cell 1995; 8: 67–72. [PubMed] [Google Scholar]
- 31. Rebillard A, Lagadic‐Gossmann D, Dimanche‐Boitrel MT. Cisplatin cytotoxicity: DNA and plasma membrane targets. Curr Med Chem 2008; 15: 2656–63. [DOI] [PubMed] [Google Scholar]
- 32. Yang Z, Schumaker LM, Egorin MJ, Zuhowski EG, Guo Z, Cullen KJ. Cisplatin preferentially binds mitochondrial DNA and voltage‐dependent anion channel protein in the mitochondrial membrane of head and neck squamous cell carcinoma: possible role in apoptosis. Clin Cancer Res 2006; 12: 5817–25. [DOI] [PubMed] [Google Scholar]
- 33. Pedersen PL. Voltage dependent anion channels (VDACs): a brief introduction with a focus on the outer mitochondrial compartment’s roles together with hexokinase‐2 in the “Warburg effect” in cancer. J Bioenerg Biomembr 2008; 40: 123–6. [DOI] [PubMed] [Google Scholar]
- 34. Shulga N, Wilson‐Smith R, Pastorino JG. Hexokinase II detachment from the mitochondria potentiates cisplatin induced cytotoxicity through a caspase‐2 dependent mechanism. Cell Cycle 2009; 8: 3355–64. [DOI] [PMC free article] [PubMed] [Google Scholar]
- 35. Stiles BL. PI‐3‐K and AKT: onto the mitochondria. Adv Drug Deliv Rev 2009; 61: 1276–82. [DOI] [PubMed] [Google Scholar]
- 36. Gately DP, Howell SB. Cellular accumulation of the anticancer agent cisplatin: a review. Br J Cancer 1993; 67: 1171–6. [DOI] [PMC free article] [PubMed] [Google Scholar]
- 37. Kool M, De Haas M, Scheffer GL et al. Analysis of expression of cMOAT (MRP2), MRP3, MRP4, and MRP5, homologues of the multidrug resistance‐associated protein gene (MRP1), in human cancer cell lines. Cancer Res 1997; 57: 3537–47. [PubMed] [Google Scholar]
- 38. Kim A, Enomoto T, Serada S et al. Enhanced expression of Annexin A4 in clear cell carcinoma of the ovary and its association with chemoresistance to carboplatin. Int J Cancer 2009; 125: 2316–22. [DOI] [PubMed] [Google Scholar]
- 39. Blair BG, Larson CA, Safaei R, Howell SB. Copper transporter 2 regulates the cellular accumulation and cytotoxicity of Cisplatin and Carboplatin. Clin Cancer Res 2009; 15: 4312–21. [DOI] [PMC free article] [PubMed] [Google Scholar]
- 40. Yoshioka K, Takahashi H, Homma T et al. A novel fluorescent derivative of glucose applicable to the assessment of glucose uptake activity of Escherichia coli. Biochim Biophys Acta 1996; 1289: 5–9. [DOI] [PubMed] [Google Scholar]
- 41. Yamada K, Nakata M, Horimoto N, Saito M, Matsuoka H, Inagaki N. Measurement of glucose uptake and intracellular calcium concentration in single, living pancreatic beta‐cells. J Biol Chem 2000; 275: 22278–83. [DOI] [PubMed] [Google Scholar]
- 42. Yoshioka K, Saito M, Oh KB et al. Intracellular fate of 2‐NBDG, a fluorescent probe for glucose uptake activity, in Escherichia coli cells. Biosci Biotechnol Biochem 1996; 60: 1899–901. [DOI] [PubMed] [Google Scholar]
- 43. O’Neil RG, Wu L, Mullani N. Uptake of a fluorescent deoxyglucose analog (2‐NBDG) in tumor cells. Mol Imaging Biol 2005; 7: 388–92. [DOI] [PubMed] [Google Scholar]
- 44. Nitin N, Carlson AL, Muldoon T, El‐Naggar AK, Gillenwater A, Richards‐Kortum R. Molecular imaging of glucose uptake in oral neoplasia following topical application of fluorescently labeled deoxy‐glucose. Int J Cancer 2009; 124: 2634–42. [DOI] [PMC free article] [PubMed] [Google Scholar]
- 45. Yamada K, Saito M, Matsuoka H, Inagaki N. A real‐time method of imaging glucose uptake in single, living mammalian cells. Nat Protoc 2007; 2: 753–62. [DOI] [PubMed] [Google Scholar]
- 46. Wieder HA, Beer AJ, Lordick F et al. Comparison of changes in tumor metabolic activity and tumor size during chemotherapy of adenocarcinomas of the esophagogastric junction. J Nucl Med 2005; 46: 2029–34. [PubMed] [Google Scholar]
- 47. Early Breast Cancer Trialists’ Collagorative Group . Effects of chemotherapy and hormonal therapy for early breast cancer on recurrence and 15‐year survival: an overview of the randomised trials. Lancet 2005; 365: 1687–717. [DOI] [PubMed] [Google Scholar]
- 48. Arriagada R, Bergman B, Dunant A, Le Chevalier T, Pignon JP, Vansteenkiste J. Cisplatin‐based adjuvant chemotherapy in patients with completely resected non‐small‐cell lung cancer. N Engl J Med 2004; 350: 351–60. [DOI] [PubMed] [Google Scholar]
- 49. Young RC. Early‐stage ovarian cancer: to treat or not to treat. J Natl Cancer Inst 2003; 95: 94–5. [DOI] [PubMed] [Google Scholar]
Associated Data
This section collects any data citations, data availability statements, or supplementary materials included in this article.
Supplementary Materials
Fig. S1. SKOV‐3 cells and OVCAR‐3 cells were treated with cisplatin at the indicated doses. (A) Cell death was assessed by the number of dead cells per total cell number. The values relative to the untreated control group are shown. The white bars indicate 3 h and black bars 24 h after cisplatin treatment. The results are the normalized mean values for three independent replicates. The experiments were repeated three times, and representative results are shown. (B) The apoptotic events in OVCAR‐3 cells were assessed by flow cytometry with annexin V/PI staining.
Appendix S1. Materials and methods.
Please note: Wiley‐Blackwell are not responsible for the content or functionality of any supporting materials supplied by the authors. Any queries (other than missing material) should be directed to the corresponding author for the article.
Supporting info item
Supporting info item