

Abstract
Despite improvements in the treatment of patients with Ewing family tumors (EFT), the prognosis for patients with advanced disease is still unsatisfactory. Recently, we identified lipase I as an EFT‐associated gene that might be interesting for the development of new immunological or pharmacological treatment strategies. Lipase I is a member of the large protein superfamilies of α/β hydrolases and serine hydrolases. In the present paper we describe high expression of another member of these superfamilies in EFT. By DNA microarray data base mining we found exceptional high expression of α/β hydrolase domain containing 6 (ABHD6) in EFT but not in other sarcomas. Expression of ABHD6 in EFT correlated with expression of another EFT‐associated gene, aristaless. Analysis of ABHD6‐associated GGAA microsatellites revealed shorter microsatellites in EFT with lack of ABHD6 expression. ABHD6 homologues were found in varying chordata but not in other animal species. Based on homology modeling we predicted the 3D‐structure of ABHD6, which shows high similarity with bacterial homoserine transacetylases. High expression of ABHD6 in EFT in comparison to normal tissues and other tumors suggests that ABHD6 might be an interesting new diagnostic or therapeutic target for EFT. However, knock down of ABHD6 in EFT cells did not inhibit tumor cell growth. (Cancer Sci 2009; 100: 2383–2389)
Ewing family tumors (EFT) express highly tumor‐specific fusion proteins as a result of chromosomal rearrangements between members of the TLS‐EWSR1‐TAF15 (TET) protein family and members of the E26 (ETS) family of transcription factors.( 1 ) In most cases translocations between EWSR1 from chromosome 22 and FLI1 from chromosome 11 are present. The resulting fusion protein EWSR1–FLI1 acts as an aberrant transcription factor and is involved in the pathogenesis of EFT. Therefore, downregulation of EWSR1–FLI1 or downstream targets by antisense technologies, RNA intereference, or ribozymes might be interesting strategies for molecular therapy of EFT.( 2 , 3 , 4 ) In addition to EWSR1–FLI1, EFT express other potential targets for future therapeutic developments. Recently, we identified membrane‐associated phospolipase A1 β (lipase I, LIPI) as a highly EFT‐specific cancer/testis antigen.( 5 , 6 ) LIPI was previously identified as phospholipase A1 isoenzyme.( 7 ) By its enzymatic activity, LIPI produces lysophosphatidic acid (LPA), a potent modifier of several tumor‐related functions, such as cell transformation,( 8 ) migration,( 9 ) apoptosis inhibition,( 10 ) inhibition of differentiation,( 11 ) and angiogenesis.( 12 ) In other tumor models inhibition of LPA signaling resulted in tumor inhibition, suggesting that LPA‐producing enzymes like LIPI might be interesting targets for pharmaceutical interventions.( 13 )
Since the first description of lipases in the 19th century( 14 ) several other lipolytic enzymes have been described. Based on sequence and structural similarities it was recognized that these enzymes are part of a large protein family. Moreover, protein structure analysis indicated the existence of a large lipase/esterase superfamily.( 15 ) Members of this superfamily are characterized by a structural motif, the so called α/β fold.( 15 ) The human genome encodes several genes that are known or predicted members of this superfamily. For several of these enzymes the natural substrates and functions are unknown. However, differential expression of α/β hydrolases has been implicated in several physiological and pathophysiological processes, including cancer.( 16 , 17 ) Lipases and other members of the α/β hydrolase superfamily are serine hydrolases that are characterized by a typical GxSxG motif. Strategies for the development of selective inhibitors for this class of enzyme have been developed.( 18 ) Therefore, the selective inhibition of lipases that are involved in cancer pathology seems feasible. For this end, it is necessary to know which lipases are expressed in a given tumor entity. DNA microarrays are powerful tools for analysis of the complete gene expression profile of tumor samples and normal control tissues in a single experiment.( 19 ) A large number of microarray data sets are collected in public databases and can be used for comparative gene expression analysis.( 20 , 21 ) Therefore, we used this approach for the analysis of lipases and related enzymes in EFT.
Materials and Methods
DNA microarray analysis and bioinformatics.
DNA microarray analysis was carried out as described previously.( 5 , 6 ) For a systematic survey of lipases in EFT we prepared two databases by combining published microarray data sets from diverse tumor types and normal tissues. In the first database we combined Affymetrix HG_U133Plus2.0 data sets (Santa Clara, CA, USA) from several normal tissues,( 22 ) glioblastomas,( 23 ) EFT,( 24 , 25 ) and various other tumors from the pediatric testing panel.( 25 ) In total this database contained samples from bone marrow (five samples), lymph node (2), spleen (2), cerebellum (2), cerebral cortex (2), spinal cord (2), skeletal muscle (2), heart atrium (2), coronary artery (2), vein (2), lung (2), liver (2), stomach (2), cecum (2), kidney cortex (2), kidney medulla (2), prostate (3), thyroid (4), adrenal gland (2), ovary (4), testis (3), EFT (18), neuroblastomas (15), glioblastomas (24), rhabdoid tumors (6), osteosarcomas (8), Wilms tumors (4), medulloblastomas (4), rhabdomyosarcomas (12), and ependymomas (4). The results of this analysis were validated by using an independent data base of Affymetrix HG_U133A data sets including again several normal tissues,( 26 ) endothelial cells,( 27 ) mesenchymal stem cells,( 28 ) hematopoietic stem cells,( 29 ) embryonic stem cells,( 30 ) EFT,( 31 , 32 ) glioblastomas,( 33 ) neuroblastomas,( 34 ) and unrelated tumors.( 35 ) These tumors included liposarcomas (10 samples), lipomas (3), leiomyosarcoma (8), rhabdomyosarcomas (7), chondrosarcomas (10), chordomas (4), chondroblastomas (4), chondromyxoid fibromas (4), schwannomas (4), osteosarcomas (11), neurofibromas (4), synovial sarcomas (10), malignant peripheral nerve sheath tumors (4), and fibromatosis (4). Additional data sets from EFT( 36 ) were used for testing the prognostic significance of ABHD6 expression. All data sets from the GEO and ArrayExpress databases( 20 , 21 ) were analyzed by using Microarray Suite 5.0 (Affymetrix, Santa Clara, CA, USA) and scaled to the same target intensity of 500. Protein sequences with homology to human ABHD6 were identified by using BLAST.( 37 ) Prediction of CpG islands, promoter regions, and potential transcription factor binding sites was carried out by using CpGProD,( 38 ) Proscan,( 39 ) and TESS,( 40 ) respectively. Phylogenetic tree analysis and calculation of sequence logos was carried out by using ClustelW( 41 ) and WebLogo,( 42 ) respectively. Homology modeling of the 3D‐structure of ABHD6 was done by using the SwissModel server.( 43 ) Hierarchical cluster analysis and visualization was carried out with the genesis software package.( 44 )
RT‐PCR.
RNA from EFT cell lines, neuroblastoma cell lines, and Epstein–Barr virus (EBV)‐immortalized lymphoblastoid cell lines (LCL) was isolated by using Trizol (Invitrogen, Karlsruhe, Germany) following the manufacturer’s protocol. RNA from rhabdomyosarcoma samples was kindly given to us by B. Schäfer (Zurich, Switzerland). After reverse transcription of 2 μg of this RNA, PCR was carried out as described previously.( 5 , 6 ) The following primer combinations were used: β‐actin (ACTB), 5′‐GGCATCGTGATGGACTCCG‐3′, 5′‐GCTGGAAGGTGG‐ACAGCGA‐3′; α/β hydrolase domain containing 6 (ABHD6), 5′‐GTTGAGGCTGGTCAGGAGTC‐3′, 5′‐AGCAGATGCTGT‐GTGCAGAA‐3′; aristaless (ARX), 5′‐CTGCTGAAACGCAAACAGAG‐3′, 5′‐TTCTGGAACCAGACCTGGAC‐3′; EWSR1‐ERG, 5′‐CCCACTAGTTACCCACCCCA‐3′, 5′‐ATGAGAA‐GGCATATGGCTGG‐3′; EWSR1–FLI1, 5′‐CCCACTAGTTACCCACCCCA‐3′, 5′‐GTGATACAGCTGGCGTTGGCG‐3′; and glyceraldehyde‐3‐phosphate dehydrogenase (GAPDH), 5′‐CCATGGAGAAGGCTGGGG‐3′, 5′‐CAAAGTTGTCATGGATGACC‐3′. Two μL of cDNA was mixed with 2.5 μL 10×Taq‐Buffer, 1.5 μL MgCl2 (25 mM), 0.5 μL dNTP (10 mM), 0.25 μL of both primers (25 μM), 0.2 μL Taq polymerase (5 U/μL), and 17.8 μL water. The PCR conditions were: 94°C, 30’’; 60°C, 30s; 72°C, 45s (ACTB, 25 cycles; ABHD6 and ARX, 35 cycles). PCR products were subjected to agarose gel (1.5%) electrophoresis in the presence of ethidium bromide.
Quantitative RT‐PCR was carried out using the Maxima SYBR Green qPCR Master Mix (Fermentas, St Leon‐Rot, Germany) as described previously.( 6 ) Each reaction was subjected to melting temperature analysis to confirm the presence of the expected amplified products. Specific gene amplification was normalized to GAPDH or ACTB. Target genes and GAPDH and ACTB were amplified with 40 cycles using a Rotor Gene RG‐3000 (Corbett Research, Cambridgeshire, UK) and Rotor‐Gene 6 software.
Analysis of ABHD6 microsatellite length.
Genomic DNA from EFT cell lines was isolated by using the DNeasy Tissue DNA isolation kit (Quiagen, Hilden, Germany) according to the manufacturer’s instructions. ABHD6 microsatellite GGAA repeats were amplified by PCR with primers 5′‐TTTTGGCGTATTCC‐AAATTATTG‐3′ and 5′‐TCGAAATATCAGTTTGGTGAA‐GTC‐3′.( 45 ) PCR products were visualized by agarose gel (3%) electrophoresis.
Cell culture.
Conditionally immortalized LCL P493‐6( 46 ) were kindly given to us by G. W. Bornkamm and G. Laux, Munich. For switching off expression of c‐myc in this cell line, cells were cultured in the presence of 1 μg/mL tetracycline. Functional EBV nuclear antigen 2 (EBNA2) was switched on in these cells by the addition of 1 μM estrogen to the culture medium. Expression of ABHD6 in EFT cell lines was suppressed by using the BLOCK‐iT POL II miR RNAi expression vector kit with EmGFP (Invitrogen) according to manufacturer’s instructions. For this end, the two oligonucleotides 5′‐TGCTGTTTGGAAGGAACTTGACCACAGTTTTGGCCACTGACTGACTGTGGTCATTCCTTCCAAA‐3′ (top strand) and 5′‐CCTGTTTGGAAGGAATGACCACAGTCAGTCAGTGGCCAAAACTGTGGTCAGTTCCTTCCAAAC‐3′ (bottom strand) were annealed and cloned into vector pcDNA6.2‐GW/EmGFP‐miR. SK‐N‐MC cells were transfected with this construct and stable transfectants were selected by treatment with 3 μg/mL blasticidin. Suppression of ABHD6 was monitored by conventional and quantitative RT‐PCR.
Results
EFT express high levels of LIPI, CES1, and ABHD6.
Recently, we identified LIPI as a member of the esterase/lipase superfamily with high expression in EFT.( 5 , 6 ) Like other enzymes of this family, LIPI is characterized by the presence of a highly conserved GxSxG motif. The central serine of this motif can be encoded by the codons AGY or TCN (Fig. 1a). For the characterization of lipases and related enzymes in EFT we analyzed published DNA microarray data from EFT in comparison to normal tissues and other tumor entities. In a first step we compared EFT with a panel of normal tissues of diverse origin. Unsupervised clustering with probe sets corresponding to lipases and related proteins clearly separated EFT from normal tissues (Fig. 1b). Among the lipases with upregulation in EFT in comparison to normal tissues (median signal intensity in EFT > 2.5 × 85th percentile in normal tissues) we found only four genes: LIPI, ABHD6, carboxylesterase 1 (CES1), and lysophospholipase I (LYPLA1). However, LYPLA1 was also highly expressed in other tumor samples and therefore it is not specific for EFT (data not shown). High expression of CES1 was restricted to EFT and normal liver (Fig. 2). In contrast, high expression of LIPI (Fig. 2) and ABHD6 (Fig. 3a) was not found in other tumor types or normal tissues. Similar results were obtained by using an independent set of microarray data (Fig. 3b). High expression of ABHD6 in EFT was confirmed by RT‐PCR (Fig. 4). Signals for ABHD6 were only detected in EFT and not in neuroblastoma (Fig. 4a) or rhabdomyosarcama samples (Fig. 4b). The EFT‐specific EWSR1–ETS fusion transcripts were detectable in all investigated cell lines and primary EFT tumor samples (Supplementary Fig. S1). With the exception of one cell line that expressed EWSR1–ERG transcripts, all other cell lines expressed EWSR1–FLI1 fusion transcripts (Supplementary Fig. S1).
Figure 1.
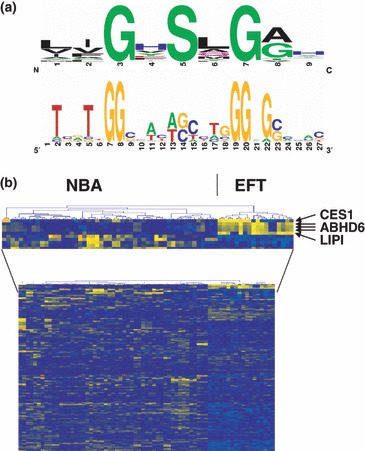
High expression of lipase I (LIPI), carboxylesterase 1 (CES1), and α/β hydrolase domain containing 6 (ABHD6) in Ewing family tumors (EFT). (a) Consensus motif of human members of the α/β hydrolase superfamily. Sequence logos were generated on the basis of the following human α/β hydrolases: ABHD1, ABHD2, ABHD3, ABHD4, ABHD6, ABHD8, ABHD11, CES1, CES2, CES3, DAGLB, LYPLA1, LYPLA2, LIPA, LIPC, LIPD, LIPF, LIPG, LIPH, LIPI, PNLIP, PNLIPRP1, PNLIPRP2, PNLIPRP3, and PSPLA1. Approximately half of these enzymes encode the central serine by the codon AGY. The other enzymes encode this amino acid by the codon TCN. (b) Unsupervised hierarchical clustering of EFT samples and normal tissue samples (NBA). For cluster analysis only probe sets corresponding to lipases and other α/β hydrolases were used. EFT was clearly separated from NBA. The position of probe sets corresponding to CES1, ABHD6, and LIPI is indicated. See Materials and Methods for a description of NBA samples.
Figure 2.
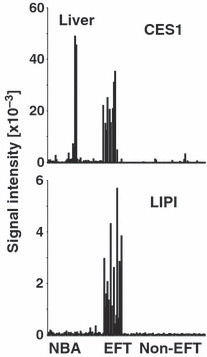
High expression of lipase I (LIPI) and CES1 in Ewing family tumors (EFT) but not in other tumor samples. Presented are signal intensities (Affymetrix HG_U133Plus2.0 microarrays) from normal tissues (NBA), EFT, and other tumor samples (Non‐EFT) for CES1 and LIPI. Whereas LIPI is only detectable in EFT, CES1 is highly expressed in normal liver. See Materials and Methods for a description of NBA and tumor samples.
Figure 3.
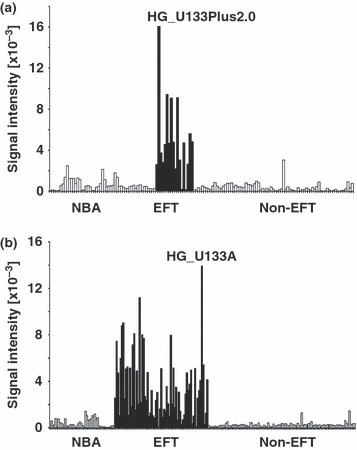
High expression of α/β hydrolase domain containing 6 (ABHD6) in Ewing family tumors (EFT) but not in other tumor samples. (a) Presented are signal intensities (Affymetrix HG_U133Plus2.0 microarrays) from normal tissues (NBA), EFT, and other tumor samples (Non‐EFT) for ABHD6. (b) High expression of ABHD6 in an independent database based on Affymetrix HG_U133A microarray data. See Materials and Methods for a description of NBA and tumor samples.
Figure 4.
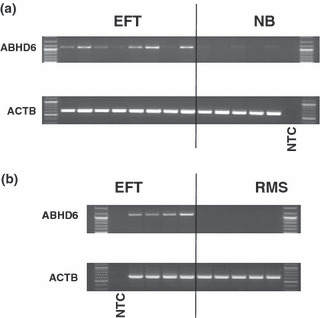
Validation of high expression of α/β hydrolase domain containing 6 (ABHD6) in Ewing family tumors (EFT) cell lines by RT‐PCR. Presented are results from RT‐PCR analysis with ABHD6‐specific primers. β‐Actin (ACTB) was used as control. NTC, no template control. (a) ABHD6 was only detected in EFT cell lines, not in neuroblastoma (NB) cell lines. The following cell lines were analyzed: (from left to right) A673, SK‐N‐MC, RD‐ES, SK‐ES, TC‐32, STA‐ET8, TC‐71, TTC‐466 (EFT), SiMa, SH‐SY5Y, IMR5, Kelly, and CHP‐134 (neuroblastoma). (b) ABHD6 was only detected in primary EFT samples, not in rhabdomyosarcoma (RMS) samples.
Gene structure and evolution of ABHD6.
High expression of ABHD6 in EFT might be driven by the oncogenic EWSR1–FLI1 oncofusion transcription factor. Therefore, we analyzed the DNA sequence of the intergenic region between ABHD6 and the neighboring deoxyribonuclease I‐like 3 (DNASE1L3) locus. In this DNA segment we found only one CpG island surrounding the first exon of ABHD6 (Fig. 5a). In silico promotor prediction suggested that this region also contains the ABHD6 promotor immediately upstream of the transcriptional start site. We analyzed this predicted promoter for transcription factor binding sites. Indeed, the sequence contains a consensus binding site for ETS transcription factors (Fig. 5a). However, not all EFT express ABHD6. Moreover, DNA microarray data from EFT after RNA interference‐mediated EWSR1–FLI1 knock down( 31 ) or from transgenic cells expressing EWSR1–FLI1( 24 ) showed only marginal regulation of ABHD6 expression by EWSR1–FLI1, whereas other RNA interference experiments( 47 ) suggested that ABHD6 might be regulated by EWSR1–ETS oncofusion proteins (data not shown). Recently, it was suggested that EWSR1–FLI1 regulates gene expression by binding to GGAA microsatellite sequences.( 45 ) Because the upstream region of ABHD6 contains such sequences, we tested the hypothesis that the length of these GGAA repeat sequences might be responsible for differences in the expression of ABHD6 between different cell lines. Indeed, we observed that these repeats are significantly shorter in cell lines that lack expression of ABHD6 than in cell lines with high expression of ABHD6 (Fig. 5b). Interestingly, DNA microarray analysis revealed a correlation between the expression of ABHD6 and ARX (Fig. 6a), an EFT‐associated gene and marker for neuronal differentiation.( 5 ) This correlation could be proven by conventional and quantitative RT‐PCR (Fig. 6b,c). With the exception of the Kelly cell line, ARX was not detectable in neuroblastoma cell lines (Fig. 6b,c). In EBV‐immortalized LCL, expression of ABHD6 is upregulated by EBV nuclear antigen 2 activity.( 48 ) Therefore, we tested whether in these cells ABHD6 expression correlated with ARX expression. In contrast to ABHD6, we found no upregulation of ARX in LCL after switching on EBV nuclear antigen 2 function. However, expression of ABHD6 in these cells was also weak in comparison to EFT cell lines (Supplementary Fig. S2). The presence of the conserved GxSxG motif in ABHD6 suggests that ABHD6 is a serine hydrolase. However, enzymatic activity has not been described for this protein. Because serine hydrolases are characterized by a catalytic triad consisting of serine, histidine, and aspartate (or glutamate), we analyzed the sequence of ABHD6 for the presence of this catalytic triad. In a first step we identified ABHD6‐homologous genes in other species. We identified highly conserved ABHD6 homologues in several chordate species from acrania to mammals (Supplementary Figs S3,S4). All of these proteins encode the central serine of the GxSxG motif by the codon TCN and are characterized by the consensus sequence GTSMGG (Supplementary Fig. S3B). In addition to this motif, all identified ABHD6 homologues share highly conserved aspartate and histidine residues (Supplementary Figs S4,S5). In order to identify the residues of the catalytic triad we carried out homology modeling of the structure of human ABHD6. When we used the complete sequence of human ABHD6, homology modeling failed as a consequence of a lack of available structures from proteins with high sequence homology to ABHD6 (data not shown). However, when we used only the evolutionarily conserved sequence starting with Met48 of human ABHD6 we were able to model the catalytic domain of ABHD6 (Supplementary Fig. S6). This model indicated that the conserved residues Ser148, Asp278, and His306 form the catalytic triad. Interestingly, the predicted structure shows high similarity with bacterial homoserine transacetylases (Supplementary Fig. S6).
Figure 5.
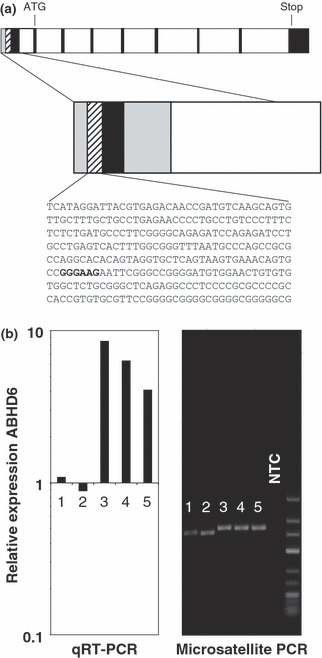
Analysis of putative EWSR1–ETS binding sites upstream of α/β hydrolase domain containing 6 (ABHD6). (a) Analysis of the human ABHD6 locus. Exons are shown as filled boxes, introns as open boxes. The predicted CpG island is shown in gray, the predicted promoter region is shaded. The position of the start codon, stop codon, and probable ETS binding site are indicated. (b) Analysis of ABHD6‐associated GGAA repeats in Ewing family tumor (EFT) cell lines. Length of ABHD6‐associated microsatellites from five EFT cell lines (1, SK‐ES; 2, TC71; 3, A673; 4, SK‐N‐MC; 5, RD‐ES) was visualized by RT‐PCR as described in Materials and Methods (right panel). In parallel, expression of ABHD6 was quantified by quantitative RT‐PCR (qRT‐PCR) in the same cell lines (left panel). For comparative gene expression analysis the signal of one neuroblastoma cell line (not shown) was set as one. NTC, no template control.
Figure 6.
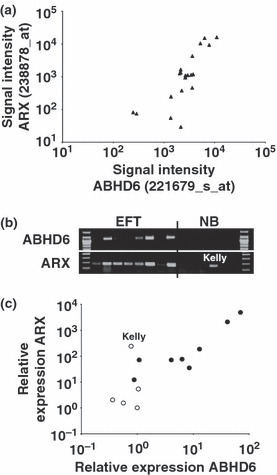
Correlation of expression of α/β hydrolase domain containing 6 (ABHD6) and aristaless (ARX) in Ewing family tumors (EFT). (a) Presented are signal intensities (Affymetrix HG_U133Plus2.0 microarrays) for ABHD6 and ARX in EFT cell lines. (b) Presented are results from conventional RT‐PCR analysis with ABHD6‐ and ARX‐specific primers. ABHD6 signals were only detectable in EFT cell lines, with the exception of the neuroblastoma cell line Kelly, ARX was also detectable only in EFT. β‐Actin (ACTB) was used as a control (not shown). The following cell lines were analyzed: (from left to right) A673, SK‐N‐MC, RD‐ES, SK‐ES, TC‐32, STA‐ET8, TC‐71, TTC‐466 (EFT), SiMa, SH‐SY5Y, IMR5, Kelly, and CHP‐134 (neuroblastoma). (c) Presented are results from quantitative RT‐PCR analysis with ABHD6‐ and ARX‐specific primers. EFT samples are presented as filled circles, neuroblatsoma samples as open circles (same samples as in [b]). For comparative gene expression analysis GAPDH was used as a calibrator. The signal of one neuroblastoma cell line was set as one. The position of the Kelly cell line is indicated.
Lack of prognostic significance of ABHD6 expression in EFT.
The physiological function of ABHD6 is unknown. After knock down of ABHD6 in EFT cell lines we observed only marginal differences in the growth velocity (Fig. 7), apoptosis rate, and cell morphology (data not shown). Knock down of ABHD6 was validated by RT‐PCR (Fig. 7a). Knock down was specific for ABHD6 as indicated by unchanged expression of LIPI in treated cells (Fig. 7a). In addition, we found no correlation between ABHD6 expression in EFT samples and the prognosis of these patients (Supplementary Fig. S7).
Figure 7.
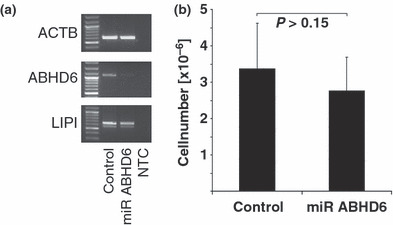
Knock down of α/β hydrolase domain containing 6 (ABHD6) in Ewing family tumor (EFT) cells did not influence cell growth. ABHD6 was knocked down in the EFT cell line SK‐N‐MC as described in Materials and Methods. Cells transfected with empty vector were used as a control. (a) After selection of stable blasticidin‐resistant cells, expression of ABDH6 was analyzed by RT‐PCR. β‐Actin (ACTB) and lipase I (LIPI) served as controls. (b) The same cells as in (a) were placed at a cell density of 1 × 10⁵/mL in 10 mL culture medium. After 4 days cells were harvested and counted. Bars represent means and standard deviations from three independent experiments. In each experiment cell numbers were determined in quadruplicate. miR ABHD6, cells transfected with ABHD6‐specific RNAi expression vector.
Discussion
In addition to LIPI,( 5 , 6 ) in the present paper we describe high expression of two other members of the α/β hydrolase family in EFT: CES1 and ABHD6. DNA microarray data indicate that, in contrast to LIPI and ABHD6, CES1 expression is induced by transgenic expression of EWSR1–FLI1 in mesenchymal stem cells.( 24 ) EFT cells with high expression of CES1 (cell line A673) also showed reduced expression of this enzyme after knockdown of EWSR1–FLI1.( 31 ) Surprisingly, not all EFT cell lines express CES1, suggesting that EWSR1–FLI1 alone is not sufficient for induction of CES1. Similar observations indicate that ABHD6 is not a direct target of EWSR1–FLI1. The predicted promoter of human ABHD6 contains a consensus ETS binding site (Fig. 5b) and in A673 cells knock down of EWSR1–FLI1 resulted in reduced expression of ABHD6.( 31 ) However, the EWSR1–FLI1‐dependence of ABHD6 expression in EFT cell lines showed great variability( 31 , 47 ) and transgenic expression of EWSR1–FLI1 in mesenchymal stem cells was not sufficient for induction of ABHD6.( 24 ) Moreover, not all EFT cell lines and tumor biopsies express ABHD6. Further evidence against a direct induction of ABHD6 by binding of EWSR1–FLI1 to the ABHD6 promotor comes from the observation that the ETS binding site in the ABHD6 promotor is not conserved between the human and chimpanzee promoter (data not shown). On the other site, it was shown that EWSR1–FLI1 not only binds the typical ETS transcription factor binding site but also GGAA microsatellites.( 45 ) These microsatellites are enriched in the proximity of genes (like ABHD6) known to be highly expressed in EFT. Our observation that ABHD6‐associated microsatellites of ABHD6‐negative EFT cell lines are shorter than microsatellites from EFT cell lines with high expression of ABHD6 supports the concept of microsatellite‐dependent gene regulation by EWSR1–ETS fusion proteins. It was suggested that polymorphisms in microsatellites from EWSR1–FLI1‐regulated genes might be EFT susceptibility candidates.( 45 ) We did not observe a prognostic significance of ABHD6 expression in EFT. Moreover, knock down of ABHD6 did not inhibit cell proliferation. Therefore it seems unlikely that ABHD6‐associated GGAA repeats are susceptibility loci. Our observation of a high correlation between ABHD6 and ARX expression suggests that ABHD6 expression in EFT might be associated with neuronal differentiation, which is a key feature of EFT.( 4 ) DNA microarray data did not indicate upregulation of ARX by transgenic expression of EWSR1–FLI1 (data not shown).The expression pattern of ARX in the central nervous system suggested that ARX is expressed only in specialized cell types.( 49 ) The mouse homolog Arx is a marker for neuronal stem cells.( 50 )
The physiological function of ABHD6 is unclear. The high conservation of ABHD6 in chordata suggests that the physiological function of ABHD6 is important for these species. In the mammalian brain ABHD6 can hydrolyze the endocannabinoid 2‐arachidonoylglycerol (2‐AG).( 51 ) However, ABHD6 activity contributes only less than 5% to 2‐AG hydrolysis in the brain.( 51 ) It remains possible that ABHD6 metabolizes other substrates in vivo. The predicted structure of ABHD6 has high similarity with bacterial serine transacetylases. A special feature of these enzymes is the presence of a catalytic tunnel that is formed by juxtaposition of two domains.( 52 ) Bacterial transacetylases are involved in methionine metabolism and, in contrast to most other α/β domain‐containing enzymes, these enzymes are not hydrolases.( 52 ) It has been suggested that the amino acids lining the catalytic tunnel favor transacetylation instead of hydrolysis. Interestingly, we found ABHD6‐related genes only in chrordata. It seems possible that the close relationship between bacterial transacetylases and chordate ABHD6 is an example of lateral genomic.( 53 , 54 ) The ability to synthesize methionine was lost in animals early in evolution. If ABHD6 was transferred into the chordate genome via lateral gene transfer, this gene could have acquired new functions.
Based on sequence alignments with other members of the ABHD family it was suggested that ABHD6 has a relatively close phylogenetic relationship with ABHD4 and ABHD5.( 17 ) Our data did not support a close phylogenetic relationship between ABHD6 and these two other ABHD members. All serine hydrolases can be divided into two groups based on the codon used for the central serine of the GxSxG motif. One group used the codon AGY, the other group used the codon TCN. This has lead to the hypothesis that the codons of the active serine have emerged by convergent evolution from different ancestors.( 55 ) In all investigated species we found that the active serine is encoded by the codon TCN (Supplementary Fig. S3). In contrast, the active serine of human ABHD4 is encoded by the codon AGT.( 56 ) ABHD5 is not a serine hydrolase but has an asparagine at the position of the usual serine in the sequence GHNGL.( 57 ) This asparagine of human ABHD5 is encoded by the codon AAC, which can be derived from the typical serine hydrolase codon AGY by a simple G → A transition. Interestingly, bacterial transacetylases also use the codon TCN for that active serine.( 58 , 59 ) Together with the lack of ABHD6‐homologous genes in non‐chordata, this observation strengthens the hypothesis of horizontal gene transfer.
The exceptional high expression of ABHD6 in EFT suggests that ABHD6 might be a new diagnostic and/or therapeutic target for treatment of EFT. Compared with LIPI,( 6 ) ABHD6 has lower specificity for EFT. Whether quantitative RT‐PCR applications can be used for discrimination between EFT and other tumor entities has to be determined. Inhibitors with specificity for ABHD6 have been described.( 18 ) 2‐AG has been shown to inhibit tumor invasion in other models.( 60 ) However, because not all EFT express ABHD6 and EFT cells showed no growth inhibition after knock down of ABHD6, this enzyme seems not to be required for EFT growth. EFT express other enzymes, such as LIPI, which might compensate for the absent ABHD6 (Fig. 7a). Independent of the pathophysiological function of ABHD6, ABHD6 expression in tumors may allow the development of new therapies based on immunological effector mechanisms( 61 ) or the enzyme‐mediated activation of prodrugs.( 62 )
Supporting information
Fig. S1. Detection of EWSR1–ETS fusion transcripts in Ewing family tumor (EFT) samples. Presented are representative results from RT‐PCR analysis of EFT cell lines (fromleft to right: SK‐N‐MC, A673, RD‐ES, SK‐ES, STA‐ET8, TC‐32, TC‐71, TTC‐466). β‐Actin (ACTB) was used as a control. NTC, no template control. With the exception ofone cell line that was positive for EWS–ERG, all cell lines expressedEWSR1–FLI1 (fusion types I or II).
Fig. S2. AbsenceAUTHOR: Please check that this figureis correct as it looks to be corrupted of aristaless (ARX) expression inEpstein–Barr virus‐immortalized B cells. Presented are results fromquantitative RT‐PCR analysis with α/β hydrolase domain containing 6 (ABHD6)‐ and ARX‐specific primers. The Ewing family tumor (EFT) cell line SK‐N‐MC wasused as a positive control. The neuroblastoma cell line SH‐SY5Y was used as anegative control and set as one. Squares and triangles represent conditionallyEpstein–Barr virus‐immortalized B cell line P493‐6. Squares represent cellscultured in the presence of estrogen (+E). Triangles represent cells culturedin the absence of estrogen (w/o E). Open squares and triangles represent P493‐6cells cultured in the presence of tetracycline (MYC off), closed squares andtriangles represent P493‐6 cells cultured in the absence of tetracycline (MYCon).
Fig. S3. Phylogenetic analysis of α/β hydrolasedomain containing 6 (ABHD6) in chordata. (A) Neighbor joiningtree of protein sequences of ABHD6 in different species. (B) Consensusmotif of ABHD6 homologues. Sequence logos were generated on the basis ofABHD6 sequences from the species shown in (A). All of these enzymesencode the central serine by the codon TCN.
Fig. S4. Alignment of α/β hydrolase domain containing6 (ABHD6) protein sequences from different chordate species. Presented aresequences of the catalytic core of ABHD6 in the indicated species (from Tyr58to Phe323 of the human ABHD6 sequence). Alignment was calculated with ClustelWand visualized with GeneDoc (Nicholas, K. B., and Nicholas H.B. Jr. 1997. GeneDoc: a tool for editing and annotation multiple sequence alignements. Distributedby the author).
Fig. S5. Sequence logo of α/β hydrolase domaincontaining 6 (ABHD6). The sequence logo was created on the basis of thesequences from Supplementary Fig. S4. The amino acids of thecatalytic triad are indicated by boxes.
Fig. S6. Predicted structure of human α/β hydrolasedomain containing 6 (ABHD6). The structure of human ABHD6 (green) was predictedby homology modeling using the α/β hydrolase homoserine transacetylase of H. influenzae (white) as model. The aminoacids of the catalytic triad are indicated. Both structures are characterizedby the presence of two domains. The contact zone between both domains forms a“catalytic tunnel”. See Discussion in the text.
Fig. S7. Expression of α/β hydrolase domaincontaining 6 (ABHD6) in Ewing family tumor (EFT) samples did not correlate withclinical prognosis. Presented are signal intensities from two data sets (HG_U133A microarrays: Schaefer KL, Eisenacher M, Braun Y et al.Eur J Cancer. 2008; 44: 699‐709; HG_U133Plus2.0 microarrays: Scotlandi K, Remondini D, Castellani G et al. J Clin Oncol 2009; 27: 2209–16) including patients with (closed bars) and without (open bars) relapses. Bars at the right represent means and standard deviations.
Please note: Wiley‐Blackwell are not responsible for the content or functionality of any supporting materials supplied by the authors. Any queries (other than missing material) should be directed to the corresponding author for the article.
Supporting info item
Supporting info item
Supporting info item
Supporting info item
Supporting info item
Supporting info item
Supporting info item
References
- 1. Janknecht R. EWS‐ETS oncoproteins: the linchpins of Ewing tumors. Gene 2005; 363: 1–14. [DOI] [PubMed] [Google Scholar]
- 2. Maksimenko A, Lambert G, Bertrand JR, Fattal E, Couvreur P, Malvy C. Therapeutic potentialities of EWS‐Fli‐1 mRNA‐targeted vectorized antisense oligonucleotides. Ann NY Acad Sci 2003; 1002: 72–7. [DOI] [PubMed] [Google Scholar]
- 3. Toub N, Bertrand JR, Tamaddon A et al. Efficacy of siRNA nanocapsules targeted against the EWS‐Fli1 oncogene in Ewing sarcoma. Pharm Res 2006; 23: 892–900. [DOI] [PubMed] [Google Scholar]
- 4. Richter GH, Plehm S, Fasan A et al. EZH2 is a mediator of EWS/FLI1 driven tumor growth and metastasis blocking endothelial and neuro‐ectodermal differentiation. Proc Natl Acad Sci USA 2009; 106: 5324–9. [DOI] [PMC free article] [PubMed] [Google Scholar]
- 5. Staege MS, Hutter C, Neumann I et al. DNA microarrays reveal relationship of Ewing family tumors to both endothelial and fetal neural crest‐derived cells and define novel targets. Cancer Res 2004; 64: 8213–21. [DOI] [PubMed] [Google Scholar]
- 6. Foell JL, Hesse M, Volkmer I, Schmiedel BJ, Neumann I, Staege MS. Membrane‐associated phospholipase A1 beta (LIPI) is a Ewing tumour‐associated cancer/testis antigen. Pediatr Blood Cancer 2008; 51: 228–34. [DOI] [PubMed] [Google Scholar]
- 7. Hiramatsu T, Sonoda H, Takanezawa Y et al. Biochemical and molecular characterization of two phosphatidic acid‐selective phospholipase A1s, mPA‐PLA1alpha and mPA‐PLA1beta. J Biol Chem 2003; 278: 49438–47. [DOI] [PubMed] [Google Scholar]
- 8. Taghavi P, Verhoeven E, Jacobs JJ et al. In vitro genetic screen identifies a cooperative role for LPA signaling and c‐Myc in cell transformation. Oncogene 2008; 27: 6806–16. [DOI] [PubMed] [Google Scholar]
- 9. Kim EK, Yun SJ, Do KH et al. Lysophosphatidic acid induces cell migration through the selective activation of Akt1. Exp Mol Med 2008; 40: 445–52. [DOI] [PMC free article] [PubMed] [Google Scholar]
- 10. Chen J, Baydoun AR, Xu R et al. Lysophosphatidic acid protects mesenchymal stem cells against hypoxia and serum deprivation‐induced apoptosis. Stem Cells 2008; 26: 135–45. [DOI] [PubMed] [Google Scholar]
- 11. Dottori M, Leung J, Turnley AM, Pébay A. Lysophosphatidic acid inhibits neuronal differentiation of neural stem/progenitor cells derived from human embryonic stem cells. Stem Cells 2008; 26: 1146–54. [DOI] [PubMed] [Google Scholar]
- 12. Rivera‐Lopez CM, Tucker AL, Lynch KR. Lysophosphatidic acid (LPA) and angiogenesis. Angiogenesis 2008; 11: 301–10. [DOI] [PMC free article] [PubMed] [Google Scholar]
- 13. Tanyi JL, Morris AJ, Wolf JK et al. The human lipid phosphate phosphatase‐3 decreases the growth, survival, and tumorigenesis of ovarian cancer cells: validation of the lysophosphatidic acid signaling cascade as a target for therapy in ovarian cancer. Cancer Res 2003; 63: 1073–82. [PubMed] [Google Scholar]
- 14. Bernard C. Rechérches sur les usages du sac pancréatique dans la digestion. Acad Sci 1849; 28: 249–85. [Google Scholar]
- 15. Ollis DL, Cheah E, Cygler M et al. The alpha/beta hydrolase fold. Protein Eng 1992; 5: 197–211. [DOI] [PubMed] [Google Scholar]
- 16. Cottrell S, Jung K, Kristiansen G et al. Discovery and validation of 3 novel DNA methylation markers of prostate cancer prognosis. J Urol 2007; 177: 1753–8. [DOI] [PubMed] [Google Scholar]
- 17. Li F, Fei X, Xu J, Ji C. An unannotated alpha/beta hydrolase superfamily member, ABHD6 differentially expressed among cancer cell lines. Mol Biol Rep 2009; 36: 619–26. [DOI] [PubMed] [Google Scholar]
- 18. Li W, Blankman JL, Cravatt BF. A functional proteomic strategy to discover inhibitors for uncharacterized hydrolases. J Am Chem Soc 2007; 129: 9594–5. [DOI] [PubMed] [Google Scholar]
- 19. Staege MS, Hattenhorst UE, Neumann UE, Hutter C, Foja S, Burdach S. DNA‐microarrays as tools for the identification of tumor specific gene expression profiles: applications in tumor biology, diagnosis and therapy. Klin Padiatr 2003; 215: 135–9. [DOI] [PubMed] [Google Scholar]
- 20. Barrett T, Troup DB, Wilhite SE et al. NCBI GEO: mining tens of millions of expression profiles – database and tools update. Nucleic Acids Res 2007; 35: D760–5. [DOI] [PMC free article] [PubMed] [Google Scholar]
- 21. Parkinson H, Kapushesky M, Kolesnikov N et al. ArrayExpress update – from an archive of functional genomics experiments to the atlas of gene expression. Nucleic Acids Res 2009; 37: D868–72. [DOI] [PMC free article] [PubMed] [Google Scholar]
- 22. Hever A, Roth RB, Hevezi PA et al. Gene expression analyses reveal molecular relationships among 20 regions of the human CNS. Neurogenetics 2006; 7: 67–80. [DOI] [PubMed] [Google Scholar]
- 23. Günther HS, Schmidt NO, Phillips HS et al. Glioblastoma‐derived stem cell‐enriched cultures form distinct subgroups according to molecular and phenotypic criteria. Oncogene 2008; 27: 2897–909. [DOI] [PubMed] [Google Scholar]
- 24. Miyagawa Y, Okita H, Nakaijima H et al. Inducible expression of chimeric EWS/ETS proteins confers Ewing’s family tumor‐like phenotypes to human mesenchymal progenitor cells. Mol Cell Biol 2008; 28: 2125–37. [DOI] [PMC free article] [PubMed] [Google Scholar]
- 25. Neale G, Su X, Morton CL et al. Molecular characterization of the pediatric preclinical testing panel. Clin Cancer Res 2008; 14: 4572–83. [DOI] [PMC free article] [PubMed] [Google Scholar]
- 26. Ge X, Yamamoto S, Tsutsumi S et al. Interpreting expression profiles of cancers by genome‐wide survey of breadth of expression in normal tissues. Genomics 2005; 86: 127–41. [DOI] [PubMed] [Google Scholar]
- 27. Viemann D, Goebeler M, Schmid S et al. TNF induces distinct gene expression programs in microvascular and macrovascular human endothelial cells. J Leukoc Biol 2006; 80: 174–85. [DOI] [PubMed] [Google Scholar]
- 28. Markov V, Kusumi K, Tadesse MG et al. Identification of cord blood‐derived mesenchymal stem/stromal cell populations with distinct growth kinetics, differentiation potentials, and gene expression profiles. Stem Cells Dev 2007; 16: 53–73. [DOI] [PubMed] [Google Scholar]
- 29. Perez‐Iratxeta C, Palidwor G, Porter CJ et al. Study of stem cell function using microarray experiments. FEBS Lett 2005; 579: 1795–801. [DOI] [PubMed] [Google Scholar]
- 30. Barberi T, Willis LM, Socci ND, Studer L. Derivation of multipotent mesenchymal precursors from human embryonic stem cells. PLoS Med 2005; 2: e161. [DOI] [PMC free article] [PubMed] [Google Scholar]
- 31. Tirode F, Laud‐Duval K, Prieur A, Delorme B, Charbord P, Delattre O. Mesenchymal stem cell features of Ewing tumors. Cancer Cell 2007; 11: 421–9. [DOI] [PubMed] [Google Scholar]
- 32. Schaefer KL, Eisenacher M, Braun Y et al. Microarray analysis of Ewing’s sarcoma family of tumours reveals characteristic gene expression signatures associated with metastasis and resistance to chemotherapy. Eur J Cancer 2008; 44: 699–709. [DOI] [PubMed] [Google Scholar]
- 33. Phillips HS, Kharbanda S, Chen R et al. Molecular subclasses of high‐grade glioma predict prognosis, delineate a pattern of disease progression, and resemble stages in neurogenesis. Cancer Cell 2006; 9: 157–73. [DOI] [PubMed] [Google Scholar]
- 34. Albino D, Scaruffi P, Moretti S et al. Identification of low intratumoral gene expression heterogeneity in neuroblastic tumors by genome‐wide expression analysis and game theory. Cancer 2008; 113: 1412–22. [DOI] [PubMed] [Google Scholar]
- 35. Henderson SR, Guiliano D, Presneau N et al. A molecular map of mesenchymal tumors. Genome Biol 2005; 6: R76. [DOI] [PMC free article] [PubMed] [Google Scholar]
- 36. Scotlandi K, Remondini D, Castellani G et al. Overcoming resistance to conventional drugs in Ewing sarcoma and identification of molecular predictors of outcome. J Clin Oncol 2009; 27: 2209–16. [DOI] [PubMed] [Google Scholar]
- 37. Altschul SF, Madden TL, Schäffer AA et al. Gapped BLAST and PSI‐BLAST: a new generation of protein database search programs. Nucleic Acids Res 1997; 25: 3389–402. [DOI] [PMC free article] [PubMed] [Google Scholar]
- 38. Ponger L, Mouchiroud D. CpGProD: identifying CpG islands associated with transcription start sites in large genomic mammalian sequences. Bioinformatics 2002; 18: 631–3. [DOI] [PubMed] [Google Scholar]
- 39. Prestridge DS. Predicting Pol II promoter sequences using transcription factor binding sites. J Mol Biol 1995; 249: 923–32. [DOI] [PubMed] [Google Scholar]
- 40. Schug J, Overton GC. Using TESS to predict transcription factor binding sites in DNA sequence. Curr Protoc Bioinform 2008; 21: 2.6.1–6.15. doi: 10.1002/0471250953.bi0206s21.x. [DOI] [PubMed] [Google Scholar]
- 41. Thompson JD, Higgins DG, Gibson TJ. CLUSTAL W: improving the sensitivity of progressive multiple sequence alignment through sequence weighting, position‐specific gap penalties and weight matrix choice. Nucleic Acids Res 1994; 22: 4673–80. [DOI] [PMC free article] [PubMed] [Google Scholar]
- 42. Crooks GE, Hon G, Chandonia JM, Brenner SE. WebLogo: a sequence logo generator. Genome Res 2004; 14: 1188–90. [DOI] [PMC free article] [PubMed] [Google Scholar]
- 43. Arnold K, Bordoli L, Kopp J, Schwede T. The SWISS‐MODEL Workspace: a web‐based environment for protein structure homology modelling. Bioinformatics 2006; 22: 195–201. [DOI] [PubMed] [Google Scholar]
- 44. Sturn A, Quackenbush J, Trajanoski Z. Genesis: cluster analysis of microarray data. Bioinformatics 2002; 18: 207–8. [DOI] [PubMed] [Google Scholar]
- 45. Guillon N, Tirode F, Boeva V, Zynovyev A, Barillot E, Delattre O. The oncogenic EWS‐FLI1 protein binds in vivo GGAA microsatellite sequences with potential transcriptional activation function. PLoS ONE 2009; 4: e4932. [DOI] [PMC free article] [PubMed] [Google Scholar]
- 46. Schuhmacher M, Staege MS, Pajic A et al. Control of cell growth by c‐Myc in the absence of cell division. Curr Biol 1999; 9: 1255–8. [DOI] [PubMed] [Google Scholar]
- 47. Kauer M, Ban J, Kofler R et al. A molecular function map of Ewing’s sarcoma. PLoS ONE 2009; 4: e5415. [DOI] [PMC free article] [PubMed] [Google Scholar]
- 48. Maier S, Staffler G, Hartmann A et al. Cellular target genes of Epstein–Barr virus nuclear antigen 2. J Virol 2006; 80: 9761–71. [DOI] [PMC free article] [PubMed] [Google Scholar]
- 49. Ohira R, Zhang YH, Guo W et al. Human ARX gene: genomic characterization and expression. Mol Genet Metab 2002; 77: 179–88. [DOI] [PubMed] [Google Scholar]
- 50. Colombo E, Galli R, Cossu G, Gécz J, Broccoli V. Mouse orthologue of ARX, a gene mutated in several X‐linked forms of mental retardation and epilepsy, is a marker of adult neural stem cells and forebrain GABAergic neurons. Dev Dyn 2004; 231: 631–9. [DOI] [PubMed] [Google Scholar]
- 51. Blankman JL, Simon GM, Cravatt BF. A comprehensive profile of brain enzymes that hydrolyze the endocannabinoid 2‐arachidonoylglycerol. Chem Biol 2007; 14: 1347–56. [DOI] [PMC free article] [PubMed] [Google Scholar]
- 52. Mirza IA, Nazi I, Korczynska M, Wright GD, Berghuis AM. Crystal structure of homoserine transacetylase from Haemophilus influenzae reveals a new family of alpha/beta‐hydrolases. Biochemistry 2005; 44: 15768–73. [DOI] [PubMed] [Google Scholar]
- 53. Doolittle WF. Lateral genomics. Trends Cell Biol 1999; 9: M5–8. [PubMed] [Google Scholar]
- 54. Keeling PJ, Palmer JD. Horizontal gene transfer in eukaryotic evolution. Nat Rev Genet 2008; 9: 605–18. [DOI] [PubMed] [Google Scholar]
- 55. Brenner S. The molecular evolution of genes and proteins: a tale of two serines. Nature 1988; 334: 528–30. [DOI] [PubMed] [Google Scholar]
- 56. Simon GM, Cravatt BF. Endocannabinoid biosynthesis proceeding through glycerophospho‐N‐acyl ethanolamine and a role for alpha/beta‐hydrolase 4 in this pathway. J Biol Chem 2006; 281: 26465–72. [DOI] [PubMed] [Google Scholar]
- 57. Lefèvre C, Jobard F, Caux F et al. Mutations in CGI‐58, the gene encoding a new protein of the esterase/lipase/thioesterase subfamily, in Chanarin–Dorfman syndrome. Am J Hum Genet 2001; 69: 1002–12. [DOI] [PMC free article] [PubMed] [Google Scholar]
- 58. Harrison A, Dyer DW, Gillaspy A et al. Genomic sequence of an otitis media isolate of nontypeable Haemophilus influenzae: comparative study with H. influenzae serotype d, strain KW20. J Bacteriol 2005; 187: 4627–36. [DOI] [PMC free article] [PubMed] [Google Scholar]
- 59. Normand P, Lapierre P, Tisa LS et al. Genome characteristics of facultatively symbiotic Frankia sp. strains reflect host range and host plant biogeography. Genome Res 2007; 17: 7–15. [DOI] [PMC free article] [PubMed] [Google Scholar]
- 60. Endsley MP, Aggarwal N, Isbell MA et al. Diverse roles of 2‐arachidonoylglycerol in invasion of prostate carcinoma cells: location, hydrolysis and 12‐lipoxygenase metabolism. Int J Cancer 2007; 121: 984–91. [DOI] [PMC free article] [PubMed] [Google Scholar]
- 61. Kessler JH, Melief CJ. Identification of T‐cell epitopes for cancer immunotherapy. Leukemia 2007; 21: 1859–74. [DOI] [PubMed] [Google Scholar]
- 62. Rooseboom M, Commandeur JN, Vermeulen NP. Enzyme‐catalyzed activation of anticancer prodrugs. Pharmacol Rev 2004; 56: 53–102. [DOI] [PubMed] [Google Scholar]
Associated Data
This section collects any data citations, data availability statements, or supplementary materials included in this article.
Supplementary Materials
Fig. S1. Detection of EWSR1–ETS fusion transcripts in Ewing family tumor (EFT) samples. Presented are representative results from RT‐PCR analysis of EFT cell lines (fromleft to right: SK‐N‐MC, A673, RD‐ES, SK‐ES, STA‐ET8, TC‐32, TC‐71, TTC‐466). β‐Actin (ACTB) was used as a control. NTC, no template control. With the exception ofone cell line that was positive for EWS–ERG, all cell lines expressedEWSR1–FLI1 (fusion types I or II).
Fig. S2. AbsenceAUTHOR: Please check that this figureis correct as it looks to be corrupted of aristaless (ARX) expression inEpstein–Barr virus‐immortalized B cells. Presented are results fromquantitative RT‐PCR analysis with α/β hydrolase domain containing 6 (ABHD6)‐ and ARX‐specific primers. The Ewing family tumor (EFT) cell line SK‐N‐MC wasused as a positive control. The neuroblastoma cell line SH‐SY5Y was used as anegative control and set as one. Squares and triangles represent conditionallyEpstein–Barr virus‐immortalized B cell line P493‐6. Squares represent cellscultured in the presence of estrogen (+E). Triangles represent cells culturedin the absence of estrogen (w/o E). Open squares and triangles represent P493‐6cells cultured in the presence of tetracycline (MYC off), closed squares andtriangles represent P493‐6 cells cultured in the absence of tetracycline (MYCon).
Fig. S3. Phylogenetic analysis of α/β hydrolasedomain containing 6 (ABHD6) in chordata. (A) Neighbor joiningtree of protein sequences of ABHD6 in different species. (B) Consensusmotif of ABHD6 homologues. Sequence logos were generated on the basis ofABHD6 sequences from the species shown in (A). All of these enzymesencode the central serine by the codon TCN.
Fig. S4. Alignment of α/β hydrolase domain containing6 (ABHD6) protein sequences from different chordate species. Presented aresequences of the catalytic core of ABHD6 in the indicated species (from Tyr58to Phe323 of the human ABHD6 sequence). Alignment was calculated with ClustelWand visualized with GeneDoc (Nicholas, K. B., and Nicholas H.B. Jr. 1997. GeneDoc: a tool for editing and annotation multiple sequence alignements. Distributedby the author).
Fig. S5. Sequence logo of α/β hydrolase domaincontaining 6 (ABHD6). The sequence logo was created on the basis of thesequences from Supplementary Fig. S4. The amino acids of thecatalytic triad are indicated by boxes.
Fig. S6. Predicted structure of human α/β hydrolasedomain containing 6 (ABHD6). The structure of human ABHD6 (green) was predictedby homology modeling using the α/β hydrolase homoserine transacetylase of H. influenzae (white) as model. The aminoacids of the catalytic triad are indicated. Both structures are characterizedby the presence of two domains. The contact zone between both domains forms a“catalytic tunnel”. See Discussion in the text.
Fig. S7. Expression of α/β hydrolase domaincontaining 6 (ABHD6) in Ewing family tumor (EFT) samples did not correlate withclinical prognosis. Presented are signal intensities from two data sets (HG_U133A microarrays: Schaefer KL, Eisenacher M, Braun Y et al.Eur J Cancer. 2008; 44: 699‐709; HG_U133Plus2.0 microarrays: Scotlandi K, Remondini D, Castellani G et al. J Clin Oncol 2009; 27: 2209–16) including patients with (closed bars) and without (open bars) relapses. Bars at the right represent means and standard deviations.
Please note: Wiley‐Blackwell are not responsible for the content or functionality of any supporting materials supplied by the authors. Any queries (other than missing material) should be directed to the corresponding author for the article.
Supporting info item
Supporting info item
Supporting info item
Supporting info item
Supporting info item
Supporting info item
Supporting info item