

Abstract
Endoscopic biopsy prior to chemotherapy provides an opportunity for studying biomarkers to predict the overall survival in gastric cancer patients. This prospective study was performed to identify prognostic biomarkers in patients with unresected gastric cancer. Fifty‐nine cases of chemotherapy‐naive metastatic gastric cancer were enrolled in this study. A microarray analysis was performed using 40 biopsy samples to identify candidate genes whose expressions might be correlated with the overall survival. After adjusting for clinical covariates based on a multivariate analysis, the identified genes were validated using real‐time reverse transcription polymerase chain reaction (RT‐PCR) analysis in 19 independent validation samples. Ninety‐eight candidate genes whose expression levels were significantly correlated with the overall survival were identified using a microarray analysis based on a proportional hazards model (P < 0.005). Multivariate analysis was performed to assess 10 of these genes, and the results yielded a statistical significance level for DACH1 and PDCD6. We further evaluated these two genes in independent samples using real‐time RT‐PCR and found that lower mRNA expression levels of PDCD6 were correlated significantly with a poor overall survival. We identified PDCD6 as a prognostic biomarker in patients with unresected gastric cancer using endoscopic biopsy samples. Our PCR‐based single gene prediction strategy successfully predicted the overall survival and may lead to a better understanding of this disease subgroup. (Cancer Sci 2008; 99: 2193–2199)
Over the past two decades, various anticancer agents have been examined for their efficacy against gastric cancer, including 5‐fluorouracil (5‐FU) and 5‐FU‐based drugs, taxanes, CPT‐11 and cisplatin, all administered either as monotherapy or in combination regimens;( 1 ) however, the median survival time (MST) of these patients remains at only approximately 7 months.( 2 , 3 ) In a recent randomized phase III trial examining oral S‐1 monotherapy and cisplatin plus irinotecan combination therapy, the response rates to both S‐1 and to the cisplatin plus irinotecan combination therapy were approximately 50%, indicating that around half of the patients did not respond to chemotherapy,( 4 , 5 , 6 , 7 ) and the MST in both the arms was less than 1 year.( 8 ) Thus, the prognosis of patients with gastric cancer remains poor.
The commonly recognized prognostic factors in cases of unresectable gastric cancer are the performance status, presence/absence of liver metastases, presence/absence of peritoneal metastases and the serum levels of alkaline phosphatase.( 9 ) Many molecular biomarkers have been also investigated for their potential to predict the outcome in hypothesis‐based studies. Several studies have shown that the mRNA levels and immunohistochemical staining intensity of thymidylate synthase (TS) in gastric cancers treated with fluorouracil are associated with the response and survival; in addition, the excision repair cross‐complementing (ERCC)1 gene expression level has been shown to be associated with the clinical outcome in patients treated with cisplatin.( 10 , 11 ) HER2 expression has also been reported to be a prognostic marker in cases of differentiated gastric cancer.( 12 , 13 ) Mutation of p53 and high p53 protein expression, and high expression levels of urokinase‐plasminogen activator, xanthine oxidoreductase, claudin‐4, vascular endothelial growth factor, interleukin‐8 and cyclin E have all been correlated with poor survival.( 13 , 14 , 15 , 16 , 17 , 18 , 19 ) In terms of epigenetic alterations, reduced expression of acetylated histone H4 or DNA methylation of CDH1 and RAR‐β have been shown to be correlated with tumor invasiveness and the tumor metastasizing potential.( 20 , 21 )
On the other hand, the recent introduction of the microarray technology has enabled significant genes to be identified almost throughout the genome using a hypothesis‐free approach. The possibility of performing genome‐wide searches is a major advantage, and such searches may be the only way to discover genes that would otherwise be unlikely to even be suggested as candidates. In gastric cancer, biopsy samples of the primary lesions can be easily obtained by endoscopy prior to treatment; however, few prospective biomarker studies using endoscopic biopsy samples to predict patient outcome have been performed to date. Therefore, we conducted a prospective study to identify biomarkers for predicting survival in patients with unresected metastatic gastric cancer.
Materials and Methods
Patients and samples. The eligible subjects in this study were patients with histologically confirmed, untreated and metastatic stage IV gastric cancer between 20 and 75 years of age. Additional inclusion criteria included an Eastern Cooperative Oncology Group performance status of 0–2. The exclusion criteria included history of prior chemotherapy or major surgery. All patients received chemotherapy using a 5‐FU‐based regimen (5‐FU alone, S1 alone, 5‐FU + methotrexate, 5‐FU + cisplatin, or S1 + cisplatin) or a CPT‐11 plus cisplatin regimen. Sixty‐five gastric cancer patients were enrolled in the study. Of these, two were excluded because of insufficient RNA quantities extracted from their biopsy specimens, and four were excluded because of the poor RNA quality. Thus, samples from the remaining 59 patients were analyzed. The survival time was followed after the patients were initiated on chemotherapy. This study was approved by the Institutional Review Board of the National Cancer Center Hospital, and written informed consent was obtained from all the patients.
The endoscopic biopsy samples collected were immediately placed in an RNA stabilization solution (Isogen; Nippongene, Tokyo, Japan) and stored at –80°C. Other biopsy samples obtained from the same location were reviewed by a pathologist to confirm the presence of tumor cells. The RNA extraction method and the quality check protocol have been described previously.( 22 )
Study design. This prospective study was started in July 2003 and enrollment was completed in November 2006 at the National Cancer Center Hospital. Fifty‐nine gastric cancer samples were evaluated in this study. The samples were divided into a training set (n = 40) and a validation set (n = 19; 2:1) using computer‐generated randomization (Microsoft Office Excel, Microsoft, Redmond, WA, USA). A microarray analysis was performed using the training set of 40 samples, and candidate genes whose expressions were correlated with the overall survival were identified. Multivariate analysis was performed to adjust the expression of 10 of these candidate genes for clinical features. Finally, the significant genes were evaluated in an independent set of 19 samples and survival was predicted using the results of real‐time reverse transcription polymerase chain reaction (RT‐PCR) analyses.
Real‐time RT‐PCR. Real‐time RT‐PCR was performed for 10 genes: DACH1 (dachshund homolog 1, NM_004392); EGFR (epidermal growth factor receptor, NM_005228); MT1X (metallothionein 1X, NM_005952); YWHAE (tyrosine 3‐monooxygenase/tryptophan 5‐monooxygenase activation protein, epsilon polypeptide, NM_006761); GPX3 (glutathione peroxidase 3, NM_002084); PDCD6 (programmed cell death 6, NM_013232); WDR33 (WD repeat domain 33, NM_018383); C14orf43 (chromosome 14 open reading frame 43, NM_194278); MYLIP (myosin regulatory light chain interacting protein, NM_013262); and GKAP1 (G kinase anchoring protein 1, NM_025211). Glyceraldehyde 3 phosphate dehydrogenase (GAPD, NM_002046) was used to normalize the expression levels in the subsequent quantitative analyses. RNA was converted to cDNA using a GeneAmp RNA PCR Core kit (Applied Biosystems, Foster City, CA). The transcripts were quantified using the Power SYBR Green PCR Master Mix (Applied Biosystems) and 7900HT Fast Real‐time PCR system (Applied Biosystems) and reported relative to the GAPD expression levels. The PCR conditions were as follows: one cycle of denaturation at 95°C for 10 min, followed by 40 cycles at 95°C for 15 s and 60°C for 60 s. To amplify the target genes, the following primers were purchased from Takara (Yotsukaichi, Japan): DACH1‐FW, 5′‐AAG GGC TGC TAA AGC AAT CAG G‐3′, and DACH1‐RW, 5′‐CTT TGT GGC AAA GCG ACA TTA GG‐3′; EGFR‐FW, 5′‐GGT GCG AAT GAC AGT AGC ATT ATG A‐3′, and EGFR‐RW, 5′‐AAA TGG GCT CCT AAC TAG CTG AAT C‐3′; MT1X‐FW, 5′‐TTG ATC GGG AAC TCC TGC TTC T‐3′, and MT1X‐RW, 5′‐ACA CTT GGC ACA GCC GAC A‐3′; GPX3‐FW, 5′‐ATG CCT ACA GGT ATG CGT GAT TG‐3′, and GPX3‐RW, 5′‐TGC AGG CAC ACA GAT GGT ACA‐3′; PDCD6‐FW, 5′‐TCA AGG CCA GAC TAG ATC AGC CTA A‐3′, and PDCD6‐RW, 5′‐GCT GGG ATG AGG CAC ATG AC‐3′; YWHAE‐FW, 5′‐GGC AGA ATT TGC CAC AGG AA‐3′, and YWHAE‐RW, 5′‐ACC TAA GCG AAT AGG ATG CGT TG‐3′; WDR33‐FW, 5′‐ATG CAT GGG CTC TGT CAG TTT C‐3′, and WDR33‐RW, 5′‐GGC TGA TAC CGG GAC AAC ACT AC‐3′; C14orf43‐FW, 5′‐CAG ACT GGC AAG CCT AAC TCC ATA‐3′, and C14orf43‐RW, 5′‐CAA GGC TGT TCC TGT GCT CTG‐3′; MYLIP‐FW, 5′‐ACG TCT ATC TGC CAA CGC ACA C‐3′, and MYLIP‐RW, 5′‐CAG TTC ATG GAA ACA TGC CAA GTC‐3′; GKAP1‐FW, 5′‐TTG CGA ATA AGT TTC GGA GCA TC‐3′, and GKAP1‐RW, 5′‐GCC ACT GCC ACT ATC CAC TTG TAA‐3′; GAPD‐FW, 5′‐GCA CCG TCA AGG CTG AGA AC‐3′, and GAPD‐RW, 5′‐ATG GTG GTG AAG ACG CCA GT‐3′.
Oligonucleotide microarray study. The microarray procedure was performed according to the Affymetrix protocols (Santa Clara, CA). In brief, the total RNA extracted from the tumor samples was analyzed using an Agilent 2100 Bioanalyzer (Agilent Technologies, Waldbronn, Germany) for quality check, and cRNA was synthesized using the GeneChip 3′‐Amplification Reagents One‐Cycle cDNA Synthesis Kit (Affymetrix). The labeled cRNA were then purified and used for construction of the probes. Hybridization was performed using the Affymetrix GeneChip HG‐U133 Plus 2.0 array for 16 h at 45°C. The signal intensities were measured using a GeneChip Scanner3000 (Affymetrix) and converted to numerical data using the GeneChip Operating Software, ver. 1 (Affymetrix).
Statistical analysis. The microarray analysis was performed using the BRB Array Tools software ver. 3.3.0 (http://linus.nci.nih.gov/BRB‐ArrayTools.html) developed by Dr Richard Simon and Dr Amy Peng. In brief, a log base 2 transformation was applied to the raw microarray data, and global normalization was used to calculate the median over the entire array. Genes were excluded if the percentage of data missing or filtered out exceeded 20%. Genes that passed the filtering criteria were then considered for further analysis. We computed a statistical significance level (P < 0.005) for each gene based on a univariate proportional hazards model.
To adjust the expression of 10 genes (DACH1, EGFR, MT1X, YWHAE, GPX3, PDCD6, WDR33, C14orf43, MYLIP and GKAP1) for clinical features (age, sex, performance status [PS], number of metastatic sites, received chemotherapy), clinical data and the normalized microarray expression data of the 10 genes were imported into SAS software ver. 9.1.3 (SAS Institute, Cary, NC, USA) and a Cox regression model was constructed for multivariate analysis against each of the variables. The study groups were divided into two groups based on each of the clinical features: age (<65 or ≥65 years), sex (male or female), PS (0 or ≥1), number of metastatic sites (<3 or ≥3), chemotherapy (5‐FU‐based or CPT11 + CDDP) and expression levels of 10 genes). P < 0.05 was considered significant.
Results
Identification of 98 candidate prognosis‐related genes using a microarray analysis. The univariate analysis of clinical features including age (<65 or ≥65 years), sex, PS (0 or ≥1), number of metastatic sites (1, 2 or ≥3) and received chemotherapy (5‐FU‐based or CPT11 + CDDP) were performed for 40 microarray samples (Table 1). There were no significant differences between any of the two groups divided according to age, sex, number of metastatic sites or received chemotherapy; however, significant differences were noted between the two groups divided according to PS (P = 0.048).
Table 1.
Univariate analysis of clinical features
| Variable | No. of patients | MST (days) | P‐value (log–rank test) |
|---|---|---|---|
| Age (years) | |||
| ≥65 | 16 | 235 | 0.454 |
| <65 | 24 | 250 | |
| Sex | |||
| Male | 29 | 243 | 0.926 |
| Female | 11 | 267 | |
| PS | |||
| ≥1 | 24 | 182 | 0.048 |
| 0 | 16 | 309 | |
| Metastasis | |||
| 1, 2 | 10 | 137 | 0.102 |
| ≥3 | 30 | 261 | |
| Chemotherapy | |||
| 5‐FU‐based | 26 | 245 | 0.594 |
| CPT11 + CDDP | 14 | 240 | |
MST, median survival time; PS, performance status.
To identify the candidate prognosis‐related genes from amongst over 47 000 transcripts, a microarray analysis was performed for a training set of 40 samples. A total of 21 308 genes passed the filtering criteria and were further analyzed. Ninety‐eight genes were significantly correlated with survival, according to a Cox proportional hazards model (P < 0.005) (Table 2). Fifty‐nine genes were protective genes (hazard ratio, <1), and 39 were risk genes (hazard ratio >1).
Table 2.
Prognosis‐related genes identified using microarray analysis
| P‐value | Hazard ratio | Description | Gene | Probe set | Pass | PCR | ||
|---|---|---|---|---|---|---|---|---|
| 0.0002 | 1.8 | Epidermal growth factor receptor | EGFR | 201984_s_at | 2 | PCR | 1 | 0.1 |
| 0.0005 | 0.1 | DEAD (Asp‐Glu‐Ala‐Asp) box polypeptide 54 | DDX54 | 219111_s_at | 2 | 0.1 | ||
| 0.0005 | 0.5 | Chimerin (chimaerin) 2 | CHN2 | 213385_at | 3 | 0.1 | ||
| 0.0005 | 6.1 | Ubiquitin‐like domain containing CTD phosphatase 1 | UBLCP1 | 227413_at | 4 | 0.2 | ||
| 0.0006 | 0.5 | PTK2 protein tyrosine kinase 2 | PTK2 | 241387_at | 5 | 0.2 | ||
| 0.0008 | 3.4 | Der1‐like domain family, member 2 | DERL2 | 218333_at | 6 | 0.2 | ||
| 0.0008 | 0.5 | Leucine rich repeat containing 14 | LRRC14 | 32062_at | 7 | 0.2 | ||
| 0.0009 | 4.5 | WD repeat domain 33 | WDR33 | 222763_s_at | PCR | 8 | 0.2 | |
| 0.0009 | 0.1 | Rhomboid domain containing 3 | RHBDD3 | 217622_at | 9 | 0.2 | ||
| 0.001 | 0.3 | Myosin regulatory light chain interacting protein | MYLIP | 228098_s_at | 3 | PCR | 10 | 0.2 |
| 0.0013 | 4.7 | Chromosome 14 open reading frame 43 | C14orf43 | 225980_at | PCR | 11 | 0.2 | |
| 0.0013 | 0.2 | BCL6 co‐repressor | BCOR | 223915_at | 12 | 0.2 | ||
| 0.0013 | 0.5 | MAD1 mitotic arrest deficient‐like 1 (yeast) | MAD1L1 | 233921_s_at | 13 | 0.2 | ||
| 0.0013 | 4.9 | Chromosome 14 open reading frame 109 | C14orf109 | 213246_at | 14 | 0.2 | ||
| 0.0014 | 4.2 | Hypothetical protein LOC124512 | LOC124512 | 225808_at | 15 | 0.2 | ||
| 0.0014 | 5.0 | Ring finger protein 167 | RNF167 | 212047_s_at | 16 | 0.2 | ||
| 0.0014 | 0.6 | Hypothetical LOC25845 | LOC25845 | 225457_s_at | 17 | 0.2 | ||
| 0.0014 | 4.2 | General transcription factor II, i | GTF2I | 232710_at | 18 | 0.3 | ||
| 0.0014 | 0.2 | Rho guanine nucleotide exchange factor (GEF) 10‐like | ARHGEF10L | 1570511_at | 19 | 0.3 | ||
| 0.0014 | 0.3 | G kinase anchoring protein 1 | GKAP1 | 229312_s_at | PCR | 20 | 0.3 | |
| 0.0015 | 1.9 | Glutathione peroxidase 3 (plasma) | GPX3 | 214091_s_at | 2 | PCR | 21 | 0.3 |
| 0.0016 | 0.5 | Dachshund homolog 1 (Drosophila) | DACH1 | 1567101_at | 2 | PCR | 22 | 0.3 |
| 0.0016 | 0.3 | Diacylglycerol kinase, theta 110kDa | DGKQ | 226605_at | 23 | 0.3 | ||
| 0.0017 | 0.6 | Hepatocellular carcinoma‐associated antigen 112 | HCA112 | 218345_at | 24 | 0.3 | ||
| 0.0018 | 3.5 | Mediator of RNA polymerase II transcription, subunit 31 homolog | MED31 | 222867_s_at | 25 | 0.3 | ||
| 0.0018 | 6.9 | Tyrosine 3‐monooxygenase/tryptophan 5‐monooxygenase activation protein, epsilon polypeptide | YWHAE | 210317_s_at | PCR | 26 | 0.3 | |
| 0.0018 | 0.1 | KH domain containing, RNA binding, signal transduction associated 1 | KHDRBS1 | 201488_x_at | 27 | 0.3 | ||
| 0.0019 | 0.3 | Solute carrier family 25 (mitochondrial carrier; Graves disease autoantigen), member 16 | SLC25A16 | 210686_x_at | 28 | 0.3 | ||
| 0.0019 | 4.9 | Hypothetical protein LOC51255 | LOC51255 | 223064_at | 29 | 0.3 | ||
| 0.002 | 0.2 | Cyclin L2 /// similar to Aurora kinase A‐interacting protein | CCNL2 /// LOC643556 | 222999_s_at | 30 | 0.3 | ||
| 0.002 | 7.4 | Lectin, mannose‐binding, 1 | LMAN1 | 224629_at | 31 | 0.3 | ||
| 0.002 | 0.2 | Erythrocyte membrane protein band 4.1 like 4A | EPB41L4A | 228259_s_at | 32 | 0.3 | ||
| 0.0022 | 0.2 | KIAA0999 protein | KIAA0999 | 204155_s_at | 33 | 0.3 | ||
| 0.0022 | 0.5 | ELOVL family member 7 | ELOVL7 | 227180_at | 34 | 0.3 | ||
| 0.0023 | 4.0 | Churchill domain containing 1 | CHURC1 | 233268_s_at | 35 | 0.4 | ||
| 0.0024 | 4.0 | Yippee‐like 2 (Drosophila) | YPEL2 | 227020_at | 36 | 0.4 | ||
| 0.0024 | 5.9 | Hermansky–Pudlak syndrome 1 | HPS1 | 210112_at | 37 | 0.4 | ||
| 0.0025 | 0.3 | Hypothetical protein LOC285831 | LOC285831 | 228857_at | 38 | 0.4 | ||
| 0.0026 | 3.5 | CDC37 cell division cycle 37 homolog (Saccharomyces cerevisiae)‐like 1 | CDC37L1 | 219343_at | 39 | 0.4 | ||
| 0.0026 | 2.1 | Ankyrin repeat and SOCS box‐containing 9 | ASB9 | 205673_s_at | 40 | 0.4 | ||
| 0.0026 | 0.2 | Hypothetical gene supported by AK125149 | LOC401577 | 239247_at | 41 | 0.5 | ||
| 0.0026 | 0.3 | TBC1 domain family, member 23 | TBC1D23 | 236755_at | 42 | 0.5 | ||
| 0.0026 | 0.3 | MRNA full length insert cDNA clone EUROIMAGE 2362292 | 235505_s_at | 43 | 0.5 | |||
| 0.0026 | 0.4 | Dehydrogenase/reductase (SDR family) member 8 | DHRS8 | 217989_at | 44 | 0.5 | ||
| 0.0026 | 0.4 | Nuclear receptor coactivator 2 | NCOA2 | 242369_x_at | 45 | 0.5 | ||
| 0.0026 | 0.2 | MRNA; cDNA DKFZp667E0114 (from clone DKFZp667E0114) | 235660_at | 46 | 0.5 | |||
| 0.0027 | 0.4 | Transforming, acidic coiled‐coil containing protein 1 | TACC1 | 242290_at | 47 | 0.5 | ||
| 0.0027 | 0.2 | POU domain, class 2, transcription factor 1 | POU2F1 | 1562280_at | 48 | 0.5 | ||
| 0.0027 | 2.9 | p21(CDKN1A)‐activated kinase 6 | PAK6 | 1555310_a_at | 0.5 | |||
| 0.0027 | 0.5 | Mannosyl (alpha‐1,3‐)‐glycoprotein β‐1,4‐N‐acetylglucosaminyltransferase, isozyme A | MGAT4A | 226039_at | 50 | 0.5 | ||
| 0.0027 | 5.1 | Zinc finger CCCH‐type containing 14 | ZC3H14 | 204216_s_at | 51 | 0.5 | ||
| 0.0028 | 0.5 | Acyl‐CoA synthetase short‐chain family member 2 | ACSS2 | 235805_at | 52 | 0.5 | ||
| 0.0028 | 0.3 | Programmed cell death 6 | PDCD6 | 222380_s_at | PCR | 53 | 0.6 | |
| 0.0029 | 3.8 | ERGIC and golgi 2 | ERGIC2 | 226422_at | 54 | 0.6 | ||
| 0.0029 | 0.4 | Erythrocyte membrane protein band 4.1 like 5 | EPB41L5 | 225855_at | 55 | 0.6 | ||
| 0.003 | 6.5 | Chromosome 14 open reading frame 32 | C14orf32 | 212644_s_at | 56 | 0.6 | ||
| 0.0031 | 0.2 | Transcribed locus | 239437_at | 57 | 1.8 | |||
| 0.0031 | 0.3 | DOT1‐like, histone H3 methyltransferase (S. cerevisiae) | DOT1L | 231297_at | 58 | 1.9 | ||
| 0.0031 | 2.2 | Transcription elongation factor A (SII)‐like 8 | TCEAL8 | 224819_at | 59 | 1.9 | ||
| 0.0031 | 0.3 | Laminin, β 1 | LAMB1 | 236437_at | 60 | 2.0 | ||
| 0.0032 | 2.7 | FK506 binding protein 5 | FKBP5 | 224840_at | 61 | 2.0 | ||
| 0.0033 | 0.5 | Integrin, α 6 | ITGA6 | 244665_at | 62 | 2.1 | ||
| 0.0034 | 2.7 | COMM domain containing 9 | COMMD9 | 218072_at | 63 | 2.2 | ||
| 0.0034 | 0.2 | Eukaryotic translation initiation factor 4 γ, 3 | EIF4G3 | 201936_s_at | 64 | 2.3 | ||
| 0.0035 | 0.5 | 235616_at | 235616_at | 235616_at | 65 | 2.6 | ||
| 0.0036 | 1.9 | Metallothionein 1X | MT1X | 204326_x_at | PCR | 66 | 2.6 | |
| 0.0036 | 2.7 | Peroxiredoxin 5 | PRDX5 | 1560587_s_at | 67 | 2.7 | ||
| 0.0037 | 0.3 | Core‐binding factor, runt domain, α subunit 2; translocated to, 2 | CBFA2T2 | 207625_s_at | 68 | 2.7 | ||
| 0.0037 | 0.4 | Transcribed locus, moderately similar to XP_531878.2 | 230168_at | 69 | 2.7 | |||
| 0.0038 | 0.3 | Zinc finger protein 346 | ZNF346 | 236267_at | 70 | 2.8 | ||
| 0.0038 | 2.0 | Metallothionein 1H‐like protein /// hypothetical protein LOC650610 | LOC645745 /// LOC650610 | 211456_x_at | 71 | 2.9 | ||
| 0.0039 | 0.2 | Hypothetical protein DKFZp586I1420 | DKFZp586I1420 | 213546_at | 72 | 3.4 | ||
| 0.0039 | 2.0 | Adrenergic, β‐2‐, receptor, surface | ADRB2 | 206170_at | 73 | 3.5 | ||
| 0.0039 | 0.3 | CTD‐binding SR‐like protein rA9 | KIAA1542 | 234952_s_at | 74 | 3.5 | ||
| 0.0039 | 2.6 | Peroxiredoxin 5 | PRDX5 | 222994_at | 75 | 3.6 | ||
| 0.004 | 0.2 | ATPase, H+ transporting, lysosomal 42kDa, V1 subunit C1 | ATP6V1C1 | 226463_at | 76 | 3.8 | ||
| 0.004 | 8.0 | XK, Kell blood group complex subunit‐related family, member 8 | XKR8 | 218753_at | 77 | 3.8 | ||
| 0.004 | 0.3 | Caspase 6, apoptosis‐related cystein peptidase | CASP6 | 242323_at | 78 | 4.0 | ||
| 0.0041 | 0.4 | Coagulation factor XII (Hageman factor) | F12 | 205774_at | 79 | 4.0 | ||
| 0.0041 | 0.3 | Centaurin, γ 2 | CENTG2 | 240758_at | 80 | 4.2 | ||
| 0.0042 | 0.6 | LR8 protein | LR8 | 220532_s_at | 81 | 4.2 | ||
| 0.0042 | 0.2 | WD repeat domain 42A | WDR42A | 243318_at | 82 | 4.5 | ||
| 0.0042 | 2.6 | Potassium channel tetramerisation domain containing 14 | KCTD14 | 219545_at | 83 | 4.7 | ||
| 0.0043 | 2.8 | 6‐Phosphogluconolactonase | PGLS | 218388_at | 84 | 4.9 | ||
| 0.0044 | 3.8 | Bruno‐like 6, RNA binding protein (Drosophila) | BRUNOL6 | 227775_at | 85 | 4.9 | ||
| 0.0044 | 2.3 | Zinc finger protein 415 | ZNF415 | 205514_at | 86 | 5.0 | ||
| 0.0045 | 0.5 | HIR histone cell cycle regulation defective homolog A (S. cerevisiae) | HIRA | 240451_at | 87 | 5.1 | ||
| 0.0046 | 0.5 | Cardiolipin synthase 1 | CRLS1 | 241741_at | 88 | 5.9 | ||
| 0.0046 | 0.3 | c‐mer proto‐oncogene tyrosine kinase | MERTK | 233079_at | 89 | 6.1 | ||
| 0.0047 | 0.2 | Additional sex combs like 2 (Drosophila) | ASXL2 | 218659_at | 90 | 6.5 | ||
| 0.0047 | 3.6 | Platelet endothelial aggregation receptor 1 | PEAR1 | 228618_at | 91 | 6.9 | ||
| 0.0047 | 0.3 | Core‐binding factor, runt domain, α subunit 2; translocated to, 2 | CBFA2T2 | 238549_at | 92 | 7.4 | ||
| 0.005 | 0.6 | Lysosomal associated protein transmembrane 4 β | LAPTM4B | 208029_s_at | 93 | 8.0 |
Pass, number of overlapped probes; PCR, the genes that were subsequently examined using real‐time RT‐PCR.
A heat‐map of the expression values of the 98 selected genes comparing the unfavorable prognosis group (survival time, <180 days) and favorable prognosis group (survival time, ≥180 days) is shown in Fig. 1. Genes are plotted via hierarchical clustering.
Figure 1.
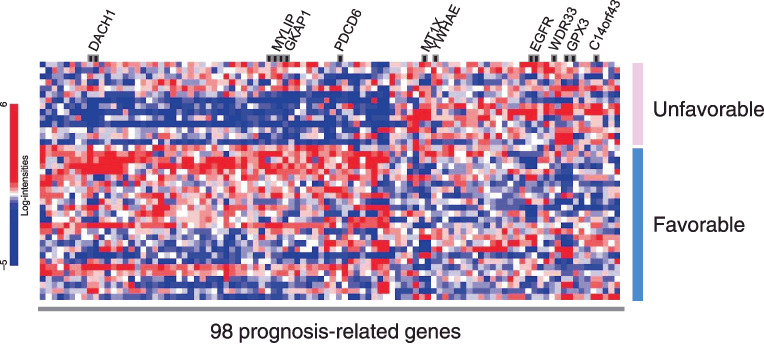
Heat map of expression values for microarray identifying 98 genes whose expressions were correlated with survival. The hierarchical clustering of the 98 genes comparing the unfavorable prognosis group (survival time, <180 days) and favorable prognosis group (survival time, ≥180 days) is shown. The blue or red colors of each block represent the normalized gene expression levels. Each row represents a sample, and each column represents a gene. The 10 genes included in the multivariate analysis (Table 3) are shown.
Multivariate analysis of prognosis‐related genes. Of the 98 candidate genes, we prioritized those that: (i) were selected by overlapping probes; (ii) were novel genes; or (iii) had a lower P‐value according to a Cox proportional hazards model. We selected the following 10 genes of interest for real‐time RT‐PCR analysis: DACH1, EGFR, MT1X, YWHAE, GPX3, PDCD6, WDR33, C14orf43, MYLIP and GKAP1.
To adjust for relevant clinical covariates against these 10 genes, we performed a multivariate analysis (Table 3). The results of the multivariate analysis revealed that high DACH1 expression and high PDCD6 expression were significantly correlated with the favorable outcome (P = 0.0134 and P = 0.0015, respectively). We therefore considered that the DACH1 and PDCD6 expressions were independent prognostic markers from the results of the multivariate analysis. Results of microarray data and patient survival in the training set of 40 patients are shown in Fig. 2. The Kaplan–Meier method was used for DACH1 and PDCD6. The low PDCD6 and DACH1 expression groups had significantly poorer outcomes (P < 0.0001 and P = 0.0045).
Table 3.
Multivariate analysis of prognosis‐related genes
| Variable | Hazard ratio | 95% confidence interval | P‐value |
|---|---|---|---|
| Age (≥65) | 1.78 | 0.570–5.559 | 0.3212 |
| Sex (male) | 3.26 | 0.732–14.489 | 0.1210 |
| Performance status (≥1) | 2.36 | 0.687–8.078 | 0.1728 |
| Metastasis (≥3) | 1.58 | 0.450–5.561 | 0.4739 |
| Chemotherapy (5‐FU) | 1.48 | 0.402–5.475 | 0.5541 |
| DACH1 | 0.38 | 0.175–0.817 | 0.0134 |
| EGFR | 1.41 | 0.992–2.001 | 0.0553 |
| MT1X | 0.71 | 0.317–1.600 | 0.4111 |
| YWHAE | 1.91 | 0.401–9.061 | 0.4169 |
| GPX3 | 1.62 | 0.869–3.007 | 0.1293 |
| PDCD6 | 0.06 | 0.010–0.334 | 0.0015 |
| WDR33 | 1.38 | 0.268–7.067 | 0.7017 |
| C14orf43 | 0.64 | 0.122–3.407 | 0.6045 |
| MYLIP | 0.67 | 0.221–2.042 | 0.4826 |
| GKAP1 | 2.31 | 0.751–7.106 | 0.1440 |
Cox regression model was performed for multivariate analysis against each of the variables.
Figure 2.
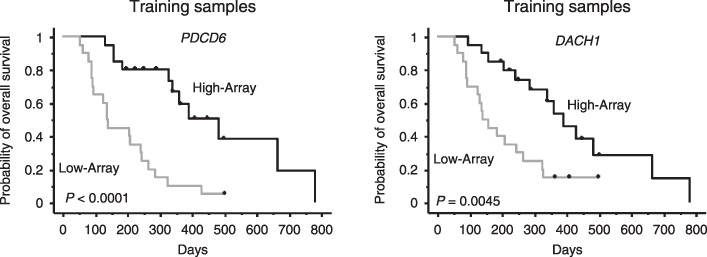
Results of microarray data and patient survival in the training set of 40 patients. The Kaplan–Meier method was used for DACH1 and PDCD6. The patients were divided into high and low expression groups by median values. The low PDCD6 and DACH1 expression groups had significantly poorer outcomes (P < 0.0001 and P = 0.0045). High‐Array, group with high expression levels as determined by signal intensity of microarray data. Low‐Array, group with low expression levels as determined by signal intensity of microarray data.
Validation using real‐time RT‐PCR in independent samples. The mRNA expression levels of DACH1 and PDCD6 were quantified using real‐time RT‐PCR in 19 independent samples to validate the results of the microarray. While the expression levels of DACH1 were not correlated with survival, those of PDCD6 in independent samples were significantly correlated with the survival (P = 0.007) (Table 4). The Kaplan–Meier method was used to estimate the overall survival using the median value (Fig. 3a). All quantified expression levels of real time RT‐PCR data are shown as Fig. 3(b). The mRNA expressions of PDCD6 varied by approximately 25 fold (range, 0.98–25.1). The low PDCD6 expression groups had significantly poorer outcomes (P = 0.0018). We concluded that PDCD6 was a valuable gene for predicting the survival in patients with gastric cancer. These results indicate that our PCR‐based single gene prediction strategy using endoscopic biopsy samples could successfully predict the overall patient survival.
Table 4.
Results of real‐time RT‐PCR for PDCD6 and DACH1 in an independent valiation set
| Genes | Hazard ratio | 95% confidence limits | P‐value | |
|---|---|---|---|---|
| Upper | Lower | |||
| PDCD6 * | 0.29 | 0.12 | 0.71 | 0.007 |
| DACH1 | 0.79 | 0.56 | 1.13 | 0.199 |
, P < 0.05.
Figure 3.
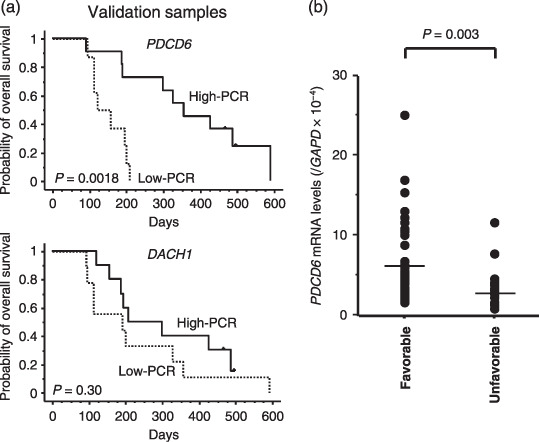
Results of real‐time reverse transcription polymerase chain reaction (RT‐PCR) analysis and patient survival in the independent validation set of 19 samples. (a) The Kaplan–Meier method was used to estimate the overall survival. The low PDCD6 expression groups had significantly poorer outcomes (P = 0.0018). High‐PCR, group with high expression levels as determined by PCR. Low‐PCR, group with low expression levels as determined by PCR. (b) All quantified expression levels of real time RT‐PCR data are shown. The mRNA expressions of PDCD6 were significantly lower in unfavorable group (P = 0.003) and varied ~25 fold (range, 0.98–25.1). Favorable, the patients with survival time over 180 days. Unfavorable, the patients with a survival time less than 180 days.
Discussion
Several studies have identified prognostic biomarkers in cases of gastric cancer using microarray analysis. Hasegawa et al. identified 12 genes that were associated with lymph node metastasis.( 23 ) Hippo et al. identified several genes associated with lymph node metastasis, including Oct‐2, and genes associated with the histological type, including liver‐intestine cadherin.( 24 ) These studies introduced a novel direction in which microarray analysis could be used to predict postoperative recurrences. Inoue et al. selected 78 genes that were differentially expressed between aggressive and non‐aggressive cancers and constructed a prognostic scoring system.( 25 ) Leung et al. found that high CCL18 expression levels were associated with prolonged overall and disease‐free survival.( 26 ) They also found that phospholipase A2 group IIA expression in gastric adenocarcinoma was associated with prolonged survival and less frequent metastasis.( 27 ) Chen et al. demonstrated a survival prediction model consisting of three genes (CD36, SLAM, PIM‐1) that was capable of predicting poor or good survival in 23 (76.7%) of 30 newly enrolled patients.( 28 ) Most of these studies used surgical specimens to predict postsurgical survival and were conducted retrospectively. Thus, we think that our present prospective study is unique in that we used endoscopic biopsy samples to predict the survival time in patients with unresectable gastric cancer. In patients with unresectable cancer, endoscopic biopsy samples may be the most appropriate specimens available non‐invasively for microarray analysis. Although tumor heterogeneity may pose problems when biopsy samples are used as representative tissue specimens and further investigation is required, we believe that endoscopic biopsy samples should continue to be used for microarray analyses. Current clinical study has been confronted with a number of obstacles. Microarray analysis for clinical studies, in particular, has been hampered with bottlenecks such as RNA quality, the extremely large number of genes to be analyzed, an immature analytical tool or methodology and so on. There are two types of obstacles: controllable obstacles and uncontrollable ones. One uncontrollable obstacle is a complex chemotherapy regimen. It is easy to say that a clinical biomarker study should be performed in one particular regimen. Chemotherapy regimen has, however, progressed and become more sophisticated in a short range of time. This study was prospective clinical study and was largely followed by a guideline, Recommendations for Tumor Marker Prognostic Studies (REMARK). To minimize the uncontrollable factors, we aimed to avoid controllable factors with our best efforts. In this sense, we believe that the present study has succeeded in stratifying potential controllable variables.
Based on the results of the series of analyses conducted in the current study, we validated PDCD6 as a molecular biomarker of the prognosis in gastric cancer.
PDCD6, also known as ALG‐2 (apoptosis‐linked gene‐2), was first identified in a study on T‐cell apoptosis conducted by Vito et al.( 29 ) PDCD6 encodes a calcium‐binding protein that belongs to the penta‐EF‐hand protein family. The gene product participates in T‐cell receptor‐, Fas‐ and glucocorticoid‐induced programmed cell death and cell proliferation. The stimulation of cells to enter the cell cycle is thought to drive the cellular apoptotic program, and the presence of additional survival or pro‐apototic signals determines whether a cell proliferates or commits suicide. Krebs et al. indicated that the deregulation of such an obviously delicate balance could lead to pathological developments, such as cancer.( 30 ) Detailed biological function of PDCD6 genes in gastric cancer is still unclear. The speculated function may lead us to hypothesize that the expression is generally downregulated in cancer.
Our ultimate goal is to use real‐time RT‐PCR or immunohistochemical examination to identify patients with a poor prognosis prior to undertaking chemotherapy. We are now planning a large‐scale prospective study based on the evidence obtained in the current study.
In conclusion, we identified prognostic biomarkers in patients with unresected gastric cancer, and our PCR‐based single gene prediction strategy successfully predicted the overall survival of patients with gastric cancer. Our findings may provide a novel insight into the treatment of gastric cancer and may lead to a better understanding of this disease subgroup.
Acknowledgments
This work was supported by funds for the Third Term Comprehensive 10‐Year Strategy for Cancer Control, a Grant‐in‐Aid for Scientific Research and the program for promotion of Fundamental Studies in Health Sciences of the National Institute of Biomedical Innovation (NiBio). The following people have played very important roles in the conduct of this project: Hiromi Orita, Hisanao Hamanaka, Ayumu Goto, Hisateru Yasui, Junichi Matsubara, Natsuko Okita, Takako Nakajima, Atsuo Takashima, Kei Muro, Takashi Ura, Hideko Morita, Mari Araake, Hisao Fukumoto, Tatsu Shimoyama, Naoki Hayama, Masayuki Takeda, Hideharu Kimura, Kazuko Sakai, Terufumi Kato and Jun‐ya Fukai. We also thank Dr Richard Simon and Dr Amy Peng for providing us with the BRB ArrayTools software. This free software was very useful and has been developed for user‐friendly applications.
References
- 1. Sastre J, Garcia‐Saenz JA, Diaz‐Rubio E. Chemotherapy for gastric cancer. World J Gastroenterol 2006; 12: 204–13. [DOI] [PMC free article] [PubMed] [Google Scholar]
- 2. Vanhoefer U, Rougier P, Wilke H et al . Final results of a randomized phase III trial of sequential high‐dose methotrexate, fluorouracil, and doxorubicin versus etoposide, leucovorin, and fluorouracil versus infusional fluorouracil and cisplatin in advanced gastric cancer: a trial of the European Organization for Research and Treatment of Cancer Gastrointestinal Tract Cancer Cooperative Group. J Clin Oncol 2000; 18: 2648–57. [DOI] [PubMed] [Google Scholar]
- 3. Ohtsu A, Shimada Y, Shirao K et al . Randomized phase III trial of fluorouracil alone versus fluorouracil plus cisplatin versus uracil and tegafur plus mitomycin in patients with unresectable, advanced gastric cancer: The Japan Clinical Oncology Group Study (JCOG9205). J Clin Oncol 2003; 21: 54–9. [DOI] [PubMed] [Google Scholar]
- 4. Sakata Y, Ohtsu A, Horikoshi N, Sugimachi K, Mitachi Y, Taguchi T. Late phase II study of novel oral fluoropyrimidine anticancer drug S‐1 (1M tegafur‐0.4M gimestat‐1M otastat potassium) in advanced gastric cancer patients. Eur J Cancer 1998; 34: 1775–20. [DOI] [PubMed] [Google Scholar]
- 5. Koizumi W, Kurihara M, Nakano S, Hasegawa K. Phase II study of S‐1, a novel derivative of 5‐fluorouracil, in advanced gastric cancer. Oncology 2000; 58: 191–7. [DOI] [PubMed] [Google Scholar]
- 6. Shirao K, Shimada Y, Kondo H et al . Phase I–II study of irinotecan hydrochloride combined with cisplatin in patients with advanced gastric cancer. J Clin Oncol 1997; 15: 921–7. [DOI] [PubMed] [Google Scholar]
- 7. Boku N, Ohtsu A, Shimada Y et al . Phase II study of combination of irinotecan and cisplatin against metastatic gastric cancer. J Clin Oncol 1999; 17: 319–23. [DOI] [PubMed] [Google Scholar]
- 8. Boku N, Yamamoto S, Shirao K et al . Gastrointestinal Oncology Study Group/Japan Clinical Oncology Group . Randomized phase III study of 5‐fluorouracil (5‐FU) alone versus combination of irinotecan and cisplatin (CP) versus S‐1 alone in advanced gastric cancer (JCOG9912) (Abstract). Proc Am Soc Clin Oncol 2007; 25: 18S. [Google Scholar]
- 9. Chau I, Norman AR, Cunningham D, Waters JS, Oates J, Ross PJ. Multivariate prognostic factor analysis in locally advanced and metastatic esophago‐gastric cancer – pooled analysis from three multicenter, randomized, controlled trials using individual patient data. J Clin Oncol 2004; 22: 2395–403. [DOI] [PubMed] [Google Scholar]
- 10. Metzger R, Leichman CG, Danenberg KD et al . ERCC1 mRNA levels complement thymidylate synthase mRNA levels in predicting response and survival for gastric cancer patients receiving combination cisplatin and 5‐fluorouracil chemotherapy. J Clin Oncol 1998; 16: 309–16. [DOI] [PubMed] [Google Scholar]
- 11. Boku N, Chin K, Hosokawa K et al . Biological makers as a predictor for response and prognosis of unresectable gastric cancer patients treated with 5‐fluorouracil and cis‐platinum. Clin Cancer Res 1998; 4: 1469–74. [PubMed] [Google Scholar]
- 12. Yonemura Y, Ninomiya I, Yamaguchi A et al . Evaluation of immunoreactivity for erbB‐2 protein as a marker of poor short term prognosis in gastric cancer. Cancer Res 1991; 51: 1034–8. [PubMed] [Google Scholar]
- 13. Sanz‐Ortega J, Steinberg SM, Moro E et al . Comparative study of tumor angiogenesis and immunohistochemistry for p53, c‐ErbB2, c‐myc and EGFr as prognostic factors in gastric cancer. Histol Histopathol 2000; 15: 455–62. [DOI] [PubMed] [Google Scholar]
- 14. Shibata A, Parsonnet J, Longacre TA et al . CagA status of Helicobacter pylori infection and p53 gene mutations in gastric adenocarcinoma. Carcinogenesis 2002; 23: 419–24. [DOI] [PubMed] [Google Scholar]
- 15. Okusa Y, Ichikura T, Mochizuki H. Prognostic impact of stromal cell‐derived urokinase‐type plasminogen activator in gastric carcinoma. Cancer 1999; 85: 1033–8. [PubMed] [Google Scholar]
- 16. Linder N, Haglund C, Lundin M et al . Decreased xanthine oxidoreductase is a predictor of poor prognosis in early‐stage gastric cancer. J Clin Pathol 2006; 59: 965–71. [DOI] [PMC free article] [PubMed] [Google Scholar]
- 17. Resnick MB, Gavilanez M, Newton E et al . Claudin expression in gastric adenocarcinomas: a tissue microarray study with prognostic correlation. Hum Pathol 2005; 36: 886–92. [DOI] [PubMed] [Google Scholar]
- 18. Kido S, Kitadai Y, Hattori N et al . Interleukin 8 and vascular endothelial growth factor – prognostic factors in human gastric carcinomas? Eur J Cancer 2001; 37: 1482–7. [DOI] [PubMed] [Google Scholar]
- 19. Xiangming C, Natsugoe S, Takao S et al . The cooperative role of p27 with cyclin E in the prognosis of advanced gastric carcinoma. Cancer 2000; 89: 1214–9. [PubMed] [Google Scholar]
- 20. Yasui W, Oue N, Ono S, Mitani Y, Ito R, Nakayama H. Histone acetylation and gastrointestinal carcinogenesis. Ann NY Acad Sci 2003; 983: 220–31. [DOI] [PubMed] [Google Scholar]
- 21. Oue N, Motoshita J, Yokozaki H et al . Distinct promoter hypermethylation of p16INK4a, CDH1, and RAR‐beta in intestinal, diffuse‐adherent, and diffuse‐scattered type gastric carcinomas. J Pathol 2002; 198: 55–9. [DOI] [PubMed] [Google Scholar]
- 22. Yamanaka R, Arao T, Yajima N et al . Identification of expressed genes characterizing long‐term survival in malignant glioma patients. Oncogene 2006; 25: 5994–6002. [DOI] [PubMed] [Google Scholar]
- 23. Hasegawa S, Furukawa Y, Li M et al . Genome‐wide analysis of gene expression in intestinal‐type gastric cancers using a complementary DNA microarray representing 23 040 genes. Cancer Res 2002; 62: 7012–17. [PubMed] [Google Scholar]
- 24. Hippo Y, Taniguchi H, Tsutsumi S et al . Global gene expression analysis of gastric cancer by oligonucleotide microarrays. Cancer Res 2002; 62: 233–40. [PubMed] [Google Scholar]
- 25. Inoue H, Matsuyama A, Mimori K, Ueo H, Mori M. Prognostic score of gastric cancer determined by cDNA microarray. Clin Cancer Res 2002; 8: 3475–9. [PubMed] [Google Scholar]
- 26. Leung SY, Yuen ST, Chu KM et al . Expression profiling identifies chemokine (C‐C motif) ligand 18 as an independent prognostic indicator in gastric cancer. Gastroenterology 2004; 127: 457–69. [DOI] [PubMed] [Google Scholar]
- 27. Leung SY, Chen X, Chu KM et al . Phospholipase A2 group IIA expression in gastric adenocarcinoma is associated with prolonged survival and less frequent metastasis. Proc Natl Acad Sci USA 2002; 99: 16203–8. [DOI] [PMC free article] [PubMed] [Google Scholar]
- 28. Chen CN, Lin JJ, Chen JJ et al . Gene expression profile predicts patient survival of gastric cancer after surgical resection. J Clin Oncol 2005; 23: 7286–95. [DOI] [PubMed] [Google Scholar]
- 29. Vito P, Lacana E, D’Adamio L. Interfering with apoptosis: Ca(2+)‐binding protein ALG‐2 and Alzheimer's disease gene ALG‐3. Science 1996; 271: 521–5. [DOI] [PubMed] [Google Scholar]
- 30. Krebs J, Saremaslani P, Caduff R. ALG‐2: a Ca2+‐binding modulator protein involved in cell proliferation and in cell death. Biochim Biophys Acta 2002; 1600: 68–73. [DOI] [PubMed] [Google Scholar]