

Abstract
Genetic and epigenetic alterations in tumor‐suppressor genes play important roles in human neoplasia. Ras signaling is often activated in oral squamous cell carcinoma (OSCC), although Ras mutations are rarely detected in Japanese OSCC patients, and the mechanisms underlying the gene's activation remain unclear. Here, we examined the expression of Ras association family (RASSF) genes in a panel of OSCC cell lines and found that RASSF2 is often downregulated by DNA methylation in OSCC cells. In addition, aberrant methylation of RASSF2 was detected in 12 of 46 (26%) primary OSCC, and 18 (39%) of those OSCC showed methylation of at least one RASSF gene. Ectopic expression of RASSF2 in OSCC cells suppressed cell growth and induced apoptosis. A RASSF2 deletion mutant lacking the Ras‐association domain, which was therefore unable to interact with Ras, exhibited less pro‐apoptotic activity than the full‐length protein, indicating that the pro‐apoptotic activity of RASSF2 is related to its association with Ras. Genomic screening of genes regulated by RASSF2 showed that genes involved in immune responses, angiogenesis, and metastasis are suppressed by RASSF2. Our results suggest that epigenetic inactivation of RASSF2 plays an important role in OSCC tumorigenesis, and that RASSF2 may be a useful molecular target for the diagnosis and treatment of OSCC. (Cancer Sci 2008; 99: 958–966)
Epidemiological studies have shown that oral squamous cell carcinoma (OSCC) is one of the most commonly occurring human neoplasias( 1 ) and it appears that alcohol and tobacco play key roles in its development.( 2 , 3 ) Although it has been suggested that OSCC arises through the accumulation of multiple genetic changes (e.g. p53 mutations), the precise molecular mechanism underlying the development of OSCC remains unclear.( 4 )
In addition to genetic changes, recent studies indicate that epigenetic silencing of cancer‐related genes by DNA methylation also plays an important role in tumorigenesis in OSCC.( 5 , 6 ) Inactivation of tumor‐suppressor and cancer‐related genes occurs via such epigenetic changes as DNA methylation, histone deacetylation, and histone methylation in the 5′‐CpG island of the genes.( 7 ) DNA methylation is reversible by pharmacological inhibition of DNA methyltransferase, and can be a molecular target for cancer therapy.( 8 ) In OSCC, genes involved in cell cycle regulation, apoptosis, DNA repair, and cellular differentiation are reportedly involved,( 6 , 9 , 10 , 11 , 12 ) although the role of DNA methylation in OSCC tumorigenesis is not fully understood.
The RAS signaling pathway is frequently activated in human tumors( 13 ) and activating mutations of k‐ras and Ha‐ras have been detected in OSCC associated with chewing tobacco.( 14 , 15 ) In contrast, Ras mutations are rare among Japanese OSCC patients.( 16 ) Moreover, recent studies indicate that, in addition to Ras mutation, inactivation of negative effectors of Ras may play a significant role in the development of tumors. Among these negative effectors, the Ras association family (RASSF) is a group of proteins that contain Ras association (RA) domains and suppress Ras activity. RASSF1, for example, was recently identified as a potential tumor suppressor that can induce apoptosis in tumor cells.( 17 , 18 ) In addition, we and others have shown that expression of the RASSF2 gene is silenced by methylation in human neoplasias, including colorectal, gastric, lung, and nasopharyngeal cancers.( 19 , 20 , 21 , 22 , 23 ) In OSCC, RASSF1 is silenced by methylation;( 12 ) however, epigenetic inactivation of other RASSF genes in OSCC has not been characterized.
In the present study, we examined the expression and methylation statuses of six RASSF genes in a panel of OSCC cell lines. Our findings indicate that epigenetic inactivation of RASSF2 plays a key role in OSCC tumorigenesis, and that RASSF2 may be an important molecular target for the diagnosis and treatment of OSCC.
Materials and Methods
Cell lines and specimens. A total of 16 OSCC cell lines were used in the present study: OSC19, OSC20, HO‐1‐N‐1, and KOSC3 cells were obtained from the Japanese Collection of Research Bioresources (Tokyo, Japan); HSC2, HSC3, HSC4, SAS, and Ho‐1‐u‐1 cells were from the Institute of Development, Aging, and Cancer, Tohoku University (Sendai, Japan); OM1, MON2, MOT, HOC119, and HOC621 cells were kindly provided by Dr N. Kamata (Tokyo Medical and Dental University, School of Medicine, Tokyo, Japan); and OSC30 and OSC70 cells were kindly provided by Dr A. Miyazaki (Sapporo Medical University, Sapporo, Japan). In addition, 46 primary OSCC specimens were obtained from patients in the Department of Oral Surgery, Sapporo Medical University. Thirty‐one samples of non‐cancerous tissue from areas adjacent to the tumors were also examined. Written informed consent was obtained from every patient and approved by The Institutional Review Board. DNA was extracted from the cells and tissues using the standard phenol–chloroform method. In some cases, cells were treated with either mock or 2 µM 5‐aza‐dC for 72 h, after which they were harvested and DNA and RNA was extracted using RNAeasy (Qiagen, Valencia, CA, USA).
Reverse transcription–polymerase chain reaction. Samples (5 µg) of RNA were reverse‐transcribed using Superscript III (Invitrogen, Carlsad, CA, US) to prepare first‐strand cDNA. The primer sequences and polymerase chain reaction (PCR) parameters used were reported previously.( 19 ) Controls consisted of RNA treated identically but without the addition of reverse transcriptase and are labeled as RT–. The integrity of the cDNA was confirmed by amplifying glyceraldehyde 3‐phosphate dehydrogenase (GAPDH) as described previously.( 24 ) Samples (10 µL) of amplified product were then subjected to 2.5% agarose gel electrophoresis and stained with ethidium bromide. For semiquantitative analysis, real‐time PCR was carried out using a 7900 Sequence Detection System (Applied Biosystems, Foster City, CA, US). The reaction mixture contained 1× TaqMan Universal PCR Master Mix, primers, and probes for each gene (RASSF2, Hs‐00189346; CXCL1, Hs00605382_gH; CXCL2, Hs00236966_m1; CXCL3, Hs00171061_m1; CXCL5, Hs00171085_m1; CXCL6, Hs00605742_g1; IL‐8, Hs00174103_m1; CCL20, Hs00171125_m1; CCL21, Hs00171076_m1; RelB, Hs00232399_m1; MMP9, Hs00234579_m1; Applied Biosystems) and 1 µL of cDNA. GAPDH served as an endogenous control.
Combined bisulfite restriction analysis and bisulfite sequencing. Genomic DNA was treated with sodium bisulfite, as described previously,( 25 ) after which combined bisulfite restriction analysis (COBRA) was carried out to assess the methylation status of RASSF1‐6. Briefly, bisulfite‐treated DNA was amplified in PCR buffer containing 67 mM Tris‐HCl (pH 8.8), 16.6 mM (NH4)2SO4, 6.7 mM MgCl2, 10 mM β‐mercaptoethanol, 0.25 mM dNTP mixture, 0.5 µM each primer, and 1.0 U of ExTaq Hot Start Version (Takara, Tokyo, Japan). The primer sequences, PCR conditions, and restriction enzymes used were all described previously.( 19 ) To sequence the bisulfite‐PCR products, fragments amplified using primers RASSF2Bseq‐F (5′‐TGGAYGAGTTGGYGGGGAAG‐3′) and RASSF2Bseq‐R (5′‐CRCCAATACCTCRCTCCCAATAC‐3′) were cloned into the pCR2.1 vector using a TOPO‐cloning Kit (Invitrogen). Cycle sequencing was then carried out using a BigDye terminator kit (Applied Biosystems), after which the DNA was sequenced using an ABI 3100 automated sequencer (Applied Biosystems).
Immunocytochemistry. Cells (1 × 10⁴) were seeded onto glass coverslips, infected with adenoviral vectors, and fixed with 4% paraformaldehyde. The cells were then labeled first with goat anti‐RASSF2 antibody (Santa Cruz, Santa Cruz, CA, USA) and then with fluorescein isothionate (FITC)‐conjugated antigoat IgG (Santa Cruz), which served as a secondary antibody. Nuclei were stained with 4′,6‐diamidino‐2‐phenylindole (DAPI) in Vectashield mounting medium (Vector Laboratories, Burlingame, CA, USA), after which the cells were examined under a fluorescence microscope.
Colony‐formation assay. Cells were transfected with RASSF2 (amino acids [aa] 1–326), RASSF2‐ΔC (aa 1–164), RASSF2‐ΔN (aa 164–326), or control vector using an Amaxa (Köln, Germany) electroporation system. Twenty‐four hours after transfection, 1 × 10⁴ cells were plated, and the transfectants were selected by incubation in medium containing G418 for 3 weeks. The surviving cells were then fixed and stained with Giemsa. To determine colony numbers, we captured images of the plates and analyzed the total surface, recognizing the colonies as dots using NIH Image software (http://rsb.info.nih.gov/nih‐image). The experiments were carried out in triplicate and repeated on two independent occasions.
Flow cytometry. Cells (3 × 10⁵ cells/dish) used for fluorescence‐activated cell sorting (FACS) analysis were first infected with Ad‐LacZ, Ad‐RASSF2, and Ad‐RASSF2A‐ΔC. They were then trypsinized, fixed in methanol, rehydrated in phosphate‐buffered saline, treated with 2 mg/mL RNase at 37°C for 30 min, and stained with propidium iodide (50 µg/mL solution). FACS analysis was then carried out using a Becton Dickinson FACScan flow cytometer (Braintree, MA, USA).
Microarray analysis. Microarray experiments were carried out using the Affymetrix Human Genome U133A platform (Affymetrix, Santa Clara, CA, USA). After infecting HSC4 cells with Ad‐RASSF2, total RNA was extracted using RNAeasy and used as a template for the synthesis of Cy5‐labeled cDNA probes. Total RNA from HSC4 cells infected with Ad‐LacZ vector were labeled with Cy‐3 and served as a control. The hybridized slides were scanned using a microarray scanner (Affymetrix).
Gene ontology classification and pathway analysis. Gene ontology categories and Kyoto Encyclopedia of Genes and Genomes (KEGG) pathways were evaluated using GeneSpring (Agilent Technologies, Palo Alto, CA, USA), which determines overrepresentation by comparing positive genes in linkage regions to tested genes using a one‐tailed Fisher exact test.
Luciferase assay. For luciferase assays, OSC19 cells were seeded to a density of 1 × 10⁵ cells/well in 24‐well plates, and then transfected transiently with 0.5 µg nuclear factor (NF)‐κB reporter plasmid using Lipofectamine 2000 transfection agent (Invitrogen), following the manufacturer's recommended protocol. To normalize for variation in transfection efficiency, 0.05 µg Renilla reporter pRL‐null was also transfected. Cells were then harvested for measurement of firefly and Renilla luciferase activities using a dual luciferase assay system. Firefly luciferase activity was determined by subtracting the background signal and normalizing to the Renilla activity.
Western blot analysis. Samples (10 µg) of total cell lysate were subjected to sodium dodecylsulfate–polyacrylamide gel electrophoresis (SDS‐PAGE) and transferred electrophoretically to nitrocellulose membranes. The membranes were then incubated with antip44/p42 Map kinase (#9102; Cell Signaling, Danvers, MA, US), antiphospho‐p44/p42 Map kinase (#9101; Cell Signaling), anti‐AKT (#9272; Cell Signaling), and antiphosphorylated AKT (#9271; Cell Signaling), after which the signal was detected using an enhanced chemiluminescence (ECL) detection system (Amersham Biosciences/GE Healthcare, Piscataway, NJ, USA). To detect NF‐κB/p50, nuclear extracts were prepared from cells infected with Ad‐LacZ or Ad‐RASSF2 using a nuclear extract kit (Active Motif) according to the manufacturer's instructions. Samples (10 µg) of cell lysate were subjected to SDS‐PAGE and transferred electrophoretically to nitrocellulose membranes. The membranes were then incubated with polyclonal anti‐NF‐κB/p50 (sc1190; Santa Cruz) and anti‐PCNA (proliferating cell human antigen) antibodies (sc56; Santa Cruz), and signals were detected using an ECL detection system.
Results
Epigenetic inactivation of RASSF family genes in OSCC cell lines. We initially examined the expression status of RASSF1–6 in a panel of 16 OSCC cell lines (Fig. 1a) and found that 10 (HSC2, HSC3, HSC4, OSC19, OSC20, OSC30, SC70, SAS, HOC621, and KOSC3) expressed little or no RASSF2 mRNA, making RASSF2 the most frequently downregulated in OSCC cells. Treating OSCC cells with 5‐aza‐dC restored expression of the gene, which confirmed the role played by DNA methylation in silencing RASSF2 (Fig. 1a,b). We also detected downregulation of RASSF1 in three cell lines. Expression of RASSF3, RASSF4, RASSF5, and RASSF6 was readily detected in all of the OSCC cell lines studied.
Figure 1.
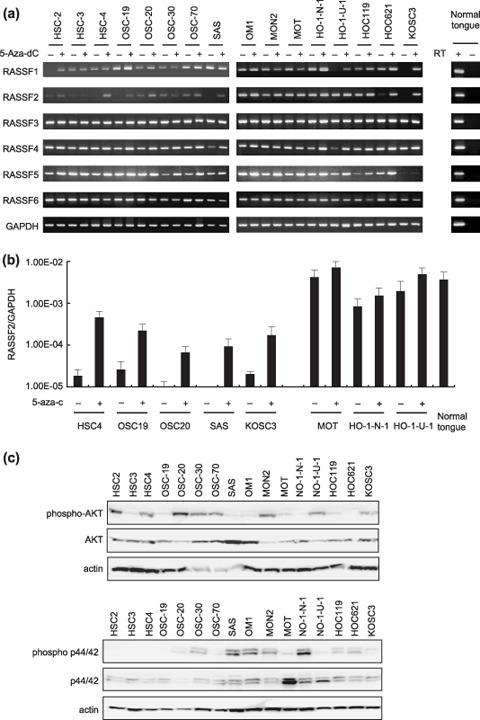
Analysis of RASSF gene expression in oral squamous cell carcinoma (OSCC) cell lines. (a) Reverse transcription–polymerase chain reaction analysis of RASSF1–6 in OSCC cell lines. cDNA was prepared from cells treated with either 2 µM 5‐aza‐dC (+) or mock (–). The integrity of the mRNA was confirmed by amplifying glyceraldehyde‐3‐phosphate dehydrogenase (GAPDH). The genes analyzed are shown on the left; the cell lines analyzed are shown above the columns. Corresponding negative controls (amplifying without reverse transcription) are shown as RT–. (b) Quantitative analysis of RASSF2 expression in OSCC cell lines treated with either mock (–) or 2 µM 5‐aza‐dC for 72 h (+). RASSF2 Expression was examined with real‐time polymerase chain reaction using a TaqMan expression system. The cell lines examined are shown below the column. The bars indicate means ± SD of three independent experiments. (c) Activation of p44/p42 and AKT in OSCC cell lines. Total cell lysates from the indicated cell lines were resolved by sodium dodecylsulfate–polyacrylamide gel electrophoresis and western analysis using antibodies that recognize phosphorylated or total p44/p42 or AKT.
To determine whether inactivation of RASSF family genes correlates with activation of the Ras signaling pathway, we assessed the activation of two downstream mediators of Ras. The phosphorylated forms of both p44/42 Map kinase and AKT were detected in most OSCC cell lines (Fig. 1c). OSCC cells that showed RASSF2 methylation also tended to show higher levels of phosphorylated AKT than those that did not show methylation (methylated 6/10 [60%] vs unmethylated 2/6 [33%]).
To further evaluate the role of DNA methylation in silencing RASSF genes, we used COBRA to determine the methylation status of the 5′ region of the genes (Fig. 2a). We detected RASSF2 methylation in 10 of the 16 (63%) OSCC cell lines studied. Of the 10 methylated lines, SAS and KOSC3 showed dense methylation, whereas the other eight (HSC2, HSC3, HSC4, OSC19, OSC20, OSC30, OSC70, and HOC621) showed only partial methylation. Notably, expression of RASSF2 was downregulated despite sparse methylation in cell lines such as OSC20 and HOC621. Furthermore, expression was restored by treatment with 5‐aza‐dC in these cell lines, indicating that RASSF2 may also be induced by mechanisms other than promoter demethylation.
Figure 2.
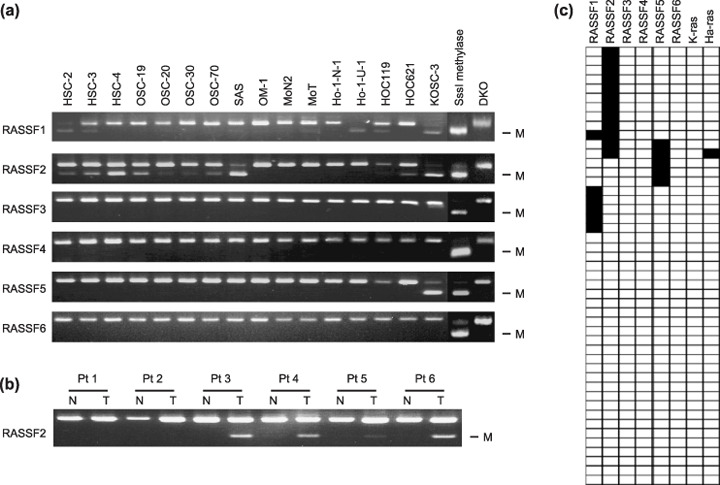
Analysis of RASSF gene methylation in oral squamous cell carcinoma (OSCC). (a) Combined bisulfite restriction analysis (COBRA) was carried out using DNA treated with Na‐bisulfite. The cell lines are shown at the top. DNA treated with SssI methylase served as a positive control. DNA from HCT116 cells in which the DNMT1 and DNMT3B loci were knocked out served as a negative control. M, methylated alleles. (b) Analysis of RASSF2 methylation in primary OSCC. COBRA was used to analyze RASSF2 methylation in primary OSCC specimens and corresponding samples of normal tissue. N, normal tissues adjacent to tumors; T, tumors. (c) Profiles of RASSF gene methylation and mutation of K‐ras and Ha‐ras in 46 primary OSCC. Cases in which methylation or mutation was detected are shown as solid boxes. The genes analyzed are shown at the top.
When we then used bisulfite sequencing to examine 37 CpG sites in the region around exons 1A and 1B, we detected dense methylation in KOSC3 and SAS cells, partial methylation in HSC4 and OSC19 cells, and little methylation in Ho‐1‐n‐1 and Ho‐1‐u‐1 cells (Fig. 3a,b). Thus, the results obtained with bisulfite sequencing were consistent with the COBRA data and the RASSF2 expression status (Fig. 3b). After treatment with 5‐aza‐dC, significant demethylation was detected in KOSC3 and OSC19 cells, whereas only a few CpG sites in a few HSC4 and SAS clones were demethylated (Fig. 3c).
Figure 3.
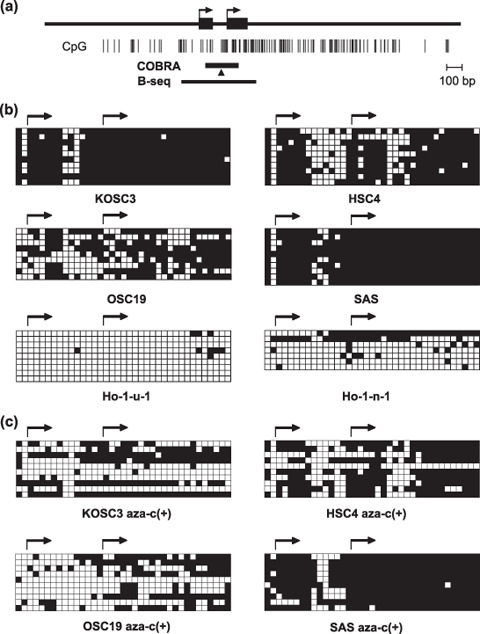
Bisulfite sequencing of RASSF2. (a) Schematic representation of the RASSF2A CpG island. CpG sites are indicated by vertical bars; the region analyzed by combined bisulfite restriction analysis (COBRA) and bisulfite sequencing is indicated by a solid bar. Arrows indicate the transcription start sites. Arrowhead indicates the CpG site analyzed by COBRA. The cell lines studied are shown below the columns. (b) Open squares indicate unmethylated CpG sites; filled squares indicate methylated CpG sites. (c) Demethylation of RASSF2 in OSCC cells treated with 2 µM 5‐aza‐dC for 72 h. The cell lines examined are shown below the column.
In KOSC3 cells, a low level of RASSF2 expression was detected despite dense methylation of 5′‐CpG islands. To examine whether isoforms generated by alternative splicing of exon 1 were expressed in OSCC cells, we carried out reverse transcription (RT)‐PCR using primer sets amplifying two different isoforms of RASSF2. Expression of variant 1 of RASSF2 was detected in normal tongue and unmethylated cell lines, and no or only negligible expression was detected for variant 2 of RASSF2 (Suppl. Fig. 1).
We also examined the methylation of RASSF1–6 in 46 primary OSCC specimens. Methylation of RASSF1, RASSF2, and RASSF5 was detected in six (13%), 12 (26%), and five (11%) of the tumors, respectively (Fig. 2b,c). In total, 18 of the 46 (39%) primary OSCC showed methylation of at least one RASSF gene (Fig. 2c). By contrast, only a single tumor showed a Ras mutation (H‐ras) (Fig. 2c). Methylation of RASSF2 was also examined in 31 specimens of non‐cancerous tongue tissue, but no methylation was detected.
Oral squamous cell carcinoma patients with RASSF2 methylation tended to be older than those without methylation (74.1 vs 61.4 years, P = 0.009), but there was no significant difference in any other clinicopathological feature, including sex, tumor location, stage, metastasis, or smoking status, between OSCC with and without RASSF2 methylation (Suppl. Table S1).
Suppression of cell growth by RASSF2. We next carried out a set of colony‐formation assays with cells transfected with either the full‐length RASSF2 gene or a deletion mutant to determine whether RASSF2 has tumor‐suppressor activity in OSCC cells and, if so, which part of the molecule is involved (Fig. 4a). Expression of the transfected vector encoding each form of RASSF2 was confirmed by RT‐PCR and western blot analysis (Suppl. Fig. S1). Introduction of full‐length RASSF2 into HSC4 and OSC19 cells, which do not otherwise express the gene due to its methylation, resulted in growth suppression (Fig. 4b,c). Transfection of RASSF2‐ΔN, whose product lacks the N‐terminal region but retains the Ras‐association domain, suppressed growth even more strongly than full‐length RASSF2 in both HSC4 and OSC19 cells. Transfection of RASSF2‐ΔC, whose product lacks the C‐terminal region, including the RA domain, showed less tumor‐suppressor activity in HSC4 cells.
Figure 4.
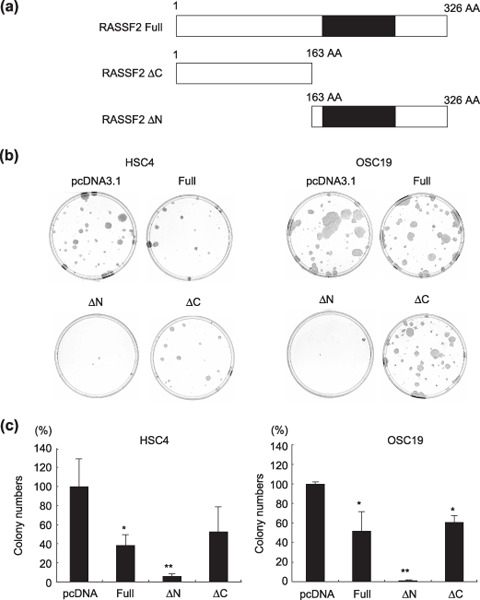
Suppression of cell growth by RASSF2. (a) Schematic diagrams of RASSF2 and the deletion mutants used. (b,c) Suppression of growth evaluated by assaying geneticin‐resistant colony formation. HSC4 and OSC19 cells were transfected with either pCDNA3.1 (control plasmid), RASSF2A, RASSF2‐ΔN, or RASSF2A‐ΔC and incubated with 0.6 mg/mL G418 in the RPMI‐1640 medium. After 14 days, plates were stained with Giemsa solution (b), and the colonies were counted (c). The bars indicate mean ± SD of three independent experiments. *P < 0.05, **P < 0.01 versus vector control (pcDNA).
Induction of apoptosis by RASSF2. We then tested whether introduction of RASSF2 into OSCC cells would induce apoptosis. Immunocytochemical analysis showed that the methylated OSC19 cell line did not express RASSF2, whereas unmethylated Ho‐1‐u‐1 and MoT cells did so (Fig. 5a). When we introduced RASSF2 into OSC19 cells using an adenoviral vector, apoptosis was induced by the expressed RASSF2 (Fig. 5a,b). By contrast, introduction of RASSF2 lacking its C‐terminal domain had little effect on apoptosis, confirming the role of the RA domain in the induction of apoptosis.
Figure 5.
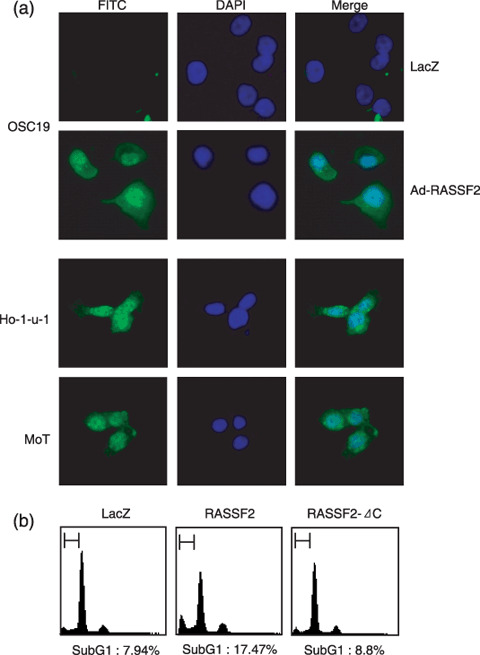
Induction of apoptosis by RASSF2. (a) Immunocytochemical analysis of RASSF2 in OSC19 cells infected with either Ad‐RASSF2 or Ad‐LacZ. RASSF2 was visualized using a fluorescein isothiocyanate (FITC)‐conjugated secondary antibody. Nuclei were stained with 4′,6‐diamidino‐2‐phenylindole (DAPI). Ho‐1‐u‐1 and MoT cells were also examined as positive controls for RASSF2 expression. (b) Flow cytometric analysis of the pro‐apoptotic effect of RASSF2 in OSC19 cells. The incidence of sub‐G1 cells was determined 72 h after infection.
Genes regulated by RASSF2 in OSCC cell lines. To better understand the molecular mechanism underlying the tumor‐suppressor activity of RASSF2, we used a gene microarray to determine the genes regulated by RASSF2. We found that infecting HSC4 cells with Ad‐RASSF2 led to upregulation of 322 genes (Suppl. Table S2) and downregulation of 181 genes (Suppl. Table S3).
Gene ontology analysis revealed that among the genes downregulated by RASSF2, there was a significant overrepresentation of genes involved in inflammation and immune‐cell chemotaxis (Suppl. Table S4). The results of the microarray analysis were confirmed by real‐time PCR (Fig. 6).
Figure 6.
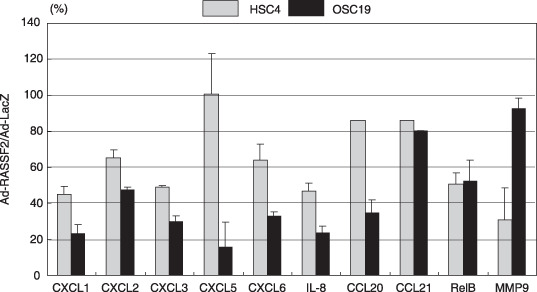
Identification of the genes regulated by RASSF2. Real‐time polymerase chain reaction analysis confirming the results of the microarray analysis. Expression of putative RASSF2 target genes was examined using cDNA from HSC4 and OSC19 cells infected with Ad‐RASSF2. HSC4 and OSC19 cells infected with Ad‐LacZ served as a control, and the Ad‐RASSF2/Ad‐LacZ ratio is shown on the y‐axis. The genes examined are shown below the columns; the bars indicate SE.
Suppression of transcriptional activity of NF‐kB by RASSF2. Finally, because many of the genes downregulated by RASSF2 are reportedly targets of NF‐κB( 26 , 27 , 28 ) we tested whether their downregulation was associated with suppression of NF‐κB by RASSF2. Consistent with that idea, we found that infection of OSC19 cells with Ad‐RASSF2 significantly suppressed NF‐κB luciferase activity (Fig. 7a) and significantly diminished nuclear levels of NF‐κB/p50 (Fig. 7b).
Figure 7.
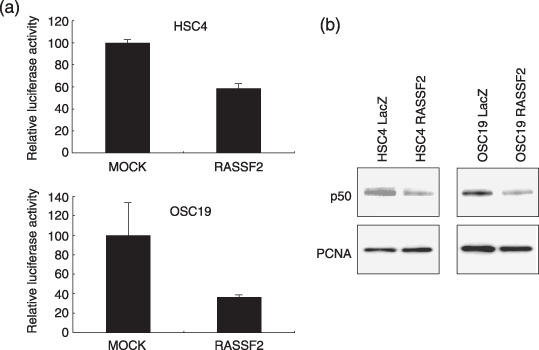
Suppression of nuclear factor (NF)‐κB activity by RASSF2. (A) HSC4 and OSC19 cells were infected with Ad‐RASSF2, and the transcriptional activity of NF‐κB was examined using a luciferase reporter plasmid. Ad‐lacZ served as the control. (B) Western analysis of nuclear NF‐κB/p50. Nuclear lysates from HSC4 and OSC19 cells infected with Ad‐RASSF2 were immunoblotted using anti‐p50 antibody. Cell lysates from cells infected with Ad‐LacZ served as the control. Levels of proliferating cell nuclear antigen (PCNA) protein were used as a loading control.
Discussion
In the present study, we examined the functional consequences of epigenetic inactivation of RASSF family genes in OSCC. Ras signaling, which enhances cell growth and survival, inflammatory responses, and angiogenesis,( 29 , 30 ) is activated in various types of tumors.( 13 ) Although Japanese OSCC patients rarely show mutation of K‐ras or Ha‐Ras, activation of the Ras signaling pathway may occur via oncogenic signaling mediated by cytokines or as a result of viral infection.( 31 , 32 ) Our results suggest expression of RASSF genes, which encode negative effectors of RAS, is silenced in approximately 40% of OSCC, suggesting that they play a key role in OSCC tumorigenesis.
The molecular mechanism of how RASSF2 expression is upregulated by 5‐aza‐dC in OSCC cell lines that show sparse methylation remains to be determined. A previous report indicates that RASSF2 is induced by genotoxic stress.( 33 ) Therefore, it could be possible that upregulation of RASSF2 may partly be caused by DNA damage induced by 5‐aza‐dC.( 34 ) Alternatively, demethylation of transcription factors of RASSF2 may induce gene expression in some cases. Obviously, multiple mechanisms appear to play a role in silencing RASSF2, and further study will be necessary to clarify the molecular mechanisms of RASSF2 silencing in cancer. KOSC3 cells, which showed dense methylation of RASSF2, expressed a small amount of gene transcript even before treatment with 5‐aza‐dC. Expression of RASSF2 in KOSC3 cells may be caused by leaky expression from methylated alleles, although the molecular mechanisms are unclear. Alternatively, rare unmethylated clones, which were not detected by COBRA or bisulfite sequencing, expressed the gene.
The molecular mechanism by which RASSF2 acts as a tumor suppressor is poorly understood. We suggest that our finding that RASSF2 lacking its C‐terminal domain (RASSF2‐ΔC) did not show pro‐apoptotic activity is indicative of the RA domain's importance for tumor‐suppressor activity. In fact, RASSF2 containing only the C‐terminal region (RASSF2‐ΔN) showed strong tumor‐suppressive activity in colony‐formation assays. However, RASSF2‐ΔC also weakly suppressed the growth of OSC19 cells, suggesting that multiple domains may be involved in the tumor‐suppressor activity of RASSF2. Further study will be necessary to resolve the respective functions of each RASSF2 domain.
Microarray analysis of genes regulated by RASSF2 showed that gene expression of CXC chemokines, which play key roles in both wound healing and tumorigenesis and are expressed by various types of cancer cells,( 35 ) is downregulated by RASSF2. In contrast, MMP9 is expressed strongly in OSCC and is associated with tumor metastasis and prognosis.( 36 ) In addition, expression of the C–C chemokine CCL20 is reportedly associated with immune responses to bacterial infections in OSCC, and may be involved in tumor growth.( 37 ) These results indicate that epigenetic inactivation of RASSF2 contributes to tumorigenesis through altered expression of a variety chemokines and enzymes.
Although the molecular mechanisms by which RASSF2 modulates the expression of these various genes are not fully understood, our results indicate that RASSF2 inhibits the transcriptional activity of NF‐κB (Fig. 7a,b). It has been reported that Ras stimulates NF‐κB activation via AKT, which phosphorylates and thus activates I‐κB kinase (IKK). IKK in turn phosphorylates the inhibitory protein I‐κB, thereby releasing NF‐κB from cytoplasmic sequestration and enabling its translocation to the nucleus.( 38 ) The genes shown by our microarray analysis to be targeted by RASSF2 are in fact inducible by NF‐κB.( 39 , 40 , 41 ) Given that inhibition of Ras may suppress phosphoinositide‐3‐kinase (PI3K)–AKT signaling, leading to activation of IKK–NF‐κB, our findings suggest that the effect of RASSF2 on NF‐κB may be indirect. On the other hand, recently reported findings suggest that RASSF6 directly suppresses NF‐κB activity( 42 ) and imply that RASSF2 has a lesser effect on the NF‐κB pathway than RASSF6. Inactivation of RASSF2 tends to occur in some cancer types, including colon and gastric cancers, but not in breast and ovarian cancers( 19 , 20 ) so that variation in the effect of RASSF2 on the NF‐κB pathway may in part reflect differences in cancer types.
In summary, we found that RASSF2 is silenced by DNA methylation in OSCC. Ectopic expression of RASSF2 suppressed cell growth and induced apoptosis in OSCC cells that otherwise do not express RASSF2. We also found that the pro‐apoptotic activity of RASSF2 was associated with its cytoplasmic form, and that RASSF2 suppresses the transcriptional activity of NF‐κB. These results not only shed light on the pathogenesis of OSCC, but also suggest that RASSF2 methylation may be a useful molecular target for the diagnosis and treatment of OSCC.
Supporting information
Fig. S1. Expression of two isoforms of RASSF2 in oral squamous cell carcinoma cell lines.
Fig. S2. Analysis of RASSF2, RASSF2‐ΔN, and RASSF‐ΔC expression following transfection into oral squamous cell carcinoma cell lines.
Table S1. Clinicopathological features of oral squamous cell carcinoma with and without methylation of RASSF2
Table S2. Genes upregulated by RASSF2
Table S3. Genes downregulated by RASSF2
Table S4. Ontology analysis of genes downregulated by RASSF2
Please note: Blackwell Publishing are not responsible for the content or functionality of any supplementary materials supplied by the authors. Any queries (other than missing material) should be directed to the corresponding author for the article.
Supporting info item
Supporting info item
Supporting info item
Supporting info item
Supporting info item
Supporting info item
Acknowledgments
The authors thank Dr William F. Goldman for editing the manuscript. This study was supported in part by Grants‐in‐Aid for Scientific Research on Priority Areas from the Ministry of Education, Culture, Sports, Science, and Technology (M. T., K. I. and T. T.), Grants‐in‐Aid for Scientific Research (S) from the Japan Society for Promotion of Science (K. I.), a Grant‐in‐Aid for the Third‐term Comprehensive 10‐year Strategy for Cancer Control, and a Grant‐in‐Aid for Cancer Research from the Ministry of Health, Labor, and Welfare, Japan (M. T). M. T. is a scholar of the Kobayashi Institute for Innovative Cancer Therapy.
References
- 1. Parkin DM, Bray F, Ferlay J, Pisani P. Global cancer statistics, 2002. CA Cancer J Clin 2005; 55: 74–108. [DOI] [PubMed] [Google Scholar]
- 2. Gangane N, Chawla S, Subodh A, Gupta S, Sharma SM. Reassessment of risk factors for oral cancer. Asian Pac J Cancer Prev 2007; 8: 243–8. [PubMed] [Google Scholar]
- 3. Petti S, Scully C. Oral cancer: the association between nation‐based alcohol‐drinking profiles and oral cancer mortality. Oral Oncol 2005; 41: 828–34. [DOI] [PubMed] [Google Scholar]
- 4. Chiba I, Shindoh M, Yasuda M et al . Mutations in the p53 gene and human papillomavirus infection as significant prognostic factors in squamous cell carcinomas of the oral cavity. Oncogene 1996; 12: 1663–8. [PubMed] [Google Scholar]
- 5. Ha PK, Califano JA. Promoter methylation and inactivation of tumour‐suppressor genes in oral squamous‐cell carcinoma. Lancet Oncol 2006; 7: 77–82. [DOI] [PubMed] [Google Scholar]
- 6. Ogi K, Toyota M, Ohe‐Toyota M et al . Aberrant methylation of multiple genes and clinicopathological features in oral squamous cell carcinoma. Clin Cancer Res 2002; 8: 3164–71. [PubMed] [Google Scholar]
- 7. Ushijima T, Okochi‐Takada E. Aberrant methylations in cancer cells: where do they come from? Cancer Sci 2005; 96: 206–11. [DOI] [PMC free article] [PubMed] [Google Scholar]
- 8. Issa JP. DNA methylation as a therapeutic target in cancer. Clin Cancer Res 2007; 13: 1634–7. [DOI] [PubMed] [Google Scholar]
- 9. Nakayama S, Sasaki A, Mese H et al . The E‐cadherin gene is silenced by CpG methylation in human oral squamous cell carcinomas. Int J Cancer 2001; 93: 667–73. [DOI] [PubMed] [Google Scholar]
- 10. Ogi K, Toyota M, Mita H et al . Small interfering RNA‐induced CHFR silencing sensitizes oral squamous cell cancer cells to microtubule inhibitors. Cancer Biol Ther 2005; 4: 773–80. [DOI] [PubMed] [Google Scholar]
- 11. Shaw RJ, Liloglou T, Rogers SN et al . Promoter methylation of P16, RARβ, E‐cadherin, cyclin A1 and cytoglobin in oral cancer: quantitative evaluation using pyrosequencing. Br J Cancer 2006; 94: 561–8. [DOI] [PMC free article] [PubMed] [Google Scholar]
- 12. Tran TN, Liu Y, Takagi M, Yamaguchi A, Fujii H. Frequent promoter hypermethylation of RASSF1A and p16INK4a and infrequent allelic loss other than 9p21 in betel‐associated oral carcinoma in a Vietnamese non‐smoking/non‐drinking female population. J Oral Pathol Med 2005; 34: 150–6. [DOI] [PubMed] [Google Scholar]
- 13. Schubbert S, Shannon K, Bollag G. Hyperactive Ras in developmental disorders and cancer. Nat Rev Cancer 2007; 7: 295–308. [DOI] [PubMed] [Google Scholar]
- 14. Kuo MY, Jeng JH, Chiang CP, Hahn LJ. Mutations of K‐ras oncogene codon 12 in betel quid chewing‐related human oral squamous cell carcinoma in Taiwan. J Oral Pathol Med 1994; 23: 70–4. [DOI] [PubMed] [Google Scholar]
- 15. Munirajan AK, Mohanprasad BK, Shanmugam G, Tsuchida N. Detection of a rare point mutation at codon 59 and relatively high incidence of H‐ras mutation in Indian oral cancer. Int J Oncol 1998; 13: 971–4. [DOI] [PubMed] [Google Scholar]
- 16. Sakai E, Rikimaru K, Ueda M et al . The p53 tumor‐suppressor gene and ras oncogene mutations in oral squamous‐cell carcinoma. Int J Cancer 1992; 52: 867–72. [DOI] [PubMed] [Google Scholar]
- 17. Dammann R, Li C, Yoon JH et al . Epigenetic inactivation of a RAS association domain family protein from the lung tumour suppressor locus 3p21. 3 Nat Genet 2000; 25: 315–19. [DOI] [PubMed] [Google Scholar]
- 18. Dammann R, Yang G, Pfeifer GP. Hypermethylation of the cpG island of Ras association domain family 1A (RASSF1A), a putative tumor suppressor gene from the 3p21.3 locus, occurs in a large percentage of human breast cancers. Cancer Res 2001; 61: 3105–9. [PubMed] [Google Scholar]
- 19. Akino K, Toyota M, Suzuki H et al . The Ras effector RASSF2 is a novel tumor‐suppressor gene in human colorectal cancer. Gastroenterology 2005; 129: 156–69. [DOI] [PubMed] [Google Scholar]
- 20. Endoh M, Tamura G, Honda T et al . RASSF2, a potential tumour suppressor, is silenced by CpG island hypermethylation in gastric cancer. Br J Cancer 2005; 93: 1395–9. [DOI] [PMC free article] [PubMed] [Google Scholar]
- 21. Hesson LB, Wilson R, Morton D et al . CpG island promoter hypermethylation of a novel Ras‐effector gene RASSF2A is an early event in colon carcinogenesis and correlates inversely with K‐ras mutations. Oncogene 2005; 24: 3987–94. [DOI] [PubMed] [Google Scholar]
- 22. Kaira K, Sunaga N, Tomizawa Y et al . Epigenetic inactivation of the RAS‐effector gene RASSF2 in lung cancers. Int J Oncol 2007; 31: 169–73. [PubMed] [Google Scholar]
- 23. Zhang Z, Van Sun D, Do N et al . Inactivation of RASSF2A by promoter methylation correlates with lymph node metastasis in nasopharyngeal carcinoma. Int J Cancer 2007; 120: 32–8. [DOI] [PubMed] [Google Scholar]
- 24. Ueno M, Toyota M, Akino K et al . Aberrant methylation and histone deacetylation associated with silencing of SLC5A8 in gastric cancer. Tumour Biol 2004; 25: 134–40. [DOI] [PubMed] [Google Scholar]
- 25. Clark SJ, Harrison J, Paul CL, Frommer M. High sensitivity mapping of methylated cytosines. Nucl Acids Res 1994; 22: 2990–7. [DOI] [PMC free article] [PubMed] [Google Scholar]
- 26. Elewaut D, DiDonato JA, Kim JM et al . NF‐κB is a central regulator of the intestinal epithelial cell innate immune response induced by infection with enteroinvasive bacteria. J Immunol 1999; 163: 1457–66. [PubMed] [Google Scholar]
- 27. Kimura YN, Watari K, Fotovati A et al . Inflammatory stimuli from macrophages and cancer cells synergistically promote tumor growth and angiogenesis. Cancer Sci 2007; 98: 2009–18. [DOI] [PMC free article] [PubMed] [Google Scholar]
- 28. Yamanaka N, Morisaki T, Nakashima H et al . Interleukin 1β enhances invasive ability of gastric carcinoma through nuclear factor‐κB activation. Clin Cancer Res 2004; 10: 1853–9. [DOI] [PubMed] [Google Scholar]
- 29. Cox AD, Der CJ. The dark side of Ras: regulation of apoptosis. Oncogene 2003; 22: 8999–9006. [DOI] [PubMed] [Google Scholar]
- 30. Sparmann A, Bar‐Sagi D. Ras oncogene and inflammation: partners in crime. Cell Cycle 2005; 4: 735–6. [DOI] [PubMed] [Google Scholar]
- 31. Hocker M, Rosenberg I, Xavier R et al . Oxidative stress activates the human histidine decarboxylase promoter in AGS gastric cancer cells. J Biol Chem 1998; 273: 23 046–54. [DOI] [PubMed] [Google Scholar]
- 32. Reimers N, Kasper HU, Weissenborn SJ et al . Combined analysis of HPV‐DNA, p16 and EGFR expression to predict prognosis in oropharyngeal cancer. Int J Cancer 2007; 120: 1731–8. [DOI] [PubMed] [Google Scholar]
- 33. Sakamoto‐Hojo ET, Mello SS, Pereira E et al . Gene expression profiles in human cells, submitted to genotoxic stress. Mutat Res 2003; 544: 403–13. [DOI] [PubMed] [Google Scholar]
- 34. Kiziltepe T, Hideshima T, Catley L et al . 5‐Azacytidine, a DNA methyltransferase inhibitor, induces ATR‐mediated DNA double‐strand break responses, apoptosis, and synergistic cytotoxicity with doxorubicin and bortezomib against multiple myeloma cells. Mol Cancer Ther 2007; 6: 1718–27. [DOI] [PubMed] [Google Scholar]
- 35. Balkwill F. Cancer and the chemokine network. Nat Rev Cancer 2004; 4: 540–50. [DOI] [PubMed] [Google Scholar]
- 36. Katayama A, Bandoh N, Kishibe K et al . Expressions of matrix metalloproteinases in early‐stage oral squamous cell carcinoma as predictive indicators for tumor metastases and prognosis. Clin Cancer Res 2004; 10: 634–40. [DOI] [PubMed] [Google Scholar]
- 37. Abiko Y, Nishimura M, Kusano K et al . Expression of MIP‐3α/CCL20, a macrophage inflammatory protein in oral squamous cell carcinoma. Arch Oral Biol 2003; 48: 171–5. [DOI] [PubMed] [Google Scholar]
- 38. Romashkova JA, Makarov SS. NF‐κB is a target of AKT in anti‐apoptotic PDGF signalling. Nature 1999; 401: 86–90. [DOI] [PubMed] [Google Scholar]
- 39. Andela VB, Schwarz EM, Puzas JE, O’Keefe RJ, Rosier RN. Tumor metastasis and the reciprocal regulation of prometastatic and antimetastatic factors by nuclear factor κB. Cancer Res 2000; 60: 6557–62. [PubMed] [Google Scholar]
- 40. Bobrovnikova‐Marjon EV, Marjon PL, Barbash O, Vander Jagt DL, Abcouwer SF. Expression of angiogenic factors, vascular endothelial growth factor and interleukin‐8/CXCL8 is highly responsive to ambient glutamine availability: role of nuclear factor‐κB and activating protein‐1. Cancer Res 2004; 64: 4858–69. [DOI] [PubMed] [Google Scholar]
- 41. Sparmann A, Bar‐Sagi D. Ras‐induced interleukin‐8 expression plays a critical role in tumor growth and angiogenesis. Cancer Cell 2004; 6: 447–58. [DOI] [PubMed] [Google Scholar]
- 42. Allen NP, Donninger H, Vos MD et al . RASSF6 is a novel member of the RASSF family of tumor suppressors. Oncogene 2007; 26: 6203–11. [DOI] [PubMed] [Google Scholar]
Associated Data
This section collects any data citations, data availability statements, or supplementary materials included in this article.
Supplementary Materials
Fig. S1. Expression of two isoforms of RASSF2 in oral squamous cell carcinoma cell lines.
Fig. S2. Analysis of RASSF2, RASSF2‐ΔN, and RASSF‐ΔC expression following transfection into oral squamous cell carcinoma cell lines.
Table S1. Clinicopathological features of oral squamous cell carcinoma with and without methylation of RASSF2
Table S2. Genes upregulated by RASSF2
Table S3. Genes downregulated by RASSF2
Table S4. Ontology analysis of genes downregulated by RASSF2
Please note: Blackwell Publishing are not responsible for the content or functionality of any supplementary materials supplied by the authors. Any queries (other than missing material) should be directed to the corresponding author for the article.
Supporting info item
Supporting info item
Supporting info item
Supporting info item
Supporting info item
Supporting info item