

Abstract
Histopathological classification of gliomas is often clinically inadequate due to the diversity of tumors that fall within the same class. The goal of the present study was to identify prognostic molecular features in diffusely infiltrating gliomas using gene expression profiling. We selected 3456 genes expressed in gliomas, including 3012 genes found in a gliomal expressed sequence tag collection. The expression levels of these genes in 152 gliomas (100 glioblastomas, 21 anaplastic astrocytomas, 19 diffuse astrocytomas, and 12 anaplastic oligodendrogliomas) were measured using adapter‐tagged competitive polymerase chain reaction, a high‐throughput reverse transcription–polymerase chain reaction technique. We applied unsupervised and supervised principal component analyses to elucidate the prognostic molecular features of the gliomas. The gene expression data matrix was significantly correlated with the histological grades, oligo‐astro histology, and prognosis. Using 110 gliomas, we constructed a prediction model based on the expression profile of 58 genes, resulting in a scheme that reliably classified the glioblastomas into two distinct prognostic subgroups. The model was then tested with another 42 tissues. Multivariate Cox analysis of the glioblastoma patients using other clinical prognostic factors, including age and the extent of surgical resection, indicated that the gene expression profile was a strong and independent prognostic parameter. The gene expression profiling identified clinically informative prognostic molecular features in astrocytic and oligodendroglial tumors that were more reliable than the traditional histological classification scheme. (Cancer Sci 2009; 100: 165–172)
Abbreviations:
- AA
anaplastic astrocytoma
- ACNU
numustine
- AO
anaplastic oligodendroglioma
- ATAC‐PCR
adaptor‐tagged competitive polymerase chain reaction
- DA
diffuse astrocytoma
- EST
expressed sequence tag
- GB
glioblastoma
- KNOG
Kyoto Neuro‐Oncology Group
- LDA
linear discriminant analysis
- MDA
M.D. Anderson Cancer Center
- MGH
Massachusetts General Hospital
- MGMT
O6‐methyl guanine methyltransferase
- MRI
magnetic resonance imaging
- OS
overall survival
- PC1
first principal component
- PCA
principal component analysis
- PFS
progression‐free survival
- RT‐PCR
reverse transcription–polymerase chain reaction
Despite being critical for treatment outcomes, precisely assessing the risk of a glioma using histological classification fails to address the heterogeneity of responses to therapy among patients within the same histological class, indicating that the classification system is not an adequate predictor of the clinical behavior of the tumor.( 1 ) However, recent studies suggest that molecular approaches are useful for identifying prognostic markers. Genetic analyses have shown that allelic loss of chromosomes 1p and 19q is a strong predictor of longer survival in patients with oligodendroglial tumors.( 2 ) Furthermore, MGMT promoter methylation was found to be an independently favorable prognostic factor in GB patients.( 3 )
In addition to genomic changes in glioma cells, gene expression profiling is expected to elucidate molecular features related to clinical parameters. Application of this method to glioma patients will not only help clinicians make an optimal clinical decision, but also lead to possibilities for personalized, pathway‐targeted therapies in the future.
In the present report, we describe high‐throughput RT‐PCR‐based gene expression profiling of more than 150 gliomas. Previously we established a molecular diagnostic system for AO and GB, using part of the data matrix.( 4 ) We extended the study, and identified specific gene expression patterns that can be used to classify GB into two distinct subgroups, which are strongly predictive of prognosis.
Materials and Methods
Patient characteristics. We obtained 169 glioma specimens from patients who underwent surgical resection at Kyoto University Hospital or nearby regional hospitals between 1998 and 2005. The majority of the patients were recruited from a phase II clinical trial (the KNOG study).( 5 ) The protocol for the present study was approved by the Institutional Review Board of Kyoto University. Written informed consent was obtained from each of the patients.
The following samples were excluded from the study: samples with evidence of previous chemoradiation therapy within the last 10 years (five samples), insufficient tumor content (four samples), poor expression data quality (two samples), or the presence of pilocytic astrocytoma (six samples). In total, 152 samples, including 100 GB, 21 AA, 19 DA, and 12 AO, were eligible for further analysis. The specimens were examined histologically at the primary hospitals according to the World Health Organization's 2000 criteria.( 6 ) The original slides were reviewed by the Kyoto University Pathology Unit for the final diagnosis. The samples were collected at the time of the initial surgery without any prior treatment, except for one sample of recurrent AO collected 14 years after the initial treatment, which included radiotherapy. The preoperative Karnofsky performance status score was at least 50 for each of the cases. The extent of surgical resection was classified into one of three categories according to postoperative MRI carried out shortly after surgery: complete resection, incomplete resection, or biopsy. Complete resection was defined as no evidence of enhanced lesion or T1 abnormality in non‐enhanced tumors using postoperative MRI. All patients received fractionated local radiotherapy with or without ACNU‐based chemotherapy, except for one case of diffuse astrocytoma that was not treated with any adjuvant therapy, and one case of recurrent AO that was treated with adjuvant chemotherapy alone. Seventy‐three of the 100 GB patients were treated according to the regimen from the KNOG study. For tumor progression, the patients underwent a second operation if possible, and received further chemotherapy for most of the cases.
RNA and DNA isolation. In all cases, tumor specimens were dissected into two portions at surgery, one for histological diagnosis and the other for molecular experiments. The tumor specimens for molecular research were immediately snap frozen at surgical resection, and kept at –80°C until use. Total RNA was extracted from 100 mg of the tumor specimen with Trizol reagent (Invitrogen, Carlsbad, CA, USA) according to the manufacturer's instructions. Tumor specimens containing 20% or more of non‐tumor or necrotic areas were excluded from further analysis. Genomic DNA was isolated utilizing a QIAamp DNA Mini Kit (Qiagen, Valencia, CA, Germany) according to the manufacturer's instructions.
Gene expression analysis. The expression of genes was measured by ATAC‐PCR. Selection of the genes examined was based on an EST sequencing survey of the genes expressed in 12 glioma tissues as described previously.( 7 ) We identified 3012 unique sequences from the EST collection, and prepared 3456 primers for ATAC‐PCR, including primers to survey an additional 444 genes selected from a literature survey. The ATAC‐PCR procedure has been described previously.( 8 ) The complete list of genes and expression data from the present study are shown in a supporting file. The expression data will be deposited into Center for Information Biology gene EXpression database (CIBEX) at the DNA Data Bank of Japan.
Methylation‐specific PCR. DNA methylation patterns in the CpG islands of the MGMT gene were determined as described previously.( 3 , 9 )
Statistical methods.
Survival data. OS and PFS were defined as the period from surgery to death and that from surgery to radiological detection of tumor progression, respectively. Tumor progression was evaluated according to the criteria of the committee of the Brain Tumor Registry (Japan): a 25% increase in tumor size, appearance of new lesions, or obvious deterioration due to mass effects or perifocal edema.( 10 ) A radiological examination was carried out every 2 or 3 months postoperatively in high‐grade glioma patients, and immediately after neurological deterioration was detected.
Data preparation and preprocessing. The raw expression data were first adjusted to correct for variations due to different sample mRNA concentrations by dividing each value by the corresponding median value. Values less than 0.05 and more than 20 were converted to 0.05 and 20, respectively. The entire data matrix was then converted to a logarithmic scale. Genes for which 20% of the data were missing were excluded from statistical analysis after missing value imputation using BPCAfill.( 11 ) The gene expression levels were then normalized so that the genewise mean for each sample became zero.
For the analysis with external data sets, we obtained data for 24 genes from the MGH data set( 12 ) and 55 genes from the MDA data set( 13 ) for the profile of 58 genes. After a logarithmic conversion, normalization was carried out so that the average gene expression level for each gene was zero. Zero was used as the value when data were not available.
Feature extraction. We used two feature‐extraction methods to obtain effective coordinate axes onto which each data vector could be projected appropriately. Unsupervised principal component analysis (PCA) was used to extract axes (principal axes) representing variations in sample expression vectors. Because the vector dimensionality (i.e. the number of genes) was larger than the number of vectors (i.e. the number of patients), we carried out singular value decomposition to obtain the principal axes.( 14 )
The second method was LDA, which searches for an axis on which the signal‐to‐noise ratio between the projected data and the biological and clinical labels of interest is maximized. In the present study, LDA was carried out after the gene expression matrix had been projected onto a two‐dimensional principal component space generated by unsupervised PCA. The combination of LDA and PCA is also known as a principal component regression, which rarely over‐fits when dimensionality is reduced enough by the PCA process. A low‐dimensional relationship between the samples and the biological and clinical labels was obtained.
Cox proportional hazards regression. To select genes for the prognosis prediction model, for which the target was PFS (see supervised PCA below), we evaluated the significance of the correlation with PFS using univariate Cox tests (the log‐rank test).
In addition, multivariate Cox proportional hazard regression was used to calculate regression coefficients between possible prognostic genes and PFS of the corresponding patients; the obtained coefficient vector represented an axis with coordinates that showed the strongest correlation with PFS. As with the LDA, calculations were carried out after the application of PCA, which extracted two‐dimensional representations. Cox's analyses were done by our original Matlab 6.5 implementation that mimicked Cox's analysis modules in XploRe (http://www.xplore‐stat.de/), a web‐based statistics software.
Among the GB patients, the significance of the final molecular classification compared to the other prognostic factors was evaluated using multivariate Cox analysis. We included both the training and test sets for the analyses.
Supervised PCA. When constructing the prognosis prediction model whose target was PFS, we used supervised PCA, in which genes correlated with a variable of interest (here, PFS) were selected first. Supervised PCA was then carried out in the subspace represented by the selected genes. The resulting PC1 score exhibited a strong correlation with the variable.( 15 ) In the present study, the genes correlated with PFS were selected using Cox proportional hazards regression.
Results
We carried out survival analysis on 152 tissue samples (100 GB, 21 AA, 19 DA, and 12 AO). Because the survival benefits of various chemotherapeutic regimens for glioma, especially GB, are not distict,( 16 , 17 , 18 , 19 ) with the exception of that associated with temozolomide,( 20 , 21 ) we included all of the cases in the survival analysis irrespective of the chemotherapy treatment. After data processing, we obtained a data matrix consisting of 3225 genes from the 152 samples. We divided the data matrix into two – one set consisted of 110 patients (the training set) and the other contained 42 patients (the test set) – by selecting samples that arrived at the laboratory at earlier dates for the training set.
The samples that were used as the training set consisted of 77 GB, 11 AA, 11 DA, and 11 AO. The median age at surgery of the associated patients was 54 years (range 21–82 years). The median follow‐up period for the survivors with GB was 19.5 months (range 3–62 months). Among the 77 GB patients, 61 patients showed tumor progression and 48 patients died. The median PFS and OS periods in the GB patients were 7 and 14 months, respectively. Data about OS is generally more accurate than that for PFS. However, because the PFS data were carefully obtained following the strict guidelines of the KNOG study,( 5 ) the quality of the PFS data was comparable to that of the OS data. Because OS may be affected by treatment bias at the time of tumor progression, such as a second operation, and there was a good correlation between OS and PFS (correlation coefficient 0.96), we adopted PFS as the clinical parameter that most accurately represented the aggressiveness of the gliomas in each patient.
Unsupervised PCA of the training data set revealed that the cumulative contribution ratios of the top six principal components were 0.9076, 0.9500, 0.9595, 0.9673, 0.9719, and 0.9773. We plotted the samples on a plane constructed using the first two components. The resulting scatter diagram demonstrated that the sample distributions were related to the histological classes, indicating a close correlation between the global gene expression patterns and the histology of the samples, such as malignancy grades and oligo‐astrocytic characteristics. Interestingly, relatively favorable GB cases with PFS periods of 2 years or more were located closer to the AO area (Fig. 1).
Figure 1.
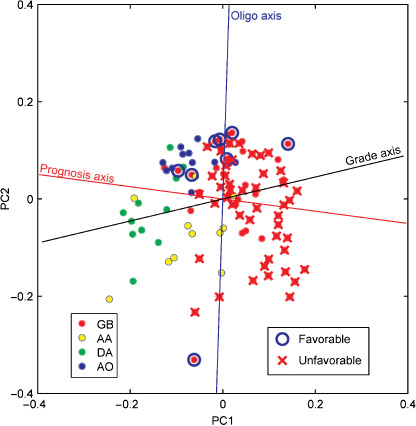
Principal component analysis based on the expression of 3225 genes in 110 gliomas in the training set. Circles indicate tumor samples with color representing histological classes. Glioblastoma (GB) samples with progression‐free survival of 2 years or longer (favorable) are circled in blue, and those with overall survival shorter than 2 years (unfavorable) are marked with a red ‘X’. AA, anaplastic astrocytoma; AO, anaplastic oligodendroglioma; DA, diffuse astrocytoma; PC1, first principal component; PC2, second principal component.
To further clarify the relationship between the gene expression profiles and the histology or prognosis of the tumors, we drew three axes (i.e. grade, oligo‐astrocytic, and prognosis axes) in the scatter diagram in the two‐dimensional principal component space (Fig. 1). The grade axis was determined by LDA, which discriminated grade 4 (GB) from grade 2 and 3 astrocytic tumors (DA and AA). The coordinate along the grade axis represented the correlation between each sample and its histological grade. The oligo axis was similarly determined by LDA, which discriminated between the oligodendroglial (AO) and astrocytic tumors (DA, AA, and GB). The prognosis axis was determined using multivariate Cox regression analysis. Because the direction of the prognosis axis was different from that of the grade axis, estimating the prognosis using gene expression patterns is likely to be better than estimations obtained using the histological grading.
We then constructed an outcome prediction model using a supervised method. Our prediction model was based on supervised PCA with the genes that were found to correlate with PFS using univariate Cox analysis. We evaluated the prediction model using a fivefold crossvalidation, in which the objective patients were left out of the supervised PCA process. We found that the best result was achieved when we used the 58 top‐ranked genes (Fig. 2). The 58‐gene model demonstrated a positive correlation between the PC1 score and PFS in the training set (Fig. 3a). When all of the training samples were divided into two groups based on the simple criterion that the coordinate on the PC1 score was positive or negative, a significant difference in PFS was observed between the two groups (Fig. 3b). We did not use any optimized thresholds either with the training or test sets. Even when the analysis was restricted to only the GB cases, PFS was significantly different between the two groups (Fig. 3c). Survival data for individual GB and non‐GB patients, aligned based on the PC1 score, are shown in Figure 4a,b.
Figure 2.

Significance of the prediction model as a function of the number of diagnostic genes. The vertical axis is the P‐value determined with the likelihood ratio test, whereas the horizontal axis is the number of top‐ranked genes used for the model, selected using univariate Cox analysis.
Figure 3.
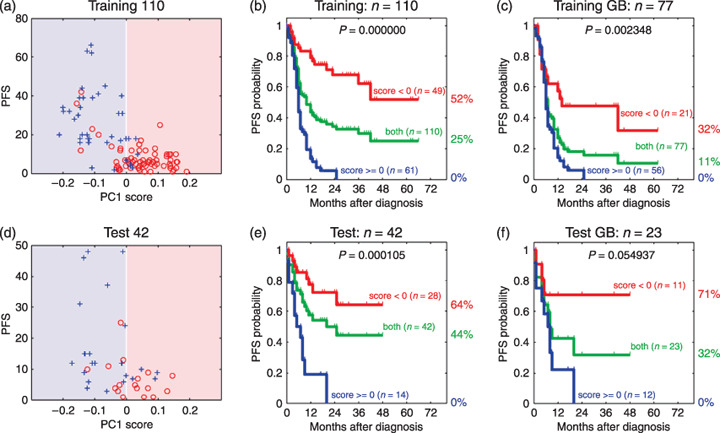
(a,d) Correlations between the first principal component (PC1) score and progression‐free survival (PFS) from (a) 110 gliomas in the training set, and from (d) 77 gliomas in the test set. Red circles and blue crosses denote the patients with tumor progression and the censored patients without tumor progression, respectively. (b,c,e,f) Kaplan–Meier estimates of PFS ratios: (b) 110 gliomas or (c) 77 glioblastomas (GB) in the training set; (e) 42 gliomas or (f) 23 GB in the test set.
Figure 4.

Graphical representation of survival data for all of the patients sorted by the first principle component score. Explanatory notes are boxed. (a) Glioblastoma (GB) patients in the training set. (b) Non‐GB patients in the training set. (c) Patients in the test set. AA, anaplastic astrocytoma; AO, anaplastic oligodendroglioma; DA, diffuse astrocytoma; MGMT, O6‐methyl guanine methyltransferase; PC1, first principle component.
We selected 58 genes (listed in Table 1) using all of the training data, and constructed a prognosis predictor based on the PC1 score. This model successfully classified patients in the test set into good‐prognosis and poor‐prognosis groups (Fig. 3d,e,f). Survival data for each patient are shown in Figure 4c.
Table 1.
List of the 58 genes
| No. | Coxβ | CoxP | GS number | Gene symbol | RefSeq ID | Description |
|---|---|---|---|---|---|---|
| 1 | 1.58897 | 5.99E‐14 | GS2482 | IGFBP2 | NM_000597 | Insulin‐like growth factor binding protein 2 |
| 2 | 1.65957 | 6.14E‐13 | GS3909 | VMP1 | NM_030938 | Hypothetical protein DKFZp566I133 |
| 3 | 1.99214 | 7.54E‐13 | GS10556 | MSN | NM_002444 | Moesin (MSN) |
| 4 | 1.22527 | 9.07E‐12 | GS4923 | TIMP1 | NM_003254 | Tissue inhibitor of metalloproteinase 1 |
| 5 | 1.78505 | 1.33E‐11 | GS1890 | LGALS1 | NM_002305 | Lectin, galactoside‐binding, soluble, 1 (galectin 1) |
| 6 | −1.39052 | 1.99E‐11 | GS12839 | HMP19 | NM_015980 | HMP19 protein (HMP19) |
| 7 | −1.32313 | 9.28E‐11 | GS6687 | CHGB | NM_001819 | Chromogranin B (secretogranin 1) |
| 8 | 2.61673 | 1.24E‐10 | GS3240 | CD63 | NM_001780 | CD63 antigen (melanoma 1 antigen) |
| 9 | 2.15797 | 2.30E‐10 | GS13698 | NES | NM_006617 | Nestin (NES) |
| 10 | 1.62126 | 3.08E‐10 | GS2782 | CLIC1 | NM_001288 | Chloride intracellular channel 1 |
| 11 | −0.953909 | 3.10E‐10 | GS14040 | INA | NM_032727 | Internexin neuronal intermediate filament protein |
| 12 | 1.23347 | 5.97E‐10 | − | TNC | NM_002160 | Tenascin C (hexabrachion) (TNC) |
| 13 | 1.48203 | 6.01E‐10 | GS4168 | TAGLN2 | NM_003564 | Transgelin 2 (TAGLN2) |
| 14 | −1.20606 | 7.09E‐10 | GS13019 | HES6 | NM_018645 | Hairy and enhancer of split 6 (Drosophila) |
| 15 | 1.03772 | 1.64E‐09 | − | VEGF | BC065522 | Vascular endothelial growth factor |
| 16 | 1.24957 | 1.86E‐09 | − | VIM | NM_003380 | Vimentin (VIM) |
| 17 | 1.82864 | 2.30E‐09 | GS475 | LDHA | NM_005566 | Lactate dehydrogenase A |
| 18 | 1.13676 | 2.47E‐09 | GS4232 | TNC | NM_002160 | Tenascin C (hexabrachion) |
| 19 | −1.18854 | 2.58E‐09 | GS13275 | RPIP8 | AB209802 | RaP2 interacting protein 8 variant protein |
| 20 | −1.0301 | 4.30E‐09 | GS12811 | SCG3 | NM_013243 | Secretogranin III |
| 21 | −1.05624 | 4.58E‐09 | GS14085 | GDAP1L1 | NM_024034 | Ganglioside‐induced differentiation‐associated protein 1‐like 1 |
| 22 | 1.48913 | 7.70E‐09 | GS1683 | IFITM3 | NM_021034 | Interferon induced transmembrane protein 3 (1‐8U) |
| 23 | 2.98416 | 7.79E‐09 | GS1949 | PPIB | NM_000942 | Peptidylprolyl isomerase B (cyclophilin B) |
| 24 | 2.53115 | 8.59E‐09 | GS421 | TMSB4X | NM_021109 | Thymosin, β4, X‐linked |
| 25 | −1.09751 | 9.31E‐09 | GS10002 | ALDOC | NM_005165 | Aldolase C, fructose‐bisphosphate |
| 26 | 2.36402 | 9.99E‐09 | GS3483 | ZYX | NM_001010972 | Zyxin (ZYX), transcript variant 2 |
| 27 | −1.00798 | 1.08E‐08 | GS13065 | ATP1A3 | NM_152296 | ATPase, Na+/K+ transporting, α3 polypeptide |
| 28 | −1.09385 | 1.15E‐08 | − | ABCC8 | NM_000352 | ATP‐binding cassette, sub‐family C |
| 29 | 0.982952 | 1.17E‐08 | GS6094 | IGFBP3 | NM_000598 | Insulin‐like growth factor binding protein 3, transcript variant 2 |
| 30 | −1.33159 | 1.18E‐08 | GS13989 | TUB | NM_003320 | Tubby homolog (mouse), transcript variant 1 |
| 31 | 1.2851 | 1.30E‐08 | GS208 | IFI30 | NM_006332 | Interferon, γ‐inducible protein 30 |
| 32 | 1.5316 | 1.35E‐08 | − | FLNA | NM_001456 | Filamin A, α (actin binding protein 280) |
| 33 | 1.02419 | 1.52E‐08 | − | UPAR | NM_001005376 | Plasminogen activator, urokinase receptor, transcript variant 2 |
| 34 | 1.50835 | 1.58E‐08 | GS13503 | UPP1 | NM_181597 | Uridine phosphorylase 1 (UPP1), transcript variant 2 |
| 35 | 1.71108 | 1.59E‐08 | GS12786 | LAMB2 | NM_002292 | Laminin, β2 (laminin S) |
| 36 | −0.989343 | 1.67E‐08 | GS13762 | KIAA0927 | AB023144 | KIAA0927 protein |
| 37 | 1.3664 | 1.68E‐08 | GS3760 | AEBP1 | NM_001129 | AE binding protein 1 |
| 38 | 1.74194 | 1.84E‐08 | GS2836 | EST | AJ420423 | Full‐length insert cDNA clone EUROIMAGE 1287006. |
| 39 | −1.00213 | 2.00E‐08 | GS14024 | RTN1 | NM_206857 | Reticulon 1, transcript variant 2 |
| 40 | 1.1111 | 3.23E‐08 | GS11665 | HMOX1 | NM_002133 | Heme oxygenase (decycling) 1 |
| 41 | 1.18646 | 3.34E‐08 | − | FN14 | NM_016639 | Tumor necrosis factor receptor superfamily, member 12A |
| 42 | −1.10155 | 3.71E‐08 | GS7227 | DKFZp434J212 | BC078676 | Kinesin family member 21B |
| 43 | 1.76858 | 4.94E‐08 | GS2958 | GM2A | NM_000405 | GM2 ganglioside activator |
| 44 | 1.34778 | 5.34E‐08 | GS242 | S100A10 | NM_002966 | S100 calcium binding protein A10 |
| 45 | −0.824638 | 5.66E‐08 | − | PDE8B | AB085826 | Phosphodiesterase 8B3 |
| 46 | −1.05329 | 5.78E‐08 | GS13667 | BRSK2 | NM_003957 | BR serine‐threonine kinase 2 |
| 47 | −0.956703 | 7.13E‐08 | GS4155 | SYN1 | M58378 | Synapsin I (SYN1) |
| 48 | 1.2386 | 7.13E‐08 | GS1071 | EST | BX647603 | cDNA DKFZp686L01105 |
| 49 | −0.923475 | 7.67E‐08 | GS12884 | CPLX2 | NM_001008220 | Complexin 2, transcript variant 2 |
| 50 | 1.50109 | 8.98E‐08 | GS1458 | MRCL3 | NM_006471 | Myosin regulatory light chain MRCL3 |
| 51 | 1.92343 | 9.65E‐08 | GS2257 | TMSB10 | NM_021103 | Thymosin, β10 |
| 52 | −0.930736 | 1.20E‐07 | GS13880 | JPH4 | NM_032452 | Junctophilin 4 |
| 53 | −1.11747 | 1.26E‐07 | GS14607 | FAIM2 | NM_012306 | Fas apoptotic inhibitory molecule 2 |
| 54 | −0.909196 | 1.39E‐07 | GS11781 | DKFZp761P2314 | AL834342 | cDNA DKFZp761P2314 |
| 55 | 1.23982 | 1.55E‐07 | GS6132 | PLEKHA4 | NM_020904 | Pleckstrin homology domain containing, family A member 4 |
| 56 | 2.37577 | 1.67E‐07 | GS4131 | GPX1 | NM_000581 | Glutathione peroxidase 1 transcript variant 1 |
| 57 | 1.15188 | 1.68E‐07 | GS2223 | SOD2 | NM_001024466 | Superoxide dismutase 2, mitochondrial, transcript variant 3 |
| 58 | 1.93896 | 1.80E‐07 | GS7306 | RHOC | NM_175744 | Homo sapiens ras homolog gene family, member C |
Coxβ, regression coefficient; CoxP, P‐value for univariate Cox analysis.
We examined the methylation status of the MGMT promoter in the GB patients. Among the 72 assessable cases (55 in the training set), the MGMT promoter was methylated in 40 of the cases (32 in the training set) (56%), and the methylation status was not obviously correlated with our prognosis predictor (Fisher's exact test P = 0.3).
We evaluated the 58‐gene profile with other prognostic factors. First, we carried out Cox analysis with the 58‐gene profile and tumor grade (GB vs others). In the univariate Cox analysis for PFS, we obtained P = 2.7e−15 and P = 1.0e−8 for the 58‐gene profile and tumor grade, respectively. Multivariate Cox analysis including the 58‐gene profile and tumor grade gave 1.0e−8 for the 58‐gene profile, and 0.84 for tumor grade. In the univariate Cox analysis for OS, we obtained 6.0e−15 and 4.7e−9, for the 58‐gene profile and tumor grade, respectively. Multivariate Cox analysis gave 2.4e−6 for the 58‐gene profile, and 0.03 for tumor grade. Thus, the 58‐gene profile is a strong prognostic factor independent of tumor grade.
We then carried out univariate and multivariate Cox regression analyses to evaluate the clinical parameters as potential predictors of PFS and OS among GB patients (Table 2). Univariate analysis revealed that the extent of resection, age, and the 58‐gene profile were significantly correlated with OS, whereas only the 58‐gene profile was significantly correlated with PFS. Multivariate analysis using the three factors extent of resection, 58‐gene profile, and age showed that the extent of resection (P = 0.0011) and the 58‐gene profile (P = 0.0012) were prognostic factors of similar strength (hazard ratio 3.1) for OS.
Table 2.
Univariate and multivariate analyses for overall survival (OS) and progression‐free survival (PFS) in glioblastoma patients
| Variable | No. patients | OS | PFS | ||
|---|---|---|---|---|---|
| Hazard ratio (95% CI) | P‐value | Hazard ratio (95% CI) | P‐value | ||
| Univariate analysis | |||||
| Age <50 years versus ≥50 years | 98 | 1.9 (1.1–3.6) | 0.025 | 1.2 (0.71–2.1) | 0.47 |
| Extent of resection † | 98 | 3.1 (1.5–6.7) | 0.00085 | 1.4 (0.79–2.5) | 0.23 |
| MGMT ‡ | 72 | 0.78 (0.43–1.40) | 0.43 | 0.67 (0.39–1.2) | 0.16 |
| 58 gene profile | 98 | 3.8 (1.8–.9) | 0.000051 | 3.0 (1.7–5.6) | 0.0001 |
| Multivariate analysis | |||||
| Age <50 years versus ≥50 years | 98 | 1.8 (0.93–3.40) | 0.078 | – | – |
| Extent of resection † | 98 | 3.1 (1.5–6.7) | 0.0011 | – | – |
| 58 gene profile | 98 | 3.1 (1.5–6.5) | 0.0012 | – | – |
Partial resection and biopsy versus complete resection.
‡ Methylated versus unmethylated O6‐methyl guanine methyltransferase (MGMT) promotor.
CI, confidence interval.
We checked the performance of our predictor using two publicly availably data sets: the MGH data set( 12 ) and the MDA data set.( 13 ) The correlation of the PC1 score to OS was evaluated with Cox regression tests, resulting in P‐values of 0.00051 and 0.0066 for the MDA and MGH data sets, respectively. Our predictor produced a stable performance without over‐fitting our data set. The results of Kaplan–Meier analysis are supplied as a supporting figure.
Among the 58 selected predictor genes, the expression of 37 genes was upregulated in the poor‐prognosis group. They included IGFBP2, VEGF, TNC, FN14, TIMP1, HMOX1, LGALS1, and UPAR, all of which are known to be involved in angiogenesis or tumor‐invasion processes. The remaining 21 genes showed upregulated expression levels in the good‐prognosis group. Six of these genes (INA, HES6, RTN1, BRSK2, SYN1, and CPLX2) have been implicated in neuron‐related functions (Table 1).
Discussion
Molecular‐based classification of high‐grade gliomas is expected to play an important role in predicting tumor prognosis, but it has been difficult to achieve practical applicability. Two gene expression profiling studies( 13 , 22 ) constructed molecular classification schemes that correlated with survival. However, due to the lack of a proper comparison with other major prognostic factors,( 23 ) the clinical utility of these schemes is unclear. In the present study, we enrolled patients mainly from a phase II clinical trial.( 5 ) The treatment and collection of clinical information was carried out under strict guidelines, including frequent follow up and centralized diagnosis of MRI films. Using gene expression data obtained from high‐throughput RT‐PCR, we constructed a prognosis predictor that is independent of the primary prognostic factors. This prognosis predictor, composed of a 58‐gene profile, was effective both for GB and non‐GB cases. The system was a better predictor of PFS than OS, probably because PFS more directly correlates with the biological properties of gliomas.
Although our predictor was mainly based on the cases from the KNOG study, the results with two external data sets support the universal performance of the predictor irrespective of chemotherapeutic regimen. Because survival benefit by chemotherapy was relatively small in most malignant gliomas,( 19 ) it is important to elucidate the differences in the intrinsic biological characters of the tumors.
Because the diagnostic genes were selected for correlation with prognosis, the prognostic predictor can be applied to any glioma, irrespective of histological grade. In our 52 non‐GB cases, seven patients showed early progression within 6 months. By means of our prediction scheme, six out of the seven cases were classified into the poor‐prognosis group, indicating good prognostic predictability for non‐GB cases as well as GB cases.
Feature extraction by PCA and other techniques uncovered various molecular properties of the gliomas. AO localized to a particular area of the two‐dimensional principal component space, indicating a distinct difference in the gene expression profiles of oligodendroglial and astrocytic tumors. The direction of the prognosis axis and the oligo axis indicated that different gene sets contributed to the differences in malignancy and histology. Differences in the directions of the prognosis and grade axes indicated that the pathological grading was not necessarily parallel to the refractoriness of the gliomas. Because the favorable GB cases were located closer to the AO cases, we speculate that deviation of the prognosis axis from the grade axis was due to the AO‐like gene expression signature. This also agrees with our previous study on AO and GB classification:( 4 ) 46 out of 168 diagnostic genes of the AO and GB classifier appeared among the 58 genes of the prognostic predictor. Those genes were simply selected by P‐value‐like scores for differential gene expression between AO and GB.
In our analyses, the expression levels of genes related to angiogenesis or invasion processes were higher in the poor‐prognosis group. The expression of these genes has been reported to correlate with the malignant characteristics of gliomas, and some of them may work cooperatively.( 24 , 25 , 26 , 27 , 28 , 29 , 30 , 31 , 32 , 33 ) Among the poor‐prognosis markers reported by Phillips et al.,( 13 ) VEGF, VIM, and NES were included in our predictors. Another study also indicated that angiogenic activity represented by coexpression of VEGF and IGFBP2 distinguished primary GB from secondary GB.( 26 ) These genes and their protein products could be potential therapeutic targets in patients from the poor‐prognosis group.
The good‐prognosis group was characterized by upregulation of the expression of neuron‐related genes. Phillips et al. also described a correlation between neuronal markers and the favorable subclasses.( 13 ) Likewise, other investigators have reported that a subset of neuronal genes was highly expressed in AO tumors with better prognoses.( 34 , 35 ) Taken together, these results indicate that the expression of neuron‐related genes is a marker of good prognoses in patients with high‐grade gliomas.
Among the 58 genes in the predictor model, IGFBP2 and VEGF also appeared in the 44‐gene classifier described by Freije et al.,( 22 ) whereas TIMP1 and SCG3 appeared in the 35‐gene signature developed by Phillips et al.( 13 ) Although most of the genes did not overlap, these three gene sets might have similar prognostic value, because distinct but equally predictive gene lists can be derived from the same data matrix.( 36 ) It should be noted, however, that the 35‐gene signature was strongly correlated with age (P < 0.005), making its clinical utility uncertain.
Hegi et al. recently demonstrated that epigenetic silencing of the MGMT gene serves as an independent prognostic parameter in GB patients treated with temozolomide.( 3 ) In our analysis, the methylation status of the MGMT promoter did not prove to be a significant prognostic factor. Kamiryo et al. found that MGMT methylation was a significant prognostic factor for both for OS and PFS in patients with grade III tumors, but not for grade IV tumors.( 37 ) Our result is consistent with this report, suggesting that the effect of MGMT on ACNU‐based treatment is likely to be smaller than that on temozolomide in GB patients.
Why is the extent of resection a significant prognostic factor for OS but not for PFS? Extent of resection has been reported as an independent prognostic factor to OS (e.g. Lacroix et al.( 38 )), but even a stringently designed study reported insignificance both for OS and PFS.( 39 ) We carefully evaluated individual patients and found that complete resection cases were more accessible to second surgery and survival after progression was extended. Due to careful follow up, tumor progression was detected earlier than usual, and the number of complete resection cases with second operation was increased. This explains the discrepancy between OS and PFS.
Another concern is whether performance of the predictor for OS would be improved if OS data were used for training. We examined this possibility, but found that performance for PFS was consistently better than that for OS, irrespective of the training data. This also suggests a tight link between PFS and gene expression. The details of the analysis will be described elsewhere.
In conclusion, our profiling results will help to construct a new classification scheme that assesses clinical malignancies better than the conventional histological classification system.
Supporting information
Fig. S1. Kaplan–Meier analysis of publicly available data sets. Online only.
Table S1. Gene expression data of the 3456 genes. Annotation information is also included. Online only.
Table S2. Clinical information about the patients in the training set. Online only.
Table S3. Clinical information about the patients in the test set. Online only.
Please note: Wiley‐Blackwell are not responsible for the content or functionality of any supporting materials supplied by the authors. Any queries (other than missing material) should be directed to the corresponding author for the article.
Supporting info item
Supporting info item
Supporting info item
Supporting info item
Acknowledgments
We would like to thank Dr H. Kita‐Matsuo for technical advice, and Mrs S. Maki‐Kinjo, Mrs K. Miyaoka‐Ikenaga and Mrs Y. Ishida for their valuable technical assistance. This work was supported by a Grant‐in‐Aid for the Development of Innovative Technology from the Ministry of Education, Culture, Sports, Science, and Technology of Japan.
References
- 1. Louis DN, Holland EC, Cairncross JG. Glioma classification: a molecular reappraisal. Am J Pathol 2001; 159: 779–86. [DOI] [PMC free article] [PubMed] [Google Scholar]
- 2. Cairncross JG, Ueki K, Zlatescu MC et al . Specific genetic predictors of chemotherapeutic response and survival in patients with anaplastic oligodendrogliomas. J Natl Cancer Inst 1998; 90: 1473–9. [DOI] [PubMed] [Google Scholar]
- 3. Hegi ME, Diserens AC, Gorlia T et al . MGMT gene silencing and benefit from temozolomide in glioblastoma. N Engl J Med 2005; 352: 997–1003. [DOI] [PubMed] [Google Scholar]
- 4. Shirahata M, Iwao‐Koizumi K, Saito S et al . A gene expression‐based molecular diagnostic system for malignant gliomas displays clinical utility, prognostic ability and reproducibility superior to histological diagnosis. Clin Cancer Res 2007; 13: 7341–56. [DOI] [PubMed] [Google Scholar]
- 5. Aoki T, Takahashi JA, Ueba T et al . Phase II study of nimustine, carboplatin, vincristine, and interferon‐β with radiotherapy for glioblastoma multiforme: experience of the Kyoto Neuro‐Oncology Group. J Neurosurg 2006; 105: 385–91. [DOI] [PubMed] [Google Scholar]
- 6. Kleihues P, Cavenee WK. World Health Organization Classification of Tumours: Pathology and Genetics: Tumours of the Nervous System. Lyon: IARC Press, 2000. [Google Scholar]
- 7. Matoba R, Kato K, Saito S et al . Gene expression in mouse cerebellum during its development. Gene 2000; 241: 125–31. [DOI] [PubMed] [Google Scholar]
- 8. Iwao‐Koizumi K, Matoba R, Ueno N et al . Prediction of docetaxel response in human breast cancer by gene expression profiling. J Clin Oncol 2005; 23: 422–31. [DOI] [PubMed] [Google Scholar]
- 9. Herman JG, Graff JR, Myohanen S, Nelkin BD, Baylin SB. Methylation‐specific PCR: a novel PCR assay for methylation status of CpG islands. Proc Natl Acad Sci USA 1996; 93: 9821–6. [DOI] [PMC free article] [PubMed] [Google Scholar]
- 10. Japan CoBTRo . Report of Brain Tumor Registry of Japan (1969–96). Neurologia Medico-Chirurgica 2003; 43 Suppl: 1–111. [PubMed] [Google Scholar]
- 11. Oba S, Sato MA, Takemasa I, Monden M, Matsubara K, Ishii S. A Bayesian missing value estimation method for gene expression profile data. Bioinformatics (Oxford, England) 2003; 19: 2088–96. [DOI] [PubMed] [Google Scholar]
- 12. Nutt CL, Mani DR, Betensky RA et al . Gene expression‐based classification of malignant gliomas correlates better with survival than histological classification. Cancer Res 2003; 63: 1602–7. [PubMed] [Google Scholar]
- 13. Phillips HS, Kharbanda S, Chen R et al . Molecular subclasses of high‐grade glioma predict prognosis, delineate a pattern of disease progression, and resemble stages in neurogenesis. Cancer Cell 2006; 9: 157–73. [DOI] [PubMed] [Google Scholar]
- 14. Alter O, Brown PO, Botstein D. Singular value decomposition for genome‐wide expression data processing and modeling. Proc Natl Acad Sci USA 2000; 97: 10 101–6. [DOI] [PMC free article] [PubMed] [Google Scholar]
- 15. Bair E, Tibshirani R. Semi‐supervised methods to predict patient survival from gene expression data. Plos Biol 2004; 2: E108. [DOI] [PMC free article] [PubMed] [Google Scholar]
- 16. Medical Research Council Brain Tumour Working Party . Randomized trial of procarbazine, lomustine, and vincristine in the adjuvant treatment of high‐grade astrocytoma: a Medical Research Council trial. J Clin Oncol 2001; 19: 509–18. [DOI] [PubMed] [Google Scholar]
- 17. Chang CH, Horton J, Schoenfeld D et al . Comparison of postoperative radiotherapy and combined postoperative radiotherapy and chemotherapy in the multidisciplinary management of malignant gliomas. A joint Radiation Therapy Oncology Group and Eastern Cooperative Oncology Group study. Cancer 1983; 52: 997–1007. [DOI] [PubMed] [Google Scholar]
- 18. Fine HA, Dear KB, Loeffler JS, Black PM, Canellos GP. Meta‐analysis of radiation therapy with and without adjuvant chemotherapy for malignant gliomas in adults. Cancer 1993; 71: 2585–97. [DOI] [PubMed] [Google Scholar]
- 19. Stewart LA. Chemotherapy in adult high‐grade glioma: a systematic review and meta‐analysis of individual patient data from 12 randomised trials. Lancet 2002; 359: 1011–18. [DOI] [PubMed] [Google Scholar]
- 20. Stupp R, Mason WP, Van Den Bent MJ et al . Radiotherapy plus concomitant and adjuvant temozolomide for glioblastoma. N Engl J Med 2005; 352: 987–96. [DOI] [PubMed] [Google Scholar]
- 21. Walker MD, Green SB, Byar DP et al . Randomized comparisons of radiotherapy and nitrosoureas for the treatment of malignant glioma after surgery. N Engl J Med 1980; 303: 1323–9. [DOI] [PubMed] [Google Scholar]
- 22. Freije WA, Castro‐Vargas FE, Fang Z et al . Gene expression profiling of gliomas strongly predicts survival. Cancer Res 2004; 64: 6503–10. [DOI] [PubMed] [Google Scholar]
- 23. Curran WJ Jr, Scott CB, Horton J et al . Recursive partitioning analysis of prognostic factors in three Radiation Therapy Oncology Group malignant glioma trials. J Natl Cancer Inst 1993; 85: 704–10. [DOI] [PubMed] [Google Scholar]
- 24. Bussolati B, Ahmed A, Pemberton H et al . Bifunctional role for VEGF‐induced heme oxygenase‐1 in vivo: induction of angiogenesis and inhibition of leukocytic infiltration. Blood 2004; 103: 761–6. [DOI] [PubMed] [Google Scholar]
- 25. Deryugina EI, Bourdon MA. Tenascin mediates human glioma cell migration and modulates cell migration on fibronectin. J Cell Sci 1996; 109 (Pt 3): 643–52. [DOI] [PubMed] [Google Scholar]
- 26. Godard S, Getz G, Delorenzi M et al . Classification of human astrocytic gliomas on the basis of gene expression: a correlated group of genes with angiogenic activity emerges as a strong predictor of subtypes. Cancer Res 2003; 63: 6613–25. [PubMed] [Google Scholar]
- 27. Gondi CS, Lakka SS, Yanamandra N et al . Expression of antisense uPAR and antisense uPA from a bicistronic adenoviral construct inhibits glioma cell invasion, tumor growth, and angiogenesis. Oncogene 2003; 22: 5967–75. [DOI] [PubMed] [Google Scholar]
- 28. Nishie A, Ono M, Shono T et al . Macrophage infiltration and heme oxygenase‐1 expression correlate with angiogenesis in human gliomas. Clin Cancer Res 1999; 5: 1107–13. [PubMed] [Google Scholar]
- 29. Plate KH, Breier G, Weich HA, Risau W. Vascular endothelial growth factor is a potential tumour angiogenesis factor in human gliomas in vivo . Nature 1992; 359: 845–8. [DOI] [PubMed] [Google Scholar]
- 30. Rorive S, Belot N, Decaestecker C et al . Galectin‐1 is highly expressed in human gliomas with relevance for modulation of invasion of tumor astrocytes into the brain parenchyma. Glia 2001; 33: 241–55. [DOI] [PubMed] [Google Scholar]
- 31. Song SW, Fuller GN, Khan A et al . IIp45, an insulin‐like growth factor binding protein 2 (IGFBP‐2) binding protein, antagonizes IGFBP‐2 stimulation of glioma cell invasion. Proc Natl Acad Sci USA 2003; 100: 13 970–5. [DOI] [PMC free article] [PubMed] [Google Scholar]
- 32. Tran NL, McDonough WS, Savitch BA et al . Increased fibroblast growth factor‐inducible 14 expression levels promote glioma cell invasion via rac1 and nuclear factor‐κB and correlate with poor patient outcome. Cancer Res 2006; 66: 9535–42. [DOI] [PubMed] [Google Scholar]
- 33. Wang H, Wang H, Shen W et al . Insulin‐like growth factor binding protein 2 enhances glioblastoma invasion by activating invasion‐enhancing genes. Cancer Res 2003; 63: 4315–21. [PubMed] [Google Scholar]
- 34. Mukasa A, Ueki K, Ge X et al . Selective expression of a subset of neuronal genes in oligodendroglioma with chromosome 1p loss. Brain Pathol (Zurich, Switzerland) 2004; 14: 34–42. [DOI] [PMC free article] [PubMed] [Google Scholar]
- 35. Mukasa A, Ueki K, Matsumoto S et al . Distinction in gene expression profiles of oligodendrogliomas with and without allelic loss of 1p. Oncogene 2002; 21: 3961–8. [DOI] [PubMed] [Google Scholar]
- 36. Ein‐Dor L, Kela I, Getz G, Givol D, Domany E. Outcome signature genes in breast cancer: is there a unique set? Bioinformatics (Oxford, England) 2005; 21: 171–8. [DOI] [PubMed] [Google Scholar]
- 37. Kamiryo T, Tada K, Shiraishi S, Shinojima N, Kochi M, Ushio Y. Correlation between promoter hypermethylation of the O6‐methylguanine‐deoxyribonucleic acid methyltransferase gene and prognosis in patients with high‐grade astrocytic tumors treated with surgery, radiotherapy, and 1‐(4‐amino‐2‐methyl‐5‐pyrimidinyl) methyl‐3‐(2‐chloroethyl)‐3‐nitrosourea‐based chemotherapy. Neurosurgery 2004; 54: 349–57. [DOI] [PubMed] [Google Scholar]
- 38. Lacroix M, Abi‐Said D, Fourney DR et al . A multivariate analysis of 416 patients with glioblastoma multiforme: prognosis, extent of resection, and survival. J Neurosurgery 2001; 95: 190–8. [DOI] [PubMed] [Google Scholar]
- 39. Athanassiou H, Synodinou M, Maragoudakis E et al . Randomized phase II study of temozolomide and radiotherapy compared with radiotherapy alone in newly diagnosed glioblastoma multiforme. J Clin Oncol 2005; 23: 2372–7. [DOI] [PubMed] [Google Scholar]
Associated Data
This section collects any data citations, data availability statements, or supplementary materials included in this article.
Supplementary Materials
Fig. S1. Kaplan–Meier analysis of publicly available data sets. Online only.
Table S1. Gene expression data of the 3456 genes. Annotation information is also included. Online only.
Table S2. Clinical information about the patients in the training set. Online only.
Table S3. Clinical information about the patients in the test set. Online only.
Please note: Wiley‐Blackwell are not responsible for the content or functionality of any supporting materials supplied by the authors. Any queries (other than missing material) should be directed to the corresponding author for the article.
Supporting info item
Supporting info item
Supporting info item
Supporting info item