

Abstract
Constitutive activation of Notch signaling is required for the proliferation of a subgroup of human T‐cell acute lymphoblastic leukemias (T‐ALL). Previous in vitro studies have demonstrated the therapeutic potential of Notch signaling inhibitors for treating T‐ALL. To further examine this possibility, we applied a γ‐secretase inhibitor (GSI) to T‐ALL xenograft models. Treatment of established subcutaneous tumors with GSI resulted in partial or complete regression of tumors arising from four T‐ALL cell lines that were also sensitive to GSI in vitro. To elucidate the mechanism of action, we transduced DND‐41 cells with the active form of Notch1 (aN1), which conferred resistance to in vitro GSI treatment. Nevertheless, in vivo treatment with GSI induced a partial but significant regression of subcutaneous tumors that developed from aN1‐transduced DND‐41 cells, whereas it induced complete regression of tumors that developed from mock‐transduced DND‐41 cells. These findings indicate that the remarkable efficacy of GSI might be attributable to dual mechanisms, directly via apoptosis of DND‐41 cells through the inhibition of cell‐autonomous Notch signaling, and indirectly via disturbance of tumor angiogenesis through the inhibition of non‐cell‐autonomous Notch signaling. (Cancer Sci 2009; 100: 2444–2450)
The Notch signaling pathway has a crucial role in a variety of cellular functions, including cell proliferation, differentiation, and apoptosis.( 1 , 2 ) Notch proteins are heterodimeric transmembrane receptors composed of an extracellular subunit and a transmembrane subunit, and associate with each other via heterodimerization (HD) domains in the extracellular regions. Notch signaling, initiated by receptor‐ligand interactions, requires subsequent proteolytic cleavage of the receptor by several proteases, resulting in liberation of the cleaved form of Notch1 that is functionally active (hereafter referred to as aN1) as it translocates into the nucleus and up‐regulates the transcription of Notch‐RBP‐Jκ‐regulated genes.( 3 )
Recent studies in tumorigenesis of hematologic malignancies and solid tumors have revealed several examples of aberrant Notch signaling.( 2 , 4 , 5 ) Forced expression of aN1 in mouse bone marrow results in the development of T‐cell leukemia,( 6 ) and more importantly, amplified Notch signaling contributes to approximately 50% of human T‐cell acute lymphoblastic leukemia (T‐ALL).( 7 , 8 ) The Notch signal amplification in T‐ALL is due to gain‐of‐function mutations in the NOTCH1 gene, which have also been detected in many different murine T‐ALL models.( 9 , 10 , 11 , 12 ) NOTCH1 activating mutations cluster at the HD and intracellular domains, leading to ligand‐independent cleavage and activation of Notch1, and increased stability of aN1, respectively. Notch1 signaling, whether initiated by receptor–ligand interactions or triggered by NOTCH1‐activating mutations in the HD domains, eventually depends on the proteolytic activity of γ‐secretase. γ‐Secretase inhibitors (GSIs), available as small molecular compounds, suppress Notch signaling by blocking the activity of the γ‐secretase complex.( 13 ) Previous studies have demonstrated that blockade of Notch signaling with GSI induces cell cycle arrest and apoptosis in a subset of human T‐ALL cell lines,( 7 , 14 , 15 ) and an early phase clinical trial has already been conducted.( 16 ) Despite that, precise mechanisms of action of GSI on T‐ALL in vivo are yet to be elucidated.
Here, to examine the potential clinical applications for GSIs in T‐ALL patients, and to evaluate the mechanisms of GSI action, we investigated the effects of the GSI compound YO01027( 17 ) (referred to hereafter as YO) on human T‐ALL growth in murine xenograft models, because YO administration to mice induced defective melanocyte stem cell maintenance but kept the mice otherwise healthy as shown in our previous paper.( 18 ) The results here indicated that YO is highly effective against T‐ALL growth in vivo and demonstrated that the efficacy of GSI might be due to the inhibition of Notch signaling via two mechanisms.
Materials and Methods
Cell cultures and reagents Human T‐ALL cell lines (ALL‐SIL, DND‐41, HPB‐ALL, KOPT‐K1, TALL‐1, MOLT‐4, PF‐382, and CEM) were obtained from the Fujisaki Cell Center, Hayashibara Biochemical Laboratories (Okayama, Japan), maintained in RPMI supplemented with 10% fetal bovine serum and penicillin/streptomycin, and incubated at 37°C with 5% CO2. Human umbilical vein endothelial cells (HUVEC; Lonza Walkersville, Walkersville, MD, USA) were cultured in Endothelial Basal Medium‐2 (Lonza Walkersville) and SingleQuots (Lonza Walkersville). The YO, which is an LY‐411,575 analogue, was synthesized as described previously.( 17 ) YO was dissolved in dimethyl sulfoxide (DMSO) to create 10 mM or 50 mM stock solutions.
Animals SCID mice (C.B‐17/Icr‐scid/scidJcl; 6 weeks old, female) were purchased from CLEA Japan (Tokyo, Japan) and maintained under specific pathogen‐free conditions. All experimental procedures were performed in accordance with the guidelines for animal experiments of the University of Tokyo and Jichi Medical University.
Xenograft mouse model SCID mice at 6–8 weeks of age were inoculated subcutaneously in the right flank with 3 × 10⁷ cells in 300 μL of phosphate buffered saline. In concurrent administration experiments, the mice were assigned to a control group and a YO‐treated group the day after tumor inoculation. YO was orally administered daily for at least 30 days at a dose of 0.1 or 1 mg/kg/day. In challenge experiments for established tumors, mice were similarly assigned as described above at approximately 2.5–3 weeks (in HPB‐ALL and TALL‐1) or 8–12 weeks (in ALL‐SIL and DND‐41) after tumor cell inoculation, when tumor size had reached a certain volume. YO was orally administered daily at a dose of 0.1, 1, or 10 mg/kg/day. Tumor size was measured at the greatest length and width. The volume was calculated as 1/2 × (tumor length) × (tumor width)2.
In vivo administration of YO In vivo administration of YO was performed as described previously.( 19 ) Briefly, 0.1–10 mg/kg of YO or an equal volume of vehicle (DMSO) in 300 μL of 0.5% methylcellulose (Wako, Osaka, Japan) was administered orally to SCID mice using a disposable oral zonde (Fuchigami, Kyoto, Japan) once a day for the indicated periods.
Plasmid construction and retroviral transduction The cDNA for myc‐tagged murine aN1( 20 ) was subcloned into the BamHI restriction site of the retrovirus vector pMYs/internal ribosomal entry site‐enhanced green fluorescent protein (IRES‐EGFP; pMYs/IG).( 21 ) Retroviral transduction of a human T‐ALL cell line, DND‐41, was performed using PLAT‐F cells as described previously.( 21 ) Following transduction, GFP‐positive cells were sorted to 90% purity and used for further analysis. The proteins were detected by Western blotting using an anti‐myc antibody (9E10).
Proliferation assay Cell growth was quantified using a WST‐1‐based assay (Cell Counting Kit‐8; Dojindo Medical Technologies, Kumamoto, Japan), which is a highly sensitive colorimetric assay. Briefly, human T‐ALL cell lines (3 × 10⁴ cells/well) or HUVEC (4 × 10³ cells/well) were seeded into 96‐well plates. Vascular endothelial growth factor (VEGF; 100 ng/mL) was supplemented in the medium for HUVEC. Various concentrations of YO were added, and proliferation was measured in duplicate at 7 days or 11 days using a WST‐1‐based assay according to the manufacturer’s instructions. Proliferation was expressed as a percentage or fold change of vehicle‐treated controls. Results are expressed as mean value ± SD.
Detection of apoptosis Cells were incubated with various concentrations of YO for the indicated periods. Apoptosis was assessed using a fluorescein isothiocyanate‐labeled Annexin V staining kit (Immunotech; Beckman‐Coulter, Prague, Czech Republic) combined with 7‐amino‐actinomycin D (7‐AAD), according to the manufacturer’s instructions, with a FACS Calibur cytometer (BD Biosciences, San Jose, CA, USA).
TUNEL staining To detect apoptotic cells, ALL‐SIL‐bearing SCID mice were sacrificed after the treatment with 1 mg/kg YO or vehicle for 5 days. Frozen blocks of tumors were cryosectioned and fixed with 1% paraformaldehyde, followed by analysis for apoptosis using the ApopTag Plus Peroxidase In Situ Apoptosis Detection Kit (Millipore, Billerica, MA, USA) according to the manufacturer’s instructions.
Western blotting Western blotting was performed as described previously.( 22 ) The probes used were antibodies against cleaved Notch1 (Val1744; Cell Signaling Technology, Danvers, MA, USA) and GAPDH as a control. The Val1744 antibody was incubated at a dilution of 1:1000 overnight.
Tube formation assay Upon the BD BioCoat Angiogenesis Plate (96 well), 2 × 10⁴ HUVEC were seeded per well, with or without 100 nM YO. After 18 h, cells were stained with fluorescent dye, Calcein AM (BD Biosciences), according to the manufacturer’s instructions. Images were captured with the BIOREVO BZ‐9000 microscope (Keyence, Osaka, Japan), and the tube length was measured using the BZ‐H1C image analysis application (Keyence).
Histological analysis Frozen blocks were cryosectioned at 5 μm and mounted on slides. Histological sections were air‐dried and fixed in acetone for 15 min, followed by immunostaining with a 1:200 dilution of antimouse CD31 antibody (clone; MEC13.3) (BD‐Pharmingen, San Diego, CA, USA) overnight at 4°C. Horseradish peroxide with the coloring agent diaminobenzidine was used as the substrate. Sections were then counterstained with hematoxylin. Vessel counting was performed at ×40 magnification in several randomly chosen areas.
Statistics Statistical analyses were performed using the Student’s t‐test. A P‐value of <0.05 was considered statistically significant.
Results
Human T‐ALL lines are susceptible to Notch inhibition Some human T‐ALL cell lines with NOTCH1 activating mutations are sensitive to GSI in vitro.( 7 , 13 , 14 , 15 ) We examined the ability of YO, a GSI compound that has not been tested in cell‐based experiments, to inhibit Notch signaling. Various human T‐ALL cell lines (ALL‐SIL, KOPT‐K1, DND‐41, and HPB‐ALL) were treated with YO for 48 h followed by immunoblotting with cleaved Notch1 (Val1744) antibody, which can specifically detect the aN1 proteins. Treatment of these cell lines with 100 nM YO resulted in an almost complete block of Notch1 activity (Fig. 1a).
Figure 1.
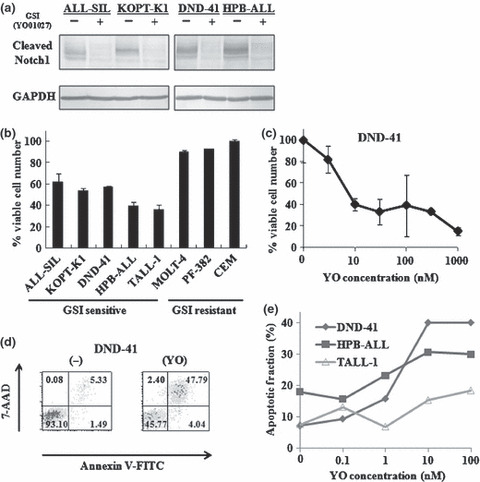
Inhibition of Notch signaling impairs growth of human T‐cell acute lymphoblastic leukemias (T‐ALL) cell lines. (a) Western blot analysis for cleaved Notch1 in human T‐ALL cell lines treated with 100 nM YO01027 for 48 h. GAPDH is shown as a loading control. (b) Proliferation assay of a panel of human T‐ALL cell lines treated for 7 days with 100 nM YO01027 or vehicle control. The percent of viable cell number indicates the proportion of viable cells in the treated populations relative to untreated populations. (c) Dose dependent effects of YO01027 on the proliferation of DND‐41 cell line treated for 7 days with 3, 10, 30, 100, 300, 1000 nM YO01027 or vehicle control. The percent of viable cell number indicates the proportion of viable cells in the treated populations relative to untreated populations. (d) Annexin V assay of DND‐41 cell line treated for 7 days with 10 nM YO01027 or vehicle control. (e) Dose dependent effects of YO01027 on the apoptosis of human T‐ALL cell lines treated for 7 days with 0.1, 1, 10, 100 nM YO01027 or vehicle control. The apoptotic fraction denotes the fraction of Annexin V (+)/7‐AAD (+) cells, and the percent of apoptotic fraction indicates the proportion of apoptotic cells among the total cells within each treated well.
To investigate the anti‐proliferative effect of YO on T‐ALL cells, we measured cellular viability using the WST‐1‐based assay in human T‐ALL cell lines after YO treatment. As expected, YO exerted an anti‐proliferative effect on some T‐ALL cell lines (ALL‐SIL, KOPT‐K1, HPB‐ALL, DND‐41, and TALL‐1), whereas other cell lines (MOLT‐4, PF‐382, and CEM) were not sensitive to this compound (Fig. 1b). To examine concentration dependency, DND‐41 was treated with various concentrations of YO for 7 days and applied to the WST‐1‐based assay. A steep concentration dependency was observed between 1 nM and 10 nM. The effect was virtually saturated at >10 nM (Fig. 1c).
Next, we explored whether the decreased proliferation of T‐ALL cell lines after treatment with YO was due to the induction of cell cycle arrest and/or apoptosis. We analyzed the cell cycle of the T‐ALL cell lines after YO treatment using flow cytometry. As expected from previous reports,( 7 , 13 , 14 , 15 ) YO induced G0‐G1 arrest in all the T‐ALL cell lines sensitive to YO (data not shown). Then, we treated five T‐ALL cell lines with YO for 7 days followed by Annexin V/7‐AAD staining, and found that YO induced significant apoptosis of DND‐41 cells (Fig. 1d), as well as the other T‐ALL cell lines tested (Fig. 1e). Similar results were observed using a pharmacologically distinct GSI, DAPT, known to block Notch activation (data not shown). Taken together, these results confirmed that some human T‐ALL cell lines are susceptible to YO treatment in vitro.
Concurrent administration of YO with tumor inoculation results in the inhibition of tumor growth in T‐ALL xenograft models To examine in vivo antitumor effects of YO, we used murine xenograft models, in which SCID mice were inoculated subcutaneously with human cell lines. HPB‐ALL and TALL‐1 cell lines established subcutaneous tumors 2.5–3 weeks after inoculation. The subcutaneous tumors of the YO‐treated groups were significantly smaller than those of control groups 2.5–4 weeks after the inoculation and the initiation of concurrent administration of YO or vehicle. Notably, in mice treated with 1 mg/kg of YO, there was no tumor formation observed in any of the TALL‐1‐inoculated mice or in approximately half the HPB‐ALL‐inoculated mice (Fig. 2a,b). This result indicates that YO exerts in vivo antitumor effects on T‐ALL, at least during the period of tumor engraftment.
Figure 2.
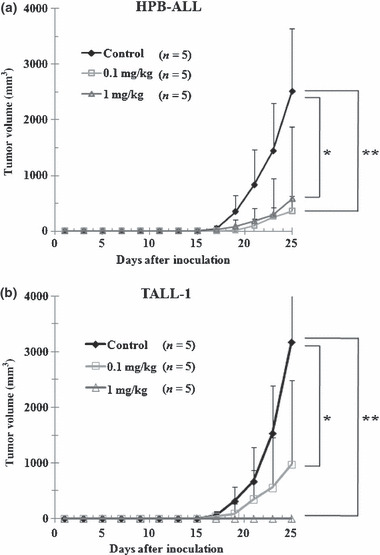
Antitumor effects of YO01027 (YO) on xenograft models of human T‐cell acute lymphoblastic leukemias (T‐ALL), with concurrent administration of YO with tumor inoculation. Mice were inoculated subcutaneously with HPB‐ALL (a) or TALL‐1 cell lines (b). The next day, mice were randomly assigned to receive vehicle alone or varying doses of YO01027 daily, as described in “Materials and Methods”. Data represent the mean tumor volume (mm3) ±SD grown in vehicle‐treated mice, YO (0.1 mg/kg)‐treated mice, or YO (1 mg/kg)‐treated mice. *P < 0.05; **P < 0.01, statistically significant differences (vehicle vs YO).
YO treatment against established tumors in T‐ALL xenograft models results in partial or complete regression Next, we evaluated the effects of YO treatment when the tumors grew to visible sizes. In this experimental design, YO treatment resulted in partial (HPB‐ALL) or complete (ALL‐SIL, DND‐41, and TALL‐1) regression of the established subcutaneous tumors. When treated with 10 mg/kg/day YO, the growth of tumors derived from HPB‐ALL was suppressed to <50% compared with growth without treatment. Tumors derived from ALL‐SIL, DND‐41, and TALL‐1 completely regressed within 2–3 weeks following treatment with YO at 1 mg/kg/day (Fig. 3a).
Figure 3.
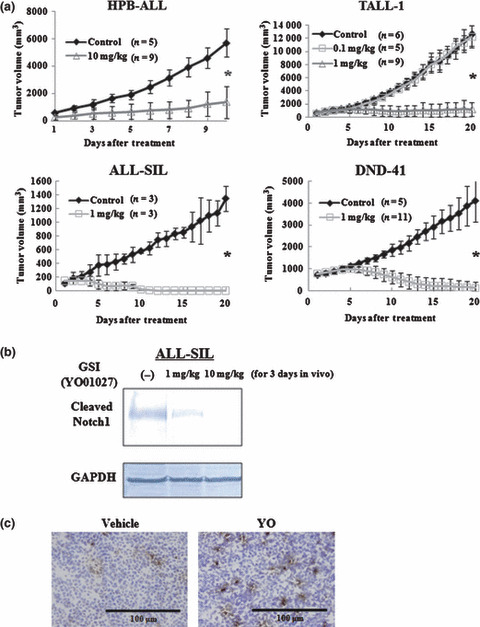
Antitumor effects of YO01027 (YO) on xenograft models of human T‐cell acute lymphoblastic leukemias (T‐ALL), with YO treatment after tumor establishment. (a) Mice were inoculated subcutaneously with HPB‐ALL, TALL‐1, DND‐41, or ALL‐SIL cell lines. When the diameter of the tumor reached 12–13 mm, mice were randomly assigned to receive vehicle alone or varying doses of YO01027 daily, as described in the “Materials and Methods”. Data represent the mean tumor volume (mm3) ±SD grown in vehicle‐treated mice or YO (0.1 or 1 or 10 mg/kg)‐treated mice. *P < 0.001, statistically significant differences (vehicle vs YO). (b) Western blot analysis for cleaved Notch1 in engrafted tumors treated with YO. ALL‐SIL‐challenged mice were treated daily with vehicle alone or YO, and tumors were harvested 72 h after the initiation of treatment, followed by Western blotting of tumor lysates with cleaved Notch1 (Val1744) antibody. GAPDH is shown as a loading control. (c) YO treatment induces apoptosis of ALL‐SIL cells in vivo. ALL‐SIL‐bearing mice were treated daily with vehicle alone or YO01027 at a dose of 1 mg/kg, and tumors were harvested 5 days after the initiation of treatment. Tumor sections were fixed with 1% paraformaldehyde and apoptotic cells were stained using TUNEL assay.
To confirm the in vivo pharmacologic inhibition of Notch signaling by YO, we excised tumors made of ALL‐SIL from mice with or without 1 or 10 mg/kg/day YO treatment for 3 days, followed by immunoblotting of the tumor lysates with the Val1744 antibody. The level of cleaved Notch1 was reduced partially or almost completely after 1 or 10 mg/kg/day YO treatment, respectively. Thus, YO administered at both 1 mg/kg/day and 10 mg/kg/day to SCID mice was pharmacologically active, and blocked Notch1 signaling partially or almost completely, at least in cells of subcutaneous tumors (Fig. 3b).
To determine whether YO treatment induces apoptosis in vivo, we performed TUNEL staining on tumors made of ALL‐SIL, which was isolated from vehicle‐ or YO‐treated mice. TUNEL‐positive cells were reproducibly increased in number by the YO treatment (Fig. 3c), demonstrating increased apoptosis of T‐ALL cells in vivo.
Effect of aN1 expression in tumor growth during YO treatment We next expressed aN1 exogenously in DND‐41 cell lines to examine whether aN1 rescues YO‐induced cell growth arrest and tumor regression. aN1 represents a protein that is already cleaved, and is thus not a substrate for γ‐secretase. Therefore, it was expected that DND‐41 cells transduced with aN1 (hereafter referred to as DND‐41/aN1) would become resistant to YO treatment.
We established DND‐41/aN1 cells by infection of parental DNA‐41 cells with aN1‐expressing retrovirus, followed by bulk sorting of GFP‐positive cells. Expression of aN1 proteins was confirmed by Western blotting with an anti‐myc antibody (Fig. 4a). Parental DND‐41 and mock‐infected DND‐41 (DND‐41/mock) were sensitive to YO, but, as expected, DND‐41/aN1 was substantially resistant to YO in vitro when assessed by a cell proliferation assay (Fig. 4b). The continuous presence of 100 nM YO allowed for selection of cells highly resistant to YO (DND‐41/aN1/GSI; Fig. 4b). The in vitro growth curves of these cells under basal conditions (without YO) were very similar to each other (data not shown).
Figure 4.
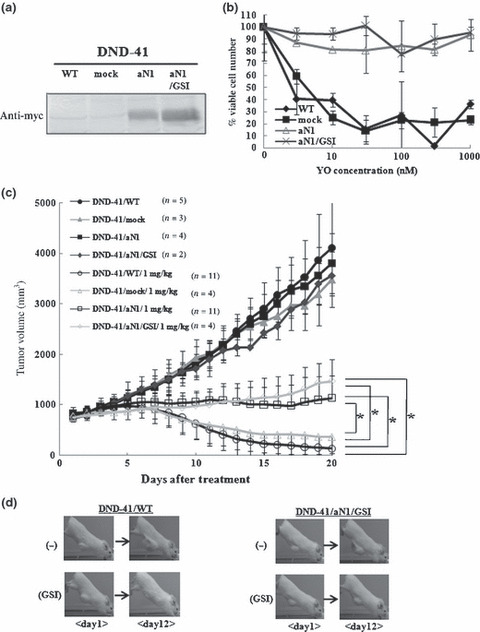
Establishment of DND‐41/aN1 and effects of aN1 rescue on tumor growth during YO01027 (YO) treatment. (a) Expression of aN1 proteins tagged with myc in DND‐41/aN1 cells and DND‐41/aN1/GSI cells was confirmed by Western blotting analysis. (b) Proliferation assay of established DND‐41/aN1 and DND‐41/aN1/GSI cell lines, compared with DND‐41/WT and DND‐41/mock cell lines, after treatment for 11 days with varying doses of YO. The percent of viable cell number indicates the proportion of viable cells in the treated populations relative to untreated populations. (c) Antitumor effects of YO on xenograft models of DND‐41/WT, DND‐41/mock, DND‐41/aN1, and DND‐41/aN1/GSI (pre‐selected by γ‐secretase inhibitor [GSI] in vitro). “1 mg/kg/day” denotes the group that received the YO treatment at a dose of 1 mg/kg/day. Data represent the mean tumor volume (mm3) ±SD of vehicle‐treated mice or YO (1 mg/kg)‐treated mice. *P < 0.01, statistically significant differences. (d) Representative appearance of subcutaneous xenograft models during YO treatment. DND‐41 cells stably expressing control vector or aN1 (pre‐selected by GSI in vitro) were grown as xenografts in SCID mice. Representative mice from each group are shown.
We implanted parental DND‐41, DND‐41/mock, DND‐41/aN1, and DND‐41/aN1/GSI cells subcutaneously into SCID mice. Subcutaneous tumors began to be palpable and the tumor volume reached 700 mm3 in 8–12 weeks. Treatment with YO at 1 mg/kg/day or control vehicle was then initiated. In vehicle‐treated mice, the tumors derived from parental DND‐41, DND‐41/mock, DND‐41/aN1, and DND‐41/aN1/GSI cells grew in a similar manner, whereas YO treatment resulted in a substantial regression of the tumors derived from parental DND‐41 and DND‐41/mock cells (Fig. 4c,d). Interestingly, in vivo YO treatment of tumors derived from DND‐41/aN1 and DND‐41/aN1/GSI cells, which were resistant to YO in vitro, induced significantly slower cell growth compared with the vehicle treatment, suggesting that these cells were sensitive to YO to some degree in vivo (Fig. 4c,d). In some mice, we observed a stabilization of the tumor volume. Nevertheless, YO treatment was not sufficiently effective on DND‐41/aN1 and DND‐41/aN1/GSI to regress the tumors to an impalpable level, unlike parental DND‐41‐ and DND‐41/mock‐derived tumors.
Effect of YO on in vitro tube formation and in vivo tumor vessels Recent studies have demonstrated that inhibition of Notch signaling in solid tumors resulted in tumor regression via increased tumor vessels with poor perfusion.( 23 , 24 , 25 , 26 ) It has been shown that Notch inhibition leads to promotion of non‐functioning angiogenesis.
Tube formation assay was performed to investigate the effect of YO on in vitro angiogenesis using HUVEC. We found that YO treatment significantly increased the tube length in the tube formation assay (Fig. 5a,b), suggesting that Notch inhibition promoted proliferation of endothelial cells, which is consistent with previous studies.( 24 , 27 ) In addition, cell proliferation in the presence of VEGF was measured with WST‐1‐based assay. YO significantly promoted proliferation of HUVEC (Fig. 5c) as previously reported.( 24 , 27 )
Figure 5.
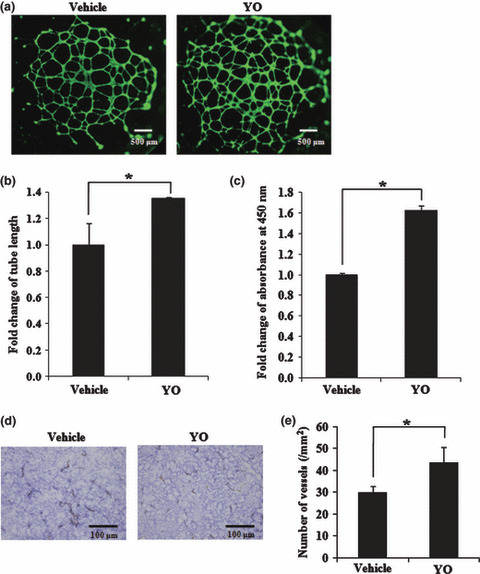
In vitro and in vivoanalysis of vascular cells after YO01027 (YO) treatment. (a) The in vitro tube formation analysis of HUVEC, either with or without 100 nM YO treatment. The cells were stained with fluorescent dye, Calcein AM, and the representative images are shown. Original magnification, ×20. (b) Quantitative analysis of tube length after tube formation of HUVEC with or without 100 nM YO. Fold change of tube length is shown, compared with that of vehicle control. *P < 0.05, statistically significant differences. (c) The cell proliferation assay of HUVEC in the presence of vascular endothelial growth factor (VEGF), either with or without 100 nM YO for 7 days. Fold change of absorbance at 450 nm is shown, compared with that of the vehicle control. *P < 0.05, statistically significant differences. (d) Anti‐CD31 immunostainings of tumor sections in DND‐41‐bearing SCID mice, either after YO treatment at a dose of 1 mg/kg/day or after vehicle treatment. Original magnification, ×40. (e) Quantitative analysis of vessels in tumors after YO treatment. The cells stained with anti‐CD31 were counted, and data represent the mean vessel density (per mm2) ±SD in tumors derived from DND‐41. *P < 0.05, statistically significant differences.
To further clarify the mechanism of action with YO treatment, we analyzed the tumor vasculature during YO treatment. We implanted DND‐41 cells into SCID mice and started YO or vehicle treatment after the tumor diameter reached approximately 1 cm. We sacrificed mice at treatment day 5, and analyzed tumor sections by immunostaining for anti‐CD31, which is able to identify the vessels in tumors. In the average, approximately 30 and >40 vessels per mm2 were observed in the vehicle‐treated and YO‐treated mice, respectively (Fig. 5d,e). These results are consistent with the previous reports described above, in which tumor regression would result from increased but poorly functional tumor vessels. Collectively, tumor regression in our models may depend partially on the disrupted tumor vasculature with paradoxically increased tumor vessels presumably through the inhibition of non‐cell‐autonomous Notch signaling by YO.
Discussion
The findings of the present study confirmed that the YO compound that we synthesized is a GSI that efficiently blocks Notch signaling in T‐ALL cell lines carrying activating NOTCH1 mutations and induces apoptosis of these cell lines in vitro. The cell‐autonomous effect against Notch signaling described here is postulated to be the mechanism of anti‐T‐ALL, creating the bases for clinical studies of a GSI targeting T‐ALL.
We demonstrated a marked in vivo effect of YO in a xenograft model that was more dramatic than we had expected. Although the mechanisms of YO action on T‐ALL have been virtually confined to the cell‐autonomous Notch signal inhibition, including a recent report describing the combinatorial effect of steroid with GSI,( 28 ) the strong effect of GSI in vivo could also be attributed to non‐cell‐autonomous inhibition of Notch signaling.
Our findings were consistent with the recent reports on the role of Notch signaling in tumor angiogenesis.( 23 , 24 , 25 , 26 ) Delta‐4, one of the Notch ligands, is expressed on tip cells in the endothelium of newly elongating tumor vessels by stimulation with VEGF. Engagement of Notch1 expressed on the stalk cells in the endothelium by neighboring tip cell‐expressing Delta‐4 blocks differentiation of the stalk cells into tip cells, which represents the process required for the normally functioning tumor vessel formation. Blockade of this signaling pathway impairs normal tumor angiogenesis and creates hyper‐blanched, non‐functioning vasculature, which results in regression of the solid tumor. Whereas we used T‐ALL cell lines in our experiments, we chose the subcutaneous tumor injection model because it is more convenient for observing and measuring the tumors. In this subcutaneous tumor model, we observed a similar tendency regarding tumor vessel density, from which we could easily speculate that the same mechanism was underlying this phenomenon.
The introduction of the GSI‐insensitive cleaved form of Notch1 into DND‐41 cells transformed these cells to be completely resistant to YO in vitro, exactly as expected, but failed to confer complete resistance to YO in the subcutaneous xenograft model. Whereas the subcutaneous tumors derived from DND‐41/aN1 were significantly more resistant to YO than tumors derived from parental DND‐41 and DND‐41/mock cells, they still significantly responded to YO. These observations fit the idea that the marked in vivo antitumor effect of YO against subcutaneous tumors derived from parental DND‐41 as well as DND‐41/mock cells was mediated through, in addition to the cell‐autonomous effect, a blockade of tumor vasculature that supplies blood to the tumor cells in a non‐cell‐autonomous fashion.
We confirmed that subcutaneous tumors made of a colon cancer cell line, LoVo, which was non‐sensitive to YO in vitro, were partially regressed by YO at 10 mg/kg/day (data not shown). The effect of YO on the LoVo tumors, however, was not as strong as on tumors made of parental DND‐41 and several other T‐ALL cell lines, again supporting the idea that the exceptionally strong effect of YO on T‐ALL xenografts is due to the inhibiting effect of YO on Notch signaling at two independent targets in vivo.
As shown in Figure 3(b), inhibition of Notch1 activation in vivo was almost complete with YO at 10 mg/kg but incomplete with YO at 1 mg/kg. On the other hand, the effect of YO in vitro was saturated by YO >10 nM, as shown in Figure 1(c). These findings might indicate that >10 nM serum/tissue concentration is achieved with 10 mg/kg and 1–10 nM with 1 mg/kg administration, if both in vitro and in vivo results are considered together. Whereas administration of YO at 1–3 mg/kg/day for up to 4 weeks did not cause weight loss, diarrhea, or hair coat abnormalities in mice, treatment at 10 mg/kg/day for more than 2 weeks resulted in obvious weight loss, diarrhea, and hair coat roughness. This implies a narrow window of YO for the treatment purpose. Nevertheless, it also indicates that the sensitivity to YO is variable among tissues and cells, and this difference might be important for YO to be considered as a drug. Together with the results described in previous papers,( 18 , 29 , 30 ) a subset of T‐ALL cells may be the most sensitive among others and possibly similar to melenocyte stem cells and splenic marginal zone B cells. In contrast, thymocyte progenitors and intestinal goblet cells appear to be less sensitive to YO.
Based on the facts that subcutaneous tumors from T‐ALL cell lines do not represent common clinical presentations and that our finding might depend on the experimental model that we chose in this study, the question arises as to how the current findings can be translated to clinical application. The vasculature component might be negligible in the leukemia model, but the effect of the combination of cell‐autonomous apoptosis induction in leukemia cells with the inhibition of angiogenesis in leukemic cell‐infiltrating bone marrow is not known. The effectiveness of YO in a leukemia model must be examined using the same T‐ALL cell lines.
The discovery of NOTCH1 activating mutations in T‐ALL has made the Notch pathway an attractive target for therapy.( 31 ) The results described here indicate the rationale for the use of GSI in the treatment of T‐ALL, as well as for solid tumors whose tumor vasculature formation is dependent on Notch signaling.
Nevertheless, resistance of T‐ALL against GSI might limit the clinical use of GSI. Recently, mutational loss of the phosphatase and tensin homolog (PTEN) gene, which encodes a key tumor suppressor that inhibits the phosphatidylinositol‐3 kinase (PI3K)–Akt signaling pathway, was discovered in T‐ALL cells that are resistant to GSI.( 32 ) This could explain the variation of GSI sensitivity among T‐ALL cells. Our results with HPB‐ALL raise a different issue. This cell line was very sensitive to YO in vitro, but subcutaneous tumors derived from HPB‐ALL appeared to be less sensitive to YO compared to other cells such as DND‐41. This result indicates that YO concentrations sufficient to inhibit Notch1 activation may not be achieved in the subcutaneous tumor made from HPB‐ALL. In addition, it is likely that inhibition of tumor vessel formation is less efficient for the reduction of subcutaneous HPB‐ALL tumors for some reasons, such that this particular tumor is less dependent on tumor vessels.
Expectations and questions are intermingled with regard to the development of GSI and other Notch signal inhibitors for the treatment of T‐ALL as well as other tumors. Nevertheless, various Notch signal inhibitors are being developed aiming at clinical use.
Acknowledgments
We thank Toshio Kitamura (Institute of Medical Science, University of Tokyo) for the pMYs/IRES‐EGFP retrovirus vector and Akira Harashima (Hayashibara Biomedical Laboratories) for the T‐ALL cell lines (ALL‐SIL, DND‐41, HPB‐ALL, KOPT‐K1, TALL‐1, MOLT‐4, PF‐382, and CEM). This work was supported in part by Grants‐in‐Aid for Scientific Research (KAKENHI nos. 17014023, 18013012, and 19390258) from the Ministry of Education, Culture, Sports, Science and Technology (MEXT) of Japan, and a Research Grant from the Sagawa Foundation of Promotion of Cancer Sciences to S.C.; Grants‐in‐Aid for Young Scientists (KAKENHI nos. 17790637 and 19790660) from MEXT; research funding for young scientists from the Science and Technology Foundation of Japan; research funding from the Japan Leukemia Research Fund; and research funding from Aichi Cancer Research Foundation to S.M.
References
- 1. Grabher C, Von Boehmer H, Look AT. Notch 1 activation in the molecular pathogenesis of T‐cell acute lymphoblastic leukaemia. Nat Rev Cancer 2006; 6: 347–59. [DOI] [PubMed] [Google Scholar]
- 2. Leong KG, Karsan A. Recent insights into the role of Notch signaling in tumorigenesis. Blood 2006; 107: 2223–33. [DOI] [PubMed] [Google Scholar]
- 3. Mumm JS, Kopan R. Notch signaling: from the outside in. Dev Biol 2000; 228: 151–65. [DOI] [PubMed] [Google Scholar]
- 4. Pear WS, Aster JC. T cell acute lymphoblastic leukemia/lymphoma: a human cancer commonly associated with aberrant NOTCH1 signaling. Curr Opin Hematol 2004; 11: 426–33. [DOI] [PubMed] [Google Scholar]
- 5. Lee SY, Kumano K, Nakazaki K et al. Gain‐of‐function mutations and copy number increases of Notch2 in diffuse large B‐cell lymphoma. Cancer Sci 2009; 100: 920–6. [DOI] [PMC free article] [PubMed] [Google Scholar]
- 6. Pear WS, Aster JC, Scott ML et al. Exclusive development of T cell neoplasms in mice transplanted with bone marrow expressing activated Notch alleles. J Exp Med 1996; 183: 2283–91. [DOI] [PMC free article] [PubMed] [Google Scholar]
- 7. Weng AP, Ferrando AA, Lee W et al. Activating mutations of NOTCH1 in human T cell acute lymphoblastic leukemia. Science 2004; 306: 269–71. [DOI] [PubMed] [Google Scholar]
- 8. Lee SY, Kumano K, Masuda S et al. Mutations of the Notch1 gene in T‐cell acute lymphoblastic leukemia: analysis in adults and children. Leukemia 2005; 19: 1841–3. [DOI] [PubMed] [Google Scholar]
- 9. Dumortier A, Jeannet R, Kirstetter P et al. Notch activation is an early and critical event during T‐Cell leukemogenesis in Ikaros‐deficient mice. Mol Cell Biol 2006; 26: 209–20. [DOI] [PMC free article] [PubMed] [Google Scholar]
- 10. Lin YW, Nichols RA, Letterio JJ, Aplan PD. Notch1 mutations are important for leukemic transformation in murine models of precursor‐T leukemia/lymphoma. Blood 2006; 107: 2540–3. [DOI] [PMC free article] [PubMed] [Google Scholar]
- 11. O’Neil J, Calvo J, McKenna K et al. Activating Notch1 mutations in mouse models of T‐ALL. Blood 2006; 107: 781–5. [DOI] [PMC free article] [PubMed] [Google Scholar]
- 12. Reschly EJ, Spaulding C, Vilimas T et al. Notch1 promotes survival of E2A‐deficient T cell lymphomas through pre‐T cell receptor‐dependent and ‐independent mechanisms. Blood 2006; 107: 4115–21. [DOI] [PMC free article] [PubMed] [Google Scholar]
- 13. Weng AP, Nam Y, Wolfe MS et al. Growth suppression of pre‐T acute lymphoblastic leukemia cells by inhibition of notch signaling. Mol Cell Biol 2003; 23: 655–64. [DOI] [PMC free article] [PubMed] [Google Scholar]
- 14. Lewis HD, Leveridge M, Strack PR et al. Apoptosis in T cell acute lymphoblastic leukemia cells after cell cycle arrest induced by pharmacological inhibition of Notch signaling. Chem Biol 2007; 14: 209–19. [DOI] [PubMed] [Google Scholar]
- 15. O’Neil J, Grim J, Strack P et al. FBW7 mutations in leukemic cells mediate NOTCH pathway activation and resistance to γ‐secretase inhibitors. J Exp Med 2007; 204: 1813–24. [DOI] [PMC free article] [PubMed] [Google Scholar]
- 16. Shih IeM, Wang TL. Notch signaling, γ‐secretase inhibitors, and cancer therapy. Cancer Res 2007; 67: 1879–82. [DOI] [PubMed] [Google Scholar]
- 17. Fuwa H, Okamura Y, Morohashi Y et al. Highly efficient synthesis of medium‐sized lactams via intramolecular Staudingeraza‐Wittig reaction of w‐azido pentafluorophenyl ester: synthesis and biological evaluation of Ly411575 analogues. Tetrahedron Lett 2004; 45: 2323–6. [Google Scholar]
- 18. Kumano K, Masuda S, Sata M et al. Both Notch1 and Notch2 contribute to the regulation of melanocyte homeostasis. Pigment Cell Melanoma Res 2008; 21: 70–8. [DOI] [PubMed] [Google Scholar]
- 19. Wong GT, Manfra D, Poulet FM et al. Chronic treatment with the gamma‐secretase inhibitor LY‐411,575 inhibits beta‐amyloid peptide production and alters lymphopoiesis and intestinal cell differentiation. J Biol Chem 2004; 279: 12876–82. [DOI] [PubMed] [Google Scholar]
- 20. Kumano K, Chiba S, Kunisato A et al. Notch1 but not Notch2 is essential for generating hematopoietic stem cells from endothelial cells. Immunity 2003; 18: 699–711. [DOI] [PubMed] [Google Scholar]
- 21. Kitamura T, Koshino Y, Shibata F et al. Retrovirus‐mediated gene transfer and expression cloning: powerful tools in functional genomics. Exp Hematol 2003; 31: 1007–14. [PubMed] [Google Scholar]
- 22. Masuda S, Kumano K, Shimizu K et al. Notch1 oncoprotein antagonizes TGF‐beta/Smad‐mediated cell growth suppression via sequestration of coactivator p300. Cancer Sci 2005; 96: 274–82. [DOI] [PMC free article] [PubMed] [Google Scholar]
- 23. Noguera‐Troise I, Daly C, Papadopoulos NJ et al. Blockade of Dll4 inhibits tumour growth by promoting non‐productive angiogenesis. Nature 2006; 444: 1032–7. [DOI] [PubMed] [Google Scholar]
- 24. Ridgway J, Zhang G, Wu Y et al. Inhibition of Dll4 signalling inhibits tumour growth by deregulating angiogenesis. Nature 2006; 444: 1083–7. [DOI] [PubMed] [Google Scholar]
- 25. Hellstrom M, Phng LK, Hofmann JJ et al. Dll4 signalling through Notch1 regulates formation of tip cells during angiogenesis. Nature 2007; 445: 776–80. [DOI] [PubMed] [Google Scholar]
- 26. Siekmann AF, Lawson ND. Notch signalling limits angiogenic cell behaviour in developing zebrafish arteries. Nature 2007; 445: 781–4. [DOI] [PubMed] [Google Scholar]
- 27. Yamanda S, Ebihara S, Asada M et al. Role of ephrinB2 in nonproductive angiogenesis induced by Delta‐like 4 blockade. Blood 2009; 113: 3631–9. [DOI] [PubMed] [Google Scholar]
- 28. Real PJ, Tosello V, Palomero T et al. Gamma‐secretase inhibitors reverse glucocorticoid resistance in T cell acute lymphoblastic leukemia. Nat Med 2009; 15: 50–8. [DOI] [PMC free article] [PubMed] [Google Scholar]
- 29. Radtke F, Wilson A, Stark G et al. Deficient T cell fate specification in mice with an induced inactivation of Notch1. Immunity 1999; 10: 547–58. [DOI] [PubMed] [Google Scholar]
- 30. Saito T, Chiba S, Ichikawa M et al. Notch2 is preferentially expressed in mature B cells and indispensable for marginal zone B lineage development. Immunity 2003; 18: 675–85. [DOI] [PubMed] [Google Scholar]
- 31. Aster JC. Deregulated NOTCH signaling in acute T‐cell lymphoblastic leukemia/lymphoma: new insights, questions, and opportunities. Int J Hematol 2005; 82: 295–301. [DOI] [PubMed] [Google Scholar]
- 32. Palomero T, Sulis ML, Cortina M et al. Mutational loss of PTEN induces resistance to NOTCH1 inhibition in T‐cell leukemia. Nat Med 2007; 13: 1203–10. [DOI] [PMC free article] [PubMed] [Google Scholar]