

Abstract
We examined a large number of primary high‐grade neuroendocrine tumors of the lung (10 small cell lung carcinomas and 31 large cell neuroendocrine carcinomas) by using array‐based comparative genomic hybridization using microarrays spotted with 800 bacterial artificial chromosome clones containing tumor‐related genes from throughout the human genome. We identified the genome‐wide copy number alteration profiles of these tumors, including recurrent amplifications located at 2q21.2, 3q21–27, 3q26, 3q27–29, 5p14.2, 5p13, 7q21.1, 8q21, and 8q24 and homozygous deletions at 1p36, 4p16, 4p16.3, 9p21.3, 9p21, 19p13.3, and 20q13. Our results revealed that small cell lung carcinomas and large cell neuroendocrine carcinomas have multiple characteristic chromosomal alterations in common, but that distinctive alterations also exist between the two subtypes. Moreover, we found that the two subtypes undergo different processes of accumulating these genetic alterations during tumor development. By comparing the genetic profiles with the clinicopathological features, we discovered many chromosomal loci whose alterations were significantly associated with clinical stage and patient prognosis. These results will be valuable for evaluating clinical status, including patient prognosis, and for identifying novel molecular targets for effective therapies. (Cancer Sci 2005; 96: 661 – 667)
Abbreviations:
- BAC
bacterial artificial chromosome
- CGH
comparative genomic hybridization
- LCNEC
large cell neuroendocrine carcinoma
- NSCLC
non‐small cell lung carcinoma
- SCLC
small cell lung carcinoma.
Lung cancer is one of the leading causes of cancer‐related death in the world.( 1 ) In clinical practice, lung cancer is divided into two categories, SCLC and NSCLC. In 1999, the World Health Organization (WHO) introduced a new pathological subtype, LCNEC, and established an entity of high‐grade neuroendocrine lung tumors, which includes both SCLC and LCNEC.( 2 )
Histologically, LCNEC lack any architectural features of glandular or squamous differentiation and are cytologically different from SCLC, but like SCLC they show neuroendocrine differentiation. The two subtypes also have common clinical features such as preponderance in men and smokers, and aggressive tumor characters.( 3 ) Like SCLC, LCNEC have a worse prognosis even at an early stage than other subtypes of NSCLC, and the 5‐year survival rate ranges from 27 to 57%.( 3 , 4 ) It is still uncertain, but clinically an important question, as to whether LCNEC have similar sensitivities to conventional chemotherapies as SCLC, and new therapeutic strategies for these tumors are urgently required.
Although much interest has recently been focused on LCNEC, details of their genetic aberrations remain unclear, and previous studies arguing that LCNEC and SCLC are genetically similar are not conclusive. Allelotyping and CGH analyses have demonstrated that there are both similar and distinctive genetic alterations in the two subtypes, but the number of cases analyzed has been small and the resolution of these analyses low.( 5 , 6 ) Therefore, further extensive analyses of genetic alterations in these tumors are required if we are to understand their clinicopathological nature and discover appropriate therapeutic targets.
We used an array‐based CGH method that enabled us to carry out genome‐wide detection of copy number alterations and to define genetic alterations such as amplification or deletion in smaller regions than detected by other methods such as allelotyping or CGH. We analyzed a large number of primary high‐grade neuroendocrine tumors: 10 SCLC and 31 LCNEC. We also compared their genetic alteration profiles with their clinicopathological features to elucidate the loci responsible for these factors. Our results extended those of previous studies by discovering novel and small recurrent chromosomal alterations, including amplifications and homozygous deletions, in these tumors. Moreover, we located specific loci whose alterations were significantly associated with clinical features such as clinical stage and patient outcome.
Materials and Methods
Tumor samples
We examined 10 primary SCLC and 31 primary LCNEC surgically resected at the National Cancer Center Hospital between 1995 and 2004. All cases were reviewed by three pathologists (WX.P., T.S., and Y.M) to verify the original histopathological diagnosis and staging according to the WHO classification system.( 2 ) The stage of disease was based on the TNM classification using the UICC (Union Internationale Contre le Cancer) staging system. The clinicopathological features of patients are shown in Table 1.
Table 1.
Clinicopathological features of patients
| SCLC (n = 10) | LCNEC (n = 31) | |
|---|---|---|
| Sex | ||
| Male | 9 | 27 |
| Female | 1 | 4 |
| Smoking habits | ||
| Smoker | 10 | 29 |
| Non‐smoker | 0 | 2 |
| Stage | ||
| I | 3 | 18 |
| II–III | 7 | 13 |
Extraction and amplification of DNA from microdissected tumor cells
Five‐micrometer sections of methanol‐fixed paraffin‐embedded tissues were subjected to laser‐captured microdissection, as described previously.( 7 ) Microdissected tumor cells were put in 200 µL lysis buffer (10 mM Tris‐HCl, pH 7.5, 1 mM ethylenediamine tetraacetic acid [EDTA], 0.5% sodium dodecylsulfate [SDS]), digested by proteinase K, and purified by the standard phenol‐chloroform extraction method. DNA was amplified by adaptor‐ligation‐mediated polymerase chain reaction (PCR).( 8 )
Array‐based comparative genomic hybridization
We used a custom‐made array (MCG Cancer Array‐800) spotted with duplicate 800 BAC clones carrying genes or sequence‐tagged site makers of potential importance in various cancers. CGH array hybridizations were performed as described elsewhere.( 9 ) Image analysis was performed using a scanner (FLA8000, Fuji Film, Tokyo, Japan) and GenePix Pro 5.0 imaging software (Axon Instruments, Foster City, CA, USA). Validation of the signals and determination of thresholds were performed as in our own and other previous studies.( 9 , 10 , 11 ) The median of the signal ratio (test signal/reference signal) of each duplicated spot was defined as a gain or a loss when it was greater than 1.25 or less than 0.75, respectively. Amplification or homozygous deletion was defined when the median of the signal ratio was more than 2 or less than 0.3, respectively.
Statistical analysis
Fisher's exact test was used for statistical analyses. Survival analysis was performed according to the Kaplan–Meier method and the multivariate Cox regression model. The length of survival was defined as the interval between the date of surgery and the time of tumor death, or the time of the last follow up (for patients who were still alive). P‐values less than 0.05 were regarded as significant.
Results
Array‐based CGH analysis of high‐grade neuroendocrine tumors of the lung
We examined a total of 10 primary SCLC and 31 primary LCNEC by using an array‐based CGH method. The frequencies of chromosomal aberrations at each locus (losses and gains) detected in SCLC and LCNEC are presented in Figure 1. On average, 39% (312 ± 96, mean ± standard deviation) of the examined 800 loci including 21% (168 ± 56) loci gained and 18% (144 ± 48) loci lost were altered in SCLC and 43% (344 ± 72) of the examined loci, including 23% (184 ± 32) loci gained and 20% (160 ± 40) loci lost were altered in LCNEC. There was no significant difference in alteration rate between the two subtypes. Frequently gained loci included 1q, 2q31–33, 3q21–29, 5p12–14, 7q21–33, 8q21–24, 12q13–23 and 18q11–21 in these tumors. Loci that had high‐level amplifications in either SCLC or LCNEC are shown in Table 2. The most frequently recurring amplification was detected at 5p14.2, followed by 3q26, 5p13 (containing the DAB2 gene), 3q21–3q27, 7q21.1, 3q27–3q29, 5p13 (containing the SKP2 gene), 2q21.2, 8q24, and 8q21 in both subtypes. Frequently lost loci were 1p35–36, 3p14–26, 4q21–31, 5q21–35, 10q, 13q33–34, 16q21–24, 17p11–13, and 22q11–13. Homozygous deletions were less common than amplifications, and all the homozygous deletions were observed in LCNEC. We detected seven homozygous deletions, including those at 1p36, 4p16, 4p16.3, 9p21.3, 9p21, 19p13.3, and 20q13. Three loci (4p16, 4p16.3, and 9p21) showed recurrent homozygous deletions in two cases.
Figure 1.
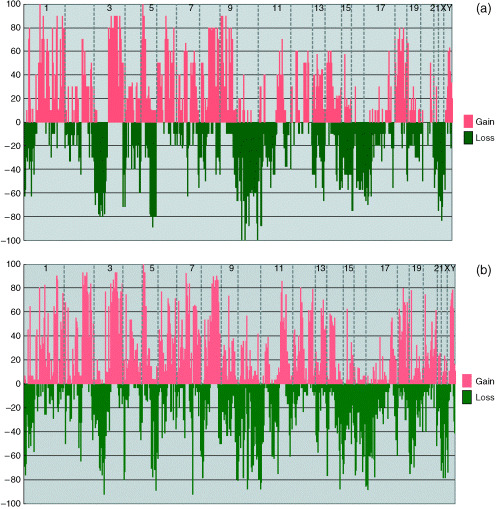
Genome‐wide copy number alteration profiles of (a) SCLC and (b) LCNEC. Frequencies (%) of chromosomal gains (upper panel) and losses (lower panel) are plotted from chromosome 1 (left) to Y (right). Each chromosome (only odd numbers are indicated) is divided by vertical dotted lines. Frequent gains at 1q, 3q21–29, 5p12–14.3, 7q21–33, 8q21–24, 12q13–23, and 18q11–21 and losses at 1p35–36, 3p14–26, 5q21–35, 10q, 13q33–34, 16q21–24, 17p11–13, and 22q11–13 were observed in both tumors. Losses at 3p26–22 and 4q21–31 were significantly observed in SCLC, while a gain at 2q31–33 and a loss at 6p21.3 were significantly correlated with LCNEC.
Table 2.
Amplifications in both subtypes
| Loci (candidate gene) | Frequency (%) in SCLC | Frequency (%) in LCNEC | Loci (candidate gene) | Frequency (%) in SCLC | Frequency (%) in LCNEC |
|---|---|---|---|---|---|
| 1p34.3 (MYCL1) | 0 | 10 | 8q12 (LYN) | 0 | 7 |
| 1p32 (RLF) | 0 | 10 | 8q12–8q13 (IL7) | 0 | 29 |
| 1p32 (EPS15) | 0 | 6 | 8q21 (TPD52) | 0 | 13 |
| 1p22 (DPYD) | 20 | 7 | *8q21 (NBS1) | 10 | 40 |
| 1q25 (TPR) | 30 | 23 | 8p22–8q21.3 (E2F5) | 0 | 25 |
| 1q25.2–1q25.3 (PTGS2) | 30 | 16 | 8q22 (MYBL1) | 0 | 6 |
| *2q21.2 (LRP1B) | 40 | 23 | 8q22 (STK3) | 0 | 17 |
| 2q31–2q32 (ITGA4) | 0 | 6 | 8q22 (HAS2) | 0 | 33 |
| 3q21–3q25 (TM4SF1) | 30 | 3 | 8q22.1 (P53INP1) | 0 | 10 |
| *3q21–3q27 (MME) | 60 | 19 | 8q22–8q23 (EIF3S6) | 0 | 30 |
| 3q25.1 (MLF1) | 20 | 6 | 8q23 (EXT1) | 0 | 10 |
| 3q26 (SNO) | 20 | 6 | *8q24 (OPG) | 10 | 48 |
| 3q26 (TERC) | 20 | 3 | 8q24 (MYC) | 0 | 10 |
| *3q26 (EVI1) | 60 | 53 | 8q24.1 (NOV) | 0 | 26 |
| 3q26 (TNFSF10) | 20 | 3 | 8q24.21 (MLZE) | 0 | 6 |
| 3q26 (PIK3CA) | 20 | 6 | 12p12.1 (KRAS2) | 0 | 10 |
| 3q26.1–3q26.2 (ECT2) | 30 | 13 | 12p11.2 (KRAG) | 0 | 6 |
| 3q26.2 (EIF5A2) | 20 | 10 | 12p12.1–12p11.2 (PTHLH) | 0 | 10 |
| 3q26.33 (USP13) | 20 | 6 | 14q12 (MBIP) | 10 | 16 |
| 3q27 (BCL6) | 20 | 3 | 14q12 (HNF3A) | 0 | 10 |
| *3q27–3q29 (TP63) | 40 | 26 | 14q13 (FKHL1) | 20 | 13 |
| 3q28 (ETV5) | 20 | 6 | 18q11.2 (RBBP8) | 10 | 7 |
| 3q28 (SST) | 30 | 10 | 18q11.2 (SSXT) | 0 | 6 |
| 5p14.3 (CDH12) | 10 | 23 | 18q21 (MADH2) | 10 | 10 |
| *5p14.2 (CDH10) | 60 | 73 | 18q21 (DCC) | 10 | 10 |
| *5p13 (SKP2) | 20 | 42 | 18q21 (GRP) | 10 | 10 |
| *5p13 (DAB2) | 50 | 49 | 18q21 (MLL1) | 0 | 6 |
| 5p13 (PC4) | 0 | 10 | 18q21.3 (PI5) | 10 | 6 |
| 5p12 (GHR) | 10 | 6 | 18q21.3 (FVT1) | 1 | 6 |
| 5p12 (ZNF131) | 0 | 13 | 18q21.3 (SCCA1, SCCA2) | 0 | 15 |
| *7q21.1 (HGF) | 44 | 32 | 18q22 (BCL2) | 10 | 7 |
Loci amplified in more than 30% of cases.
Comparison of genetic alterations in SCLC and LCNEC
Most frequent chromosomal alterations were observed with similar frequencies in both subtypes (Fig. 1). In contrast, significant differences between these tumors in terms of the frequencies and combinations of alterations were also observed (Table 3, Fig. 2). Losses at 3p26–22, 4q21, 4q24, and 4q31, were detected at significant levels in SCLC (P < 0.05), whereas gains at 2q31, 2q32.2 and 2q33 and loss at 6p21.3 were significantly correlated with LCNEC (P < 0.05). All of these alterations, except losses at 3p26–22 and 6p21.3, were significantly detected between stage I SCLC and stage I LCNEC (Table 3).
Table 3.
Significantly different chromosomal alterations in SCLC and LCNEC
| Loci (candidate gene) | Alteration | SCLC in all stages (n= 10) | LCNEC in all stages (n= 31) | P † | SCLC in stage I (n= 3) | LCNEC in stage I (n= 18) | P ‡ |
|---|---|---|---|---|---|---|---|
| 2q31(PMS1) | Gain | 3 (30%) | 28 (93%) | 0.00050 | 0 | 15 (83%) | 0.015 |
| 2q32.2(SLC11L3) | Gain | 4 (40%) | 28 (93%) | 0.0029 | 0 | 14 (78%) | 0.026 |
| 2q32.2(FLJ20752) | Gain | 3 (30%) | 27 (83%) | 0.0013 | 0 | 14 (78%) | 0.026 |
| 2q32.2(GDF8) | Gain | 3 (30%) | 29 (93%) | 0.00016 | 0 | 17 (94%) | 0.003 |
| 2q32.2(HIBCH) | Gain | 3 (30%) | 24 (77%) | 0.017 | 0 | 14 (78%) | 0.026 |
| 2q33(AIP‐1) | Gain | 3 (30%) | 24 (77%) | 0.017 | 0 | 17 (94%) | 0.003 |
| *3p26‐22(FANCD) | Loss | 6 (60%) | 4 (13%) | 0.0064 | 2 (67%) | 3 (17%) | 0.13 |
| *4q21(FGF5) | Loss | 4 (40%) | 0 | 0.002 | 3 (100%) | 0 | 0.00075 |
| *4q24(EIF4E) | Loss | 4 (40%) | 1 (3%) | 0.009 | 3 (100%) | 1 (6%) | 0.003 |
| *4q24(NFKB) | Loss | 4 (40%) | 0 | 0.002 | 3 (100%) | 0 | 0.00075 |
| *4q31(ABCE1) | Loss | 3 (30%) | 0 | 0.011 | 3 (100%) | 0 | 0.00075 |
| 6p21.3(TNFA) | Loss | 0 | 14 (47%) | 0.0085 | 0 | 10 (56%) | 0.21 |
Chromosomal alterations significantly observed in SCLC.
† Between all cases of SCLC and LCNEC, according to Fisher's exact test.
‡ Between stage I cases of SCLC and LCNEC, according to Fisher's exact test.
Figure 2.
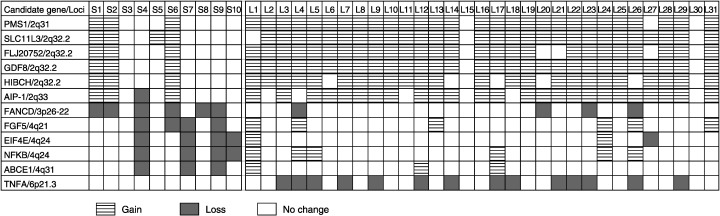
Different chromosomal alteration patterns in SCLC (S1–S10) and LCNEC (L1–L31). Losses at 3p26–22, 4q21, 4q24, and 4q31 were significantly detected in SCLC, whereas gains at 2q31, 2q32.2 and 2q33 and a loss at 6p21.3 were significantly observed in LCNEC.
Correlation between chromosomal alterations and clinicopathological features
The frequency of the total chromosomal alterations in stage I SCLC was 29% (232 ± 56) and that in stage II and stage III SCLC was 43% (344 ± 88), and there was a significant difference between the two groups (P < 0.05). In contrast, the average frequency of total chromosomal alterations observed in stage I LCNEC was 42% (336 ± 80), which was almost the same as that observed in stage II or stage III LCNEC (44%, 352 ± 48). A comparison of stage I tumors revealed that LCNEC had significantly more chromosomal alterations (P < 0.05).
To determine how these alterations accumulated during tumor development, we next examined the association between specific chromosomal loci and the clinicopathological stage of disease in SCLC and LCNEC (4, 5). Comparisons of stage classifications revealed that multiple alterations were significantly observed in stage II or III LCNEC, and especially a gain at 6p21.3 as well as losses at 1p36.33, 1p36 and 1q31–32 were most significantly associated with stage II or III LCNEC (P < 0.01).
Table 4.
Chromosomal alterations associated with advanced stage in SCLC
| Loci (candidate gene) | Alteration | pStage II + III (n = 7) | pStage I (n = 3) | P * |
|---|---|---|---|---|
| 6p12.3 (DR6) | Gain | 7 (100%) | 0 | 0.0083 |
| 6q15 (MAP3K7) | Gain | 6 (86%) | 0 | 0.033 |
| 6q22 (ROS1) | Gain | 6 (86%) | 0 | 0.033 |
| 6q25 (ESR1) | Gain | 6 (86%) | 0 | 0.033 |
| 11q22 (DYNEIN) | Gain | 6 (86%) | 0 | 0.033 |
| 18q11.2 (SSXT) | Gain | 6 (86%) | 0 | 0.033 |
According to Fisher's exact test. pStage, pathological stage.
Table 5.
Chromosomal alterations associated with advanced stage in LCNEC
| Loci (candidate gene) | Alteration | pStage II + III (n = 13) | pStage I (n = 18) | P * |
|---|---|---|---|---|
| 6p21.3 (PIM1) | Gain | 5 (38%) | 0 | 0.0076 |
| 12p13.33d−12q24.33d (CCNT1) | Gain | 7 (54%) | 2 (11%) | 0.017 |
| 12q24.31 (DOC1) | Gain | 4 (31%) | 0 | 0.023 |
| 18p11.32c (D18S552) | Gain | 11 (85%) | 7 (39%) | 0.025 |
| 1p36.33 (PRKCZ) | Loss | 13 (100%) | 7 (39%) | 0.00044 |
| 1p36 (SKI) | Loss | 12 (92%) | 9 (50%) | 0.02 |
| 1p36 (p73) | Loss | 12 (92%) | 8 (44%) | 0.0084 |
| 1p36.2–36.12 (PAX7) | Loss | 10 (77%) | 6 (33%) | 0.03 |
| 1p36.1 (CDC42) | Loss | 10 (77%) | 6 (33%) | 0.03 |
| 1p36.2 (FGR) | Loss | 9 (69%) | 4 (22%) | 0.013 |
| 1q21 (NTRK1) | Loss | 7 (54%) | 2 (11%) | 0.017 |
| 1q32 (PTPN7) | Loss | 6 (46%) | 0 | 0.0023 |
| 1q31‐32 (PCTK3) | Loss | 7 (54%) | 0 | 0.00065 |
| 1q32 (KISS1) | Loss | 5 (38%) | 0 | 0.0076 |
| 9q34.3 (RXRA) | Loss | 12 (92%) | 9 (51%) | 0.02 |
| 9q34.3 (NOTCH1) | Loss | 12 (92%) | 6 (33%) | 0.0024 |
| 9q34.3 (ABCA2) | Loss | 12 (92%) | 9 (50%) | 0.02 |
| 10p11.2 (COT) | Loss | 7 (54%) | 2 (11%) | 0.017 |
According to Fisher's exact test. pStage, pathological stage.
Association between chromosomal numerical alterations or clinicopathological features and patient outcome
The 5‐year survival rates of patients with SCLC and LCNEC were 33% (2/6) and 25% (4/16), respectively. Using Kaplan–Meier analysis, we estimated the probabilities of survival of cases according to the presence or absence of each chromosomal alteration in all 800 loci and found 10 loci whose aberrations showed significant association with patient outcome (P < 0.05; Table 6). They are gains at 8q24 (candidate gene: MYC), 8q24 (candidate gene: PVT1), 18q11.2, 20p13–12.1, 20q11.21, 20q11–12 and losses at 10q22.1, 10q25–26.3, 10q26, and 10q26.3. To determine the independent prognostic factors, we used the multivariate Cox proportional hazard model on the clinicopathological features (sex, age, tumor size, lymph node metastasis, and pathological stage) and the loci list in Table 6. A loss at 10q22.1 as well as pathological stage were significantly associated with poor prognosis (P < 0.05). Tumors with loss at 10q22.1 showed significantly poorer prognosis according to the log‐rank test (P < 0.005; Fig. 3).
Table 6.
Chromosomal alterations associated with patient prognosis in LCNEC
| Loci | Alteration | P * |
|---|---|---|
| 8q24 (MYC) | Gain | 0.025 |
| 8q24 (PVT1) | Gain | 0.025 |
| 18q11.2 | Gain | 0.0078 |
| 20p13f‐12.1 | Gain | 0.041 |
| 20q11.21 | Gain | 0.027 |
| 20q11‐12 | Gain | 0.041 |
| 10q22.1 | Loss | 0.0038 |
| 10q25‐26.3f | Loss | 0.047 |
| 10q26 | Loss | 0.03 |
| 10q26.3 | Loss | 0.03 |
According to the log‐rank test.
Figure 3.
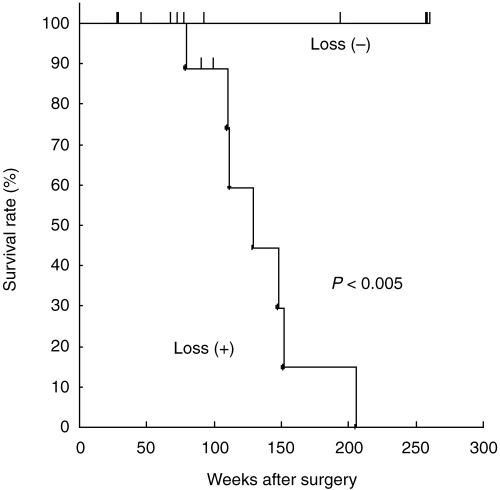
Kaplan–Meier survival curves for LCNEC patients with (16 patients) and without (five patients) 10q22.1 losses.
Because of the limited number of cases available, we were unable to detect any chromosomal alterations that were significantly associated with patient outcome in SCLC.
Discussion
We elucidated the chromosomal alteration profiles of a large number of primary high‐grade neuroendocrine lung tumors. SCLC are usually discovered as advanced tumors and treated with chemotherapy; therefore, the available number of surgical specimens is limited and most of the previous studies have analyzed smaller numbers of primary cases and/or cell lines.( 5 , 6 ) LCNEC are also frequently diagnosed at advanced stages. We analyzed primary tumors because we could directly correlate their genetic profiles with the clinicopathological features and identify clinically important chromosomal aberrations that had not yet been analyzed. Because the classification of high‐grade neuroendocrine tumors is based on histopathological findings, it is clinically important to determine the level of genetic similarity between SCLC and LCNEC. Our high‐resolution analysis revealed that multiple chromosomal alterations were common in both subtypes, which confirmed the results of previous allelotyping, CGH, and karyotyping analyses.( 12 , 13 , 14 , 15 ) Furthermore, we also identified new common alterations, such as gains at 1q, 7q21–33, 12q13–23, and 18q11–21 and losses at 16q21–24. Therefore, our results suggest that SCLC and LCNEC have quite similar genetic profiles and that high‐grade neuroendocrine tumors can be classified as genetically distinct tumors. Because frequent gains at 1q, 3q, 5p, 7q, 8q, and 12q and losses at 3p, 5q, 10q, 13q, 17p, and 22q have been reported in NSCLC,( 16 , 17 , 18 , 19 ) some of the aberrations observed in our study might also occur in other types of lung cancer. Specific alterations, including gains at 18q11–22 and losses at 1p35–36 and 16q21–24, which are not frequently reported in NSCLC, might play roles in the pathogenesis of high‐grade neuroendocrine tumors.
In addition, we detected subtype‐specific chromosomal alterations. All these aberrations, except losses at 3p26–22 and 6p21.3, were observed in stage I tumors of SCLC and LCNEC (P < 0.01), suggesting that these alterations may be specific and early events in the development of LCNEC and might be implicated in the cytological difference between these two subtypes.
By comparing the stage classification with the genetic profile, we found several chromosomal aberrations to be significantly correlated with advanced tumor stage. Among them, loss at 1p36 was observed in advanced LCNEC (P < 0.01). Because of the limited number of cases, no significant correlation was seen between loss at 1p36 and progression of SCLC, but loss at this locus was observed in 70% of cases of SCLC. Furthermore, we also detected a homozygous deletion at 1p36, suggesting that this locus may contain a tumor suppressor gene in high‐grade neuroendocrine tumors. Because high‐grade neuroendocrine tumors are associated with a worse prognosis than other NSCLC, it is clinically crucial to determine what genes are implicated in the patient's outcome. We found that losses clustered at 10q22.1–26.3, especially a loss at 10q22.1, were significantly correlated with poor prognosis, suggesting that these loci may harbor important tumor suppressor genes whose alteration is closely related to the aggressive phenotypes of LCNEC. Multivariate analysis indicated that a loss at 10q22.1 as well as advanced pathological stage may be independent prognostic factors of LCNEC. Because the number of cases analyzed in the present study is still limited, further analysis of a larger cohort will be required.
In summary, we clarified the genome‐wide copy number alterations of a large number of primary high‐grade neuroendocrine tumors by using a high‐density BAC array, and demonstrated that SCLC and LCNEC have characteristic genetic profiles in common. Despite such genetic similarities, we found that there also exist distinctive genetic alterations, and that the two subtypes may undergo different processes of accumulating genetic alterations during tumor development. We also identified many chromosomal loci whose alteration may be associated with the clinicopathological features of these tumors. These results will be valuable for evaluating the clinical status, including therapeutic responsiveness and prognosis of patients, and for discovering novel molecular targets for effective therapies.
This work was supported in part by a Grant‐in‐Aid for the Comprehensive 10‐Year Strategy for Cancer Control from the Ministry of Health, Labour and Welfare, Japan.
References
- 1. Pisani P, Parkin DM, Ferlay J. Estimates of the worldwide mortality from eighteen major cancers in 1985: Implications for prevention and projections of future burden. Int J Cancer 1993; 55: 891–903. [DOI] [PubMed] [Google Scholar]
- 2. World Health Organization. Histological Typing of Lung and Pleural Tumors, 3rd edn. Berlin: Springer‐Verlag, 1999. [Google Scholar]
- 3. Takei H, Asamura H, Maeshima A et al. Large cell neuroendocrine carcinoma of the lung: a clinicopathologic study of eighty‐seven cases. J Thorac Cardiovasc Surg 2002; 124: 285–92. [DOI] [PubMed] [Google Scholar]
- 4. Iyoda A, Hiroshima K, Toyozaki T, Haga Y, Fujisawa T, Ohwada H. Clinical characterization of pulmonary large cell neuroendocrine carcinoma and large cell carcinoma with neuroendocrine morphology. Cancer 2001; 91: 1992–2000. [DOI] [PubMed] [Google Scholar]
- 5. Walch AK, Zitzelsberger HF, Aubele MM et al. Typical and atypical carcinoid tumors of the lung are characterized by 11q deletions as detected by comparative genomic hybridization. Am J Pathol 1998; 153: 1089–98. [DOI] [PMC free article] [PubMed] [Google Scholar]
- 6. Ullmann R, Schwendel A, Klemen H, Wolf G, Petersen I, Popper HH. Unbalanced chromosomal aberrations in neuroendocrine lung tumors as detected by comparative genomic hybridization. Hum Pathol 1998; 29: 1145–9. [DOI] [PubMed] [Google Scholar]
- 7. Emmert‐Buck MR, Bonner RF, Smith PD et al. Laser capture microdissection. Science 1996; 274: 998–1001. [DOI] [PubMed] [Google Scholar]
- 8. Tanabe C, Aoyagi K, Sakiyama T et al. Evaluation of a whole‐genome amplification method based on adaptor‐ligation PCR of randomly sheared genomic DNA. Genes Chromosomes Cancer 2003; 38: 168–76. [DOI] [PubMed] [Google Scholar]
- 9. Sonoda I, Imoto I, Inoue J et al. Frequent silencing of low density lipoprotein receptor‐related protein 1B (LRP1B) expression by genetic and epigenetic mechanisms in esophageal squamous cell carcinoma. Cancer Res 2004; 64: 3741–7. [DOI] [PubMed] [Google Scholar]
- 10. Douglas EJ, Fiegler H, Rowan A et al. Array comparative genomic hybridization analysis of colorectal cancer cell lines primary carcinomas. Cancer Res 2004; 64: 4817–25. [DOI] [PubMed] [Google Scholar]
- 11. Schraml P, Schwerdtfeger G, Burkhalter F et al. Combined array comparative genomic hybridization and tissue microarray analysis suggest PAK1 at 11q13.5‐q14 as a critical oncogene target in ovarian carcinoma. Am J Pathol 2003; 163: 985–92. [DOI] [PMC free article] [PubMed] [Google Scholar]
- 12. Balsara BR, Testa JR. Chromosomal imbalances in human lung cancer. Oncogene 2002; 21: 6877–83. Review. [DOI] [PubMed] [Google Scholar]
- 13. Levin NA, Brzoska P, Gupta N, Minna JD, Gray JW, Christman MF. Identification of frequent novel genetic alterations in small cell lung carcinoma. Cancer Res 1994; 54: 5086–91. [PubMed] [Google Scholar]
- 14. Boonstra R, Timmer‐Bosscha H, Van Echten‐Arends J et al. Mitoxantrone resistance in a small cell lung cancer cell line is associated with ABCA2 upregulation. Br J Cancer 2004; 90: 2411–7. [DOI] [PMC free article] [PubMed] [Google Scholar]
- 15. Schwendel A, Langreck H, Reichel M et al. Primary small‐cell lung carcinomas and their metastases are characterized by a recurrent pattern of genetic alterations. Int J Cancer 1997; 74: 86–93. [DOI] [PubMed] [Google Scholar]
- 16. Petersen I, Bujard M, Petersen S et al. Patterns of chromosomal imbalances in adenocarcinoma and squamous cell carcinoma of the lung. Cancer Res 1997; 57: 2331–5. [PubMed] [Google Scholar]
- 17. Feder M, Siegfried JM, Balshem A et al. Clinical relevance of chromosome abnormalities in non‐small cell lung cancer. Cancer Genet Cytogenet 1998; 102: 25–31. [DOI] [PubMed] [Google Scholar]
- 18. Testa JR, Siegfried JM, Liu Z et al. Cytogenetic analysis of 63 non‐small cell lung carcinomas: recurrent chromosome alterations amid frequent and widespread genomic upheaval. Genes Chromosomes Cancer 1994; 11: 178–94. [DOI] [PubMed] [Google Scholar]
- 19. Tai AL, Yan WS, Fang Y, Xie D, Sham JS, Guan XY. Recurrent chromosomal imbalances in nonsmall cell lung carcinoma: the association between 1q amplification and tumor recurrence. Cancer 2004; 100: 1918–27. [DOI] [PubMed] [Google Scholar]