

Abstract
Triterpenes are the main components with cytotoxicity in Ganoderma lucidum, which is used popularly as a complementary treatment for cancer therapy in traditional Chinese medicine. To investigate the possible interaction between chemotherapeutic agents and triterpenes extracted from G. lucidum, the cytotoxicity of doxorubicin (DOX) combined with Ganoderma triterpenes (GTS) or lucidenic acid N (LCN), a purified compound, was examined in HeLa cells. The combinations targeting DOX with GTS or LCN resulted in a synergistic interaction in HeLa cells. Moreover, to identify the molecular targets of GTS, two‐dimensional gel electrophoresis‐based comparative proteomics was carried out and proteins with altered expression levels after GTS treatment in HeLa cells were identified by matrix‐assisted laser desorption/ionization time‐of‐flight tandem mass spectrometry. The results of our proteomic study indicated that the GTS treatment caused regulated expression of 14 proteins, which play important roles in cell proliferation, the cell cycle, apoptosis, and oxidative stress. Flow cytometric analysis confirmed that GTS could induce weak G0–G1 phase arrest and combined use of GTS with DOX could induce apoptosis in cells. Furthermore, GTS enhanced the reactive oxygen species (ROS)‐producing effect of DOX, and a ROS scavenger could affect the synergism between GTS and DOX. In cells with high Ku80 protein expression, the synergism between GTS and DOX was also partly affected. Importantly, in cells with high Ku80 expression that were treated with a ROS scavenger, the synergism between GTS and DOX totally disappeared. These results suggest that the synergism between GTS and DOX might be based on GTS‐induced sensitization of cells to chemotherapeutics through enhanced oxidative stress, DNA damage, and apoptosis. (Cancer Sci 2008; 99: 1461–1470)
Abbreviations:
- ACN
acetonitrile
- CI
combination index
- 2‐DE
two‐dimensional gel electrophoresis
- DMSO
dimethyl sulfoxide
- DNA‐PK
DNA‐dependent protein kinase
- DOX
doxorubicin
- EDTA
ethylenediaminetetraacetic acid
- eIF5A
eukaryotic translation initiation factor 5A
- enoyl CoA hydratase chain 1
enoyl coenzyme A hydratase short chain 1 mitochondrial
- GTS
Ganoderma triterpenes
- H2DCFDA
2′7′‐dichlorodihydrofluorescein diacetate
- HPLC
high performance liquid chromatography
- HRP
horseradish peroxide
- LCN
lucidenic acid N
- IC50
the concentration that reduced the cell viability by 50%
- IEF
isoelectric focusing
- LDH B
lactate dehydrogenase B
- MALDI‐TOF MS/MS
matrix‐assisted laser desorption/ionization time‐of‐flight tandem mass spectrometry
- MTT
3,(4,5‐dimethylthiazol‐2‐yl‐) diphenyltetrazolium bromide
- PP2A subunit A
serine/threonine‐protein phosphatase 2A, 65‐kDa regulatory subunit A α isoform
- PBS
phosphate‐buffered saline
- PRDX2
peroxiredoxin 2
- PVDF
poly (vinylidene fluoride)
- ROS
reactive oxygen species
- SDS
sodium dodecylsulfate
- TBS
tris buffered saline
- TFA
trifluoroacetic acid
Ganoderma lucidum (Lingzhi) is a popular Asian mushroom that has been used as a home remedy in traditional Chinese Medicine in Asian countries for over 2000 years,( 1 ) and is currently also used popularly as a dietary supplement in Western countries.( 2 ) In traditional Chinese medicine it was believed to preserve human vitality and to promote longevity. More recently it has been used as a complementary treatment for cancer therapy so its anticancer activities are of particular interest. Both in vitro and in vivo investigations about the anticancer activity of G. lucidum supported its application in cancer treatment and prevention.( 3 , 4 ) Previous results have suggested that the possible mechanisms for the anticancer effect of G. lucidum include immune modulation,( 5 , 6 ) direct cytotoxicity,( 7 , 8 , 9 , 10 , 11 , 12 , 13 ) and antiangiogenesis.( 14 , 15 , 16 ) Polysaccharides( 17 ) and triterpenes,( 18 , 19 , 20 , 21 ) two kinds of bioactive ingredients in G. lucidum, might be the basis of immune‐modulation and direct cytotoxicity, respectively. It was therefore hypothesized to that G. lucidum could be used as a complementary treatment for chemotherapeutics or radiation in cancer therapy, as the direct cytotoxicity of triterpenes might enhance the cytotoxic effects of chemotherapeutic reagents or radiation and, at the same time, the immune‐modulation effect of polysaccharides might decrease the undesired effects of chemotherapeutics or radiation, such as immunosuppression. Clinical trials in China support the statement that using G. lucidum was helpful to patients who underwent chemotherapy and radiation. Unfortunately, almost all of the clinical studies were published in Chinese. As far as we know, the interaction between G. lucidum and chemotherapeutics or radiation has never been evaluated strictly using generally accepted methods such as the combination index method.
To check whether the combination of G. lucidum and chemotherapeutic reagents could achieve synergism or not, we checked the interaction between extracted GTS or a purified compound, lucidenic acid N, and DOX in cytotoxicity against HeLa cells in vitro. The nature of the interactions was analyzed using the CI method of Chou and Talalay.( 22 ) Furthermore, to study the molecular targets of GTS, a comparative proteomic approach was used for identifying proteins with altered expression levels after exposure of HeLa cells to GTS for 48 h. The protein expression profiles of cells with or without GTS treatment were checked by 2‐DE and then differentially expressed proteins were identified by MALDI‐TOF MS/MS and further confirmed by western blotting analysis. The detected change in expression of proteins suggested that GTS may induce cell cycle arrest and apoptosis, sensitize cells to chemotherapeutics, and enhance ROS induction in cells. To confirm the prediction, the effects of GTS on the cell cycle, apoptosis, and intracellular ROS production of HeLa cells were checked. Furthermore, the roles of ROS and Ku80, a protein found in a proteomic study, in the synergism between GTS and DOX were examined using a ROS scavenger or cells with high Ku80 protein expression.
Materials and Methods
Drugs and chemicals. DOX was purchased from Sigma (St Louis, MO, USA). GTS and LCN were isolated phytochemically from G. lucidum by a traditional Chinese medicine chemistry laboratory, the Shanghai Research Center for Modernization of Traditional Chinese Medicine, Shanghai Institute of Materia Medica, Chinese Academy of Sciences. Briefly, fruit bodies of G. lucidum (2 kg) were cut into small pieces and then pulverized. The powder was refluxed three times with 95% ethanol (12 L × 3). The extract was alkalized with NaHCO3 to a pH value of 8–9 and partitioned with petroleum ether and dichloromethane. The alkalized layer was acidified with HCl to a pH value of 2–3, and then partitioned with dichloromethane (1.5 L × 3). The dichloromethane layer was concentrated under vacuum to yield the GTS (35 g). GTS used in the present study was quality controlled by checking its fingerprint and the main components of GTS were identified using MS. The results of high performance liquid chromatography – diode array detector – electrospray ionization – mass spectrometry (HPLC‐DAD‐ESI‐MS) analysis of the components of GTS are shown in Figure 1. As shown in Figure 1, GTS contains compounds with similar chemical structure, including: (1) 3,7,15‐trihydroxy‐4,4,14‐trimethyl‐11‐oxochol‐8‐en‐24‐oic acid; (2) 3,7‐dihydroxy‐4,4,14‐trimethyl‐11,15‐dioxochol‐8‐en‐24‐oic acid (LCN); (3) 3‐hydroxy‐4,4,14‐trimethyl‐7,11,15‐trioxochol‐8‐en‐24‐oic acid; (4) 12‐acetoxy‐3‐hydroxy‐4,4,14‐trimethyl‐7,11,15‐trioxochol‐8‐en‐24‐oic acid (lucidenic acid E); and (5) 7,15‐dihydroxy‐4,4,14‐trimethyl‐3,11‐dioxochol‐8‐en‐24‐oic acid. For isolation of LCN, GTS (500 mg) was chromatographed on a silica gel column (2 × 40 cm) eluted with hexane : acetic ether: acetic acid (1 : 2 : 0.03) and four subfractions were obtained. Subfraction 3 (202 mg) was further purified by HPLC using methanol : ACN : H2O (52 : 5 : 43) as an eluant to obtain compound 1 (14 mg) with a purity of at least 98%. Compound 1 was confirmed spectroscopically as LCN in accordance with data in the literature.( 22 ) For use in cell treatment, DOX, GTS, and LCN were dissolved in DMSO. MTT and N‐acetyl cysteine were obtained from Sigma. H2DCFDA was bought from Molecular Probes (Eugene, OR, USA). All reagents used in 2‐DE were purchased from Bio‐Rad Laboratories (Hercules, CA, USA).
Figure 1.
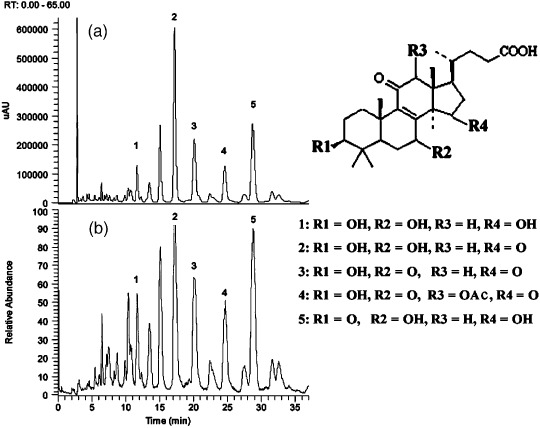
High performance liquid chromatography – diode array detector – electrospray ionization –mass spectrometry (HPLC‐DAD‐ESI‐MS) analysis of Ganoderma triterpenes. (a) High‐performance liquid chromatography‐ultraviolet chromatogram monitored at 252 nm. (b) Liquid chromatography (LC)‐negative ion ESI‐MS total ion current profile. The chemical structures of the compounds corresponding to peaks 1–5 are also shown.
Cell culture. The HeLa human cervical carcinoma cell line CCL‐2 was obtained from the American Type Culture Collection (Rockville, MD, USA). The cells were cultured in minimal essential medium (Life Technologies, Gaithersburg, MD, USA) with 2 mmol/L l‐glutamine, 1.5 g/L sodium bicarbonate, 0.1 mmol/L non‐essential amino acids, 1.0 mmol/L sodium pyruvate, 10% fetal bovine serum, 100 U/mL penicillin, and 100 µg/mL streptomycin (Invitrogen, Karlsruhe, Germany). The cultures were maintained in a humidified atmosphere of 5% CO2 at 37°C and cells were passaged at preconfluent densities by the use of a solution containing 0.05% trypsin and 0.5 mM EDTA (Life Technologies).
Growth‐inhibition assays. Tumor cell growth inhibition was measured using the MTT assay as reported previously.( 23 ) Briefly, cells were plated in 96‐well flat‐bottomed plates (Corning, Acton, MA, USA) at a density of 1 × 10³ cells/well in complete medium and allowed to attach overnight. For single‐agent studies, drugs were then added at a range of concentrations and left in contact for 72 h. For combination studies, different drugs were added concomitantly for 72 h. Control wells were treated in the same way with solvent control (0.1% DMSO). At the end of the incubation, 20 µL MTT was added to each well and the plates were incubated for 3 h at 37°C. Then, 100 µL lysis buffer (20% SDS in 50%N,N‐dimethylformamide, containing 0.5%[v : v] 80% acetic acid and 0.4%[v : v] 1 mol/L HCl) was added to each well and incubated overnight (16 h). After culture, cell viability was evaluated by measuring the mitochondrial‐dependent conversion of the yellow tetrazolium salt MTT to purple formazan crystals by metabolically active cells. The optical density (proportional to the number of live cells) was assessed with a Genios Microplate Reader (Tecan, Research Triangle Park, NC, USA) at 570 nm. Growth‐inhibition curves were plotted relative to control cells. The two drug combinations of GTS and DOX, LCN and DOX were added at a constant ratio of concentrations based on their respective individual IC50 values to cell culture, and serial 1.5‐fold dilutions were carried out to span the dose range suitable for dose–effect analysis. Each experiment was carried out using six replicated wells for each drug concentration, independently at least three times.
Determination of synergism, addition, or antagonism. Synergism, addition, or antagonism for GTS or LCN and DOX was determined by the CI method of Chou and Talalay( 22 ) using the Calcusyn software (Biosoft, Ferguson, MO, USA). The CI value was calculated based on the multiple drug–effect equation of Chou and Talalay,( 24 ) and defines drug interactions as synergistic (more than the expected activity effect or greater than an additive interaction) or antagonistic (less than the expected activity effect or less than an additive interaction). Chou and Talalay defined the CI value as <1 for synergism, 1 for additive, and >1 for antagonism.
Two‐dimensional gel electrophoresis and MALDI‐TOF MS/MS. The 2‐DE and MS identification of proteins were carried out as reported previously.( 25 ) For 2‐DE sample preparation, cells were incubated for 48 h with medium containing 0.1% DMSO (solvent control) or with the addition of 15 µg/mL (similar to IC50) GTS. Subsequently, cells were washed three times with ice‐cold PBS and then scraped off with a cell scraper. Cells were dissolved in 200 µL lysis buffer containing 7 mol/L urea, 2 mol/L thiourea, 2% CHAPS, 1% dithiothreitol, 0.8% Pharmalyte, and protease inhibitor (all from Bio‐Rad Laboratories), followed by ultrasonication (10 strokes, low amplitude) on ice. The lysed cells were centrifuged at 15 000 g for 30 min at 4°C and the supernatant containing the solubilized proteins was used for 2‐DE assay.
For 2‐DE, 150 µg protein sample was applied for IEF using ReadyStrip IPG Strips (17 cm, pH 4–7; Bio‐Rad Laboratories). The strips were placed into a protein IEF cell (Bio‐Rad Laboratories) for rehydratation at 50 V for 12 h followed by separation based on their pI. After IEF, the IPG strips were equilibrated and then applied directly to 12% homogeneous SDS‐polyacrylamide gel electrophoresis gels for electrophoresis using a Protein II xi Cell System (Bio‐Rad Laboratories). The gels were silver stained, scanned using a densitometer (GS‐800; Bio‐Rad Laboratories) and then analyzed using PD‐Quest software (Bio‐Rad Laboratories). Paired (control and GTS‐treated) protein samples from three independent experiments were analyzed by 2‐DE. For each pair of protein samples, triplicate electrophoreses were carried out to ensure reproducibility. Comparisons were made between gel images of protein profiles obtained from the GTS‐treated and control groups. The individual protein spot quantity was normalized as follows: the raw quantity of each spot in a member gel was divided by the total quantity of the valid spots in the gel. Quantitative analysis was carried out using Student's t‐test between protein gels from the control and GTS‐treated groups. The significantly differentially expressed protein spots (P < 0.05) with at least a two‐fold increase or decrease in intensity between the control and GTS‐treated groups were selected and subjected to further identification by MALDI‐TOF MS/MS.
Proteins of interest were excised from the gels with EXQuest Spot Cutter (Bio‐Rad Laboratories) and placed into a 96‐well microtitre plate. MS analysis was carried out at the Institutes of Biomedical Sciences, Fudan University, Shanghai, China as reported previously.( 25 , 26 ) Briefly, gel pieces were destained, washed twice with deionized water and shrunk by dehydration in ACN. The samples were then swollen in a digestion buffer containing 25 mmol/L ammonium bicarbonate and 12.5 ng/µL trypsin at 4°C for 30 min followed by digestion for more than 12 h at 37°C. Peptides were then extracted twice using 0.1% TFA in 50% ACN and dried under the protection of N2. For MALDI‐TOF MS/MS, peptides were mixed with 0.7 µL MALDI matrix (5 mg/mL cyano‐4‐hydroxycinnamic acid diluted in 0.1% TFA/50% ACN) and MS measurements were carried out on an ABI 4700 Proteomics Analyzer with delayed ion extraction (Applied Biosystems, Foster City, CA, US). Mass spectra were obtained in a mass range of 700–3200 Da using a laser (355 nm, 200 Hz) as the desorption ionization source, and the first five precursor ions with highest intensity were selected for fragmentation. All MS/MS data were investigated using the MASCOT search engine (Matrix Science, Boston, MA, US) against the Homo sapiens (human) subset of the sequences in the NCBI protein sequence database. The peptide mass tolerance was set at 200 p.p.m., and MS/MS tolerance was 0.5 Da. Proteins with protein score more than 50 or best ion score (MS/MS) more than 30 were accepted.
Western blotting analysis. As reported previously,( 27 ) cells were washed three times with cold TBS, harvested using a cell scraper, and lysed in 10 volumes of cold lysis buffer (50 mmol/L Tris‐HCl [pH 7.2], 250 mmol/L NaCl, 0.1% NP‐40, 2 mmol/L EDTA, 10% glycerol, 1 mmol/L phenylmethanesulfonyl fluoride, 5 µg/mL aprotinin, and 5 µg/mL leupeptin) on ice. Lysates were centrifuged and then the supernatant protein was denatured by mixing with an equal volume of 2× sample loading buffer and then boiling at 100°C for 5 min. An aliquot (50 µg as protein) of the supernatant was separated electrophoretically using a 12% SDS gel and then transferred to a PVDF membrane (Bio‐Rad Laboratories). After the PVDF membrane was incubated with 10 mmol/L TBS supplied with 1.0% Tween 20 and 10% dehydrated skim milk to block non‐specific protein binding, the membrane was incubated with primary antibodies overnight at 4°C. The primary antibodies used were rabbit anti‐Ku80/XRCC5 polyclonal antibody (1 : 1000; Chemicon, Suwon‐city, Gyeonggi‐do, Korea), mouse anti‐eIF‐5A monoclonal antibody (1 : 1000; BD Biosciences, San Diego, CA, USA), rabbit anti‐14‐3‐3β/α polyclonal antibody (1 : 1000; Abgent, San Diego, CA, USA), and mouse anti‐actin monoclonal antibody (1 : 2000; Sigma). Blots were then incubated with HRP‐conjugated goat antirabbit IgG (Sigma) or HRP‐conjugated goat antimouse IgG (Sigma) for 1 h at room temperature at a dilution of 1 : 5000 and then visualized using chemiluminescence (Pierce Biotechnology, Rockford, IL, USA).
Flow cytometric analysis of cell cycle and apoptosis. Flow cytometric analysis was conducted as reported previously.( 27 ) Briefly, adherent and detached cells were harvested with trypsin, washed three times with PBS, and then fixed in ice‐cold 70% ethanol at 4°C for 2 h. After centrifugation at 100 g for 2 min, cells were resuspended in propidium iodide stain buffer (0.1% Triton X‐100, 10 µg/mL DNase‐free RNase A, and 50 µg/mL propidium iodide in PBS) for 30 min in the dark. Flow cytometric analysis was conducted using a FACStar Plus Flow Cytometer (Becton Dickson, Franklin Lakes, NJ, US).
Determination of intracellular ROS level. Intracellular ROS levels of HeLa cells treated with GTS, DOX, or a combination of GTS and DOX were measured using H2DCFDA, which is a non‐polar compound that is hydrolyzed to a non‐fluorescent polar derivative (H2DCF) by cellular esterases after diffusing into cells.( 28 ) H2DCF is membrane impermeable and is oxidized rapidly to highly fluorescent 2′7′‐dichlorofluorescein by intracellular ROS. HeLa cells were seeded into 96‐well plates and allowed to grow for 24 h. The next day, the cells were washed with Hank's buffered salt solution and incubated with 20 µM H2DCFDA for 20 min. After removing the H2DCFDA, cells were washed twice and treated sequentially with 0.1% DMSO (solvent control), 50 µg/mL GTS, DOX (0.1, 1, or 10 µmol/L) or combinations of GTS with DOX. After incubation for 3 or 10 h, the 2′7′‐dichlorofluorescein fluorescence was detected using a Genios Microplate Reader with excitation at 485 nm and emission at 538 nm.
Effect of a ROS scavenger on the cytotoxicity of GTS, DOX, and the combination of GTS and DOX. The effect of the ROS scavenger N‐acetyl cysteine on the cytotoxicity of GTS, DOX, and the combination of GTS and DOX was checked using a method similar to that in a previous report.( 29 ) Briefly, cells were preincubated with 5 mmol/L N‐acetyl cysteine for 2 h followed by treatment with GTS, DOX, or a combination of GTS and DOX as described above. Then, the cytotoxicity of the treatments and the interaction between GTS and DOX were examined.
Effect of high Ku80 expression on the cytotoxicity of GTS, DOX, and the combination of GTS and DOX. Cells with high Ku80 protein expression were obtained by transfection of HeLa cells with a plasmid encoding human Ku80. The pcDNA3VSV plasmid encoding full‐length human Ku80 cDNA( 30 ) was a gift from Professor Zhengjun Chen (Shanghai Institute of Biochemistry and Cell Biology, Chinese Academy of Sciences). For transfection, 5 × 10⁴ cells were seeded into each well of a six‐well plate. After cultured for 48 h (when the cells reached approximately 80% confluence), cells were washed with PBS and then transfected with the plasmid using Lipofectamine 2000 (Invitrogen) according to the manufacturer's instructions. Briefly, 4 µg plasmid DNA was diluted in 300 µL serum‐free medium and then incubated for 20 min at room temperature with a mixture of 10 µL Lipofectamine 2000 and 300 µL serum‐free medium. The resultant complex mixture was then added to each well of the cell culture plate. After 6 h incubation, the medium was replaced with fresh complete medium and allowed to grow overnight. Then, G418 (Invitrogen) was added to the medium to reach a final concentration equal to the minimum fatal dose (800 µg/mL). The cells were allowed to grow and were passaged in the presence of G418 for more than 2 weeks. Ku80 expression in the transfected cells was checked using western blotting and compared with wild‐type cells. The cells with high Ku80 protein expression were then used for studying the cytotoxicity of GTS, DOX, and the combination of GTS and DOX as described above.
Effect of a ROS scavenger and high Ku80 expression on the cytotoxicity of GTS, DOX, and the combination of GTS and DOX. To check the combined effect of a ROS scavenger and high Ku80 protein expression, cells with high Ku80 expression were pretreated with 5 mmol/L N‐acetyl cysteine for 2 h followed by treatment with GTS, DOX, or the combination of GTS and DOX as described above. Then, the cytotoxicity of the treatments and the interaction between GTS and DOX were examined.
Statistical analysis. The significance of the differences between groups was determined using the non‐paired Student's t‐test (GraphPadPrism, GraphPad Software Inc., San Diego, CA, US). For each variable, three independent experiments were carried out. Data are given as the mean ± SEM.
Results
Ganoderma triterpenes and LCN show weak cytotoxicity against human carcinoma cells. The IC50 values of GTS and LCN against HeLa cells were 15.4 ± 0.6 and 86.1 ± 4.2 µg/mL, respectively. At the same time, the IC50 value of DOX was 31 ± 4.0 nmol/L for HeLa cells. The IC50 values of GTS, LCN, and DOX were then used to design doses and fixed ratios for subsequent combination studies.
Ganoderma triterpenes and LCN both show synergistic effects with DOX. The evaluation of the combined effects of GTS or LCN and DOX in HeLa cells is summarized in Figure 2. As shown in Figure 2, for the combinations of GTS and DOX, the CI values were all below 1, indicating a synergistic effect between GTS and DOX in HeLa cells. To compare the effect of GTS and LCN, the doses of LCN used in the combination assay were the same as that of GTS. Although the cytotoxicity of LCN was weaker than that of GTS, synergism was also observed in combinations of LCN with DOX (Fig. 2). Experiments to study the mechanism of the synergism were then conducted. It should be noted that only GTS was used in the following studies because the cytotoxicity of LCN was too weak to deserve further study. Also, more importantly, the most common form of clinically used traditional Chinese medicine is still plant extract, like GTS, which is a mixture of compounds.
Figure 2.
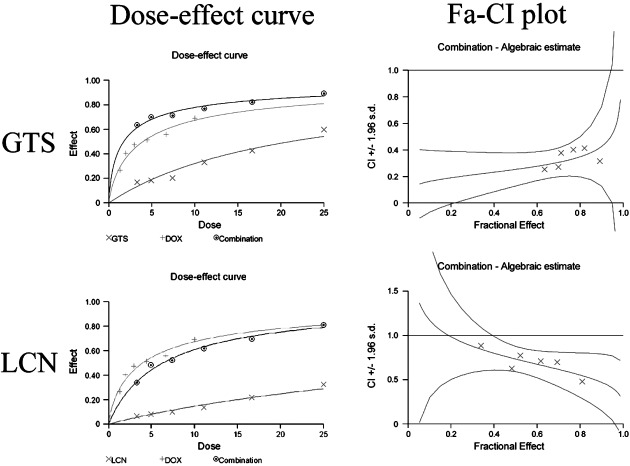
The combined effects of doxorubicin (DOX) with Ganoderma triterpenes (GTS) or DOX with lucidenic acid N (LCN) in HeLa cells. Both the dose–effect curves and the combination index (CI) values are shown. Both GTS and LCN showed synergism with DOX.
Fourteen proteins are expressed differentially in GTS‐treated HeLa cells. Representative 2‐DE gel images for control and GTS‐treated cells are shown in Figure 3a. The proteome maps of control and GTS‐treated cells were compared using PD‐QUEST software to identify protein spots whose differential expression was significant (P < 0.05), with a two‐fold or greater increase or decrease in intensity. Fourteen protein spots with regulated expression are indicated by the arrowed spots in Figure 3a and by the expanded plots in Figure 3b. The protein spots with regulated expression were cut from the gels and then identified using MALDI‐TOF MS/MS. The results of MALDI‐TOF MS/MS analysis of spot 1 are shown in Figure 4 as an example. The results of identification of the 14 proteins are summarized in Table 1. The protein score, coverage, and best ion score of each spot were reported. Protein spots 1–14 were identified as: (1) eIF5A; (2) ATP synthase F0 subunit D; (3) PRDX2; (4) 14‐3‐3 β/α; (5) Ran‐binding protein 1; (6) enoyl CoA hydratase chain 1; (7) proteasome α 1 subunit isoform 1; (8) LDH B; (9) cytokeratin 19; (10) protease inhibitor 6; (11) tryptophanyl‐tRNA synthetase; (12) PP2A subunit A; (13) tumor rejection antigen 1; and (14) chain B of Ku heterodimer (Ku80).
Figure 3.
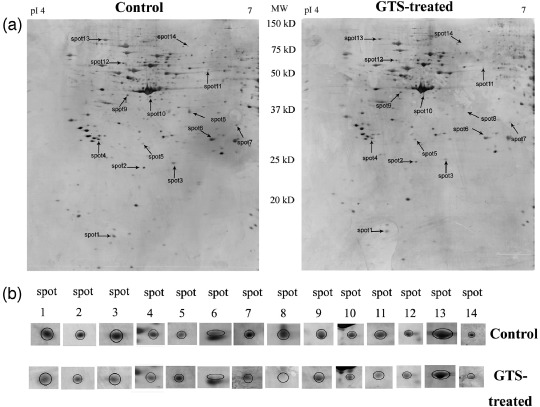
Protein expression profiles of the control and Ganoderma triterpenes (GTS)‐treated HeLa cells. (a) Representative silver‐stained 2‐dimensional electrophoresis images (immobilized pH gradient [IPG] 4–7, 12% sodium dodecylsulfate–polyacrylamide gel electrophoresis) of control and GTS‐treated HeLa cells. Differentially expressed spots were shown by the arrows. (b) The expanded region of differentially expressed protein spots.
Figure 4.
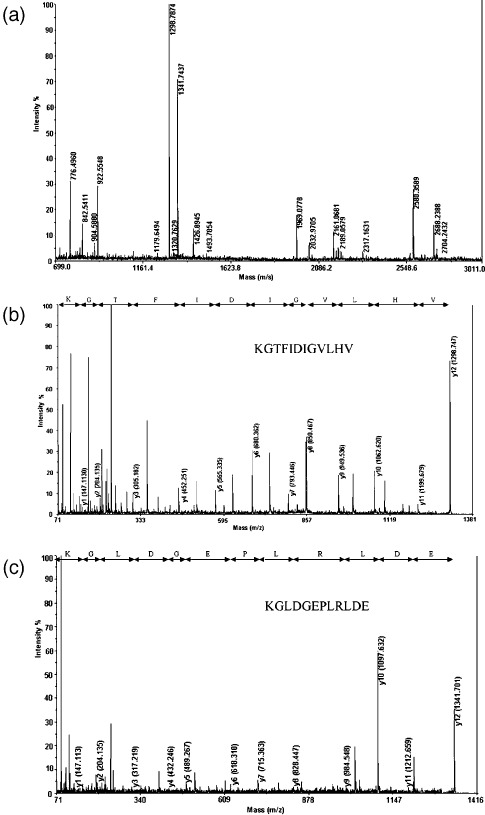
The results of the matrix‐assisted laser desorption/ionization time‐of‐flight tandem mass spectrometry (MALDI TOF MS/MS) analysis of spot 1 cut from the 2‐dimensional electrophoresis gel. It was identified to be human eIF5A (NCBI accession number 54037409) by protein database search. (a) Peptide mass fingerprint of the typtic digest of spot 1. (b) MS/MS profile of the peptide with a mass of 1298.7 Da. (c) MS/MS profile of the peptide with a mass of 1341.7 Da. y‐ions resulting from fragmentation of the peptides and amino acids they represent are indicated.
Table 1.
Identification of differentially expressed proteins in Ganoderma triterpenes (GTS)‐treated cells using matrix‐assisted laser desorption/ionization time‐of‐flight tandem mass spectrometry
| Spot | Target protein name | Accession number | M r (kDa) | pI | Protein score | Sequence coverage (%) | Best ion score | Spot volume (p.p.m.) | Fold difference | |
|---|---|---|---|---|---|---|---|---|---|---|
| Control (mean ± SD) | GTS‐treated (mean ± SD) | |||||||||
| 1 | Eukaryotic translation initiation factor 5A | 54037409 | 16.7 | 5.08 | 122 | 35 | 41 | 994.2 ± 107.3 | 435.0 ± 64.6 | 0.44 |
| 2 | ATP synthase F0 subunit d | 5453559 | 18.5 | 5.21 | 74 | 18 | 37 | 1040.0 ± 114.8 | 480.0 ± 78.6 | 0.46 |
| 3 | Peroxiredoxin 2 | 77744389 | 22.0 | 5.66 | 105 | 14 | 53 | 1071.6 ± 172.1 | 388.7 ± 65.2 | 0.36 |
| 4 | 14‐3‐3 β/α | 1345590 | 28.1 | 4.76 | 135 | 60 | 87 | 1025.0 ± 166.6 | 465.1 ± 115.1 | 0.45 |
| 5 | Ran‐binding protein 1 | 938026 | 23.2 | 5.19 | 78 | 13 | 38 | 317.4 ± 42.1 | 1088.0 ± 194.4 | 3.43 |
| 6 | Enoyl coenzyme A hydratase, short chain,1, mitochondrial | 14286220 | 31.4 | 8.34 | 122 | 16 | 96 | 607.7 ± 53.6 | 139.5 ± 19.1 | 0.23 |
| 7 | Proteasome α 1 subunit isoform 1 | 23110935 | 30.2 | 6.51 | 112 | 24 | 41 | 661.2 ± 53.9 | 197.3 ± 14.6 | 0.30 |
| 8 | Lactate dehydrogenase B | 4557032 | 36.6 | 5.71 | 191 | 30 | 31 | 838.6 ± 124.2 | 111.5 ± 9.8 | 0.13 |
| 9 | cytokeratin 19 | 24234699 | 44.1 | 5.04 | 96 | 34 | 64 | 1191.5 ± 265.9 | 567.1 ± 137.2 | 0.38 |
| 10 | Protease inhibitor 6 | 20141722 | 42.6 | 5.18 | 223 | 34 | 68 | 587.4 ± 123.5 | 225.0 ± 37.0 | 0.38 |
| 11 | Tryptophanyl‐tRNA synthetase | 135191 | 53.2 | 5.83 | 90 | 22 | 36 | 1370.3 ± 304.2 | 439.7 ± 93.9 | 0.32 |
| 12 | Serine/threonine‐protein phosphatase 2A 65 kDa regulatory subunit A α isoform | 21361399 | 65.2 | 5.00 | 86 | 14 | 38 | 1265.0 ± 254.2 | 479.0 ± 115.9 | 0.38 |
| 13 | Tumor‐rejection antigen 1 | 4507677 | 92.5 | 4.76 | 427 | 25 | 56 | 1482.0 ± 150.1 | 731.6 ± 75.5 | 0.49 |
| 14 | Ku80 | 15825665 | 71.2 | 5.71 | 122 | 17 | 37 | 365.5 ± 74.7 | 67.8 ± 16.5 | 0.19 |
Confirmation of the proteomic results by western blotting. Western blotting was used to assess the expression of Ku80, eIF5A, and 14‐3‐3 β/α in HeLa cells treated with GTS, DOX, or a combination of GTS and DOX (Fig. 5). Consistent with the proteomic results, the protein levels of eIF5A, 14‐3‐3 β/α, and Ku80 were found to be downregulated in GTS‐treated HeLa cells compared with the control. DOX showed no effect on the expression of eIF5A or 14‐3‐3β/α but showed a weak decreasing effect on the level of Ku80. In cells treated with a combination of GTS and DOX, the level of Ku80 was further decreased whereas the levels of eIF5A and 14‐3‐3 β/α were similar to those in GTS‐treated cells (Fig. 5).
Figure 5.
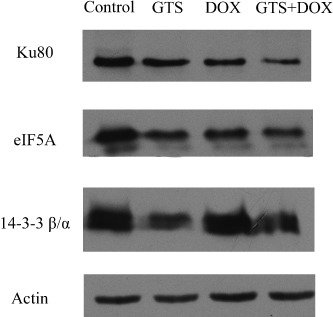
Western blotting of Ku80, eIF5A, and 14‐3‐3 β/α. Control, Ganoderma triterpenes (GTS), doxorubicin (DOX), and GTS + DOX marked above the panel represent the control cells and cells treated with 15 µg/mL GTS, 20 nM DOX, or a combination of 15 µg/mL GTS and 20 nM DOX for 48 h. The detected protein is shown to the left of each blot. Each blot is the representative result of three independent experiments.
Cell cycle arrest and apoptosis in HeLa cells treated with GTS, DOX, or the combination of GTS and DOX. The representative DNA histograms of HeLa cells exposed to GTS, DOX, or the combination of GTS and DOX were shown in Figure 6. The flow cytometry results suggested that GTS induced weak G0–G1 cell cycle arrest whereas DOX induced G2–M cell cycle arrest in HeLa cells. For the combination of GTS and DOX, the result was dependent on the dose of DOX. For lower doses of DOX such as 20 nM, the effect of the combination of GTS and DOX was similar to that of DOX, that is, G2–M cell cycle arrest. For higher doses of DOX such as 100 nmol/L, interestingly, the combination of GTS and DOX induced neither G0–G1 arrest nor G2–M arrest. However, at the same time, the percentage of cells that underwent apoptosis increased (Fig. 6). Because the cells treated with a high dose of DOX showed almost total cell cycle arrest at G2–M phase, it is possible that combined use with GTS induced the cell cycle‐blocked cells to undergo apoptosis. For the few cells that remained alive, there was almost no cell cycle arrest at any specific phase. Our result was similar to a previous report about the synergistic effect between 8‐Cl‐cAMP and sulfinosine.( 31 ) It was reported that 8‐Cl‐cAMP arrested the cells in G0–G1 phase and sulfinosine blocked cell cycle progression at G2–M stage, whereas the combination of the two agents did not arrest growth at any particular phase of the cell cycle. Also, the combination of 8‐Cl‐cAMP and sulfinosine caused an increase in apoptotic cells.( 31 )
Figure 6.
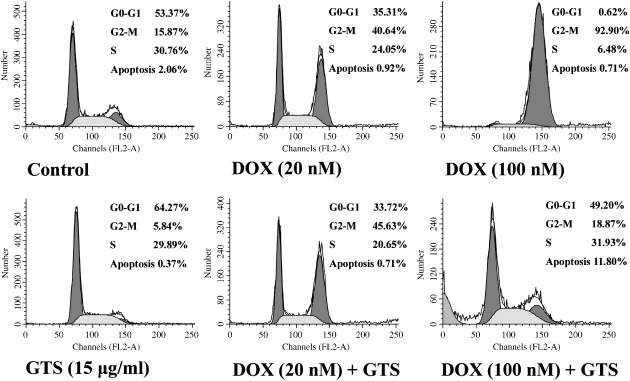
DNA histograms of HeLa cells obtained by flow cytometric analysis. Cells were treated with solvent control, 15 µg/mL Ganoderma triterpenes (GTS), 20 nM doxorubicin (DOX), 100 nM DOX, the combination of 15 µg/mL GTS and 20 nM DOX, or the combination of 15 µg/mL GTS and 100 nM DOX for 48 h, respectively. Representative results of three independent experiments are shown.
Ganoderma triterpenes enhanced DOX‐induced intracellular ROS production. After being treated with GTS, DOX, or the combination of GTS and DOX for 3 or 10 h, the intracellular ROS levels of HeLa cells were checked. As shown in Figure 7, after 3 h treatment, GTS (50 µg/mL) and DOX (1 and 10 µmol/L) significantly increased the intracellular ROS levels of cells. More interestingly, the combination of DOX with GTS enhanced the ROS production induced by DOX. The ROS levels in cells treated with combinations of DOX at 0.1, 1, and 10 µmol/L with GTS for 3 h were significantly higher than those of cells treated only with DOX at 0.1, 1, and 10 µmol/L, respectively. A similar trend was observed in cells that underwent 10 h of treatment, although the difference between the combination and DOX groups was only significant for DOX at 1 µmol/L.
Figure 7.
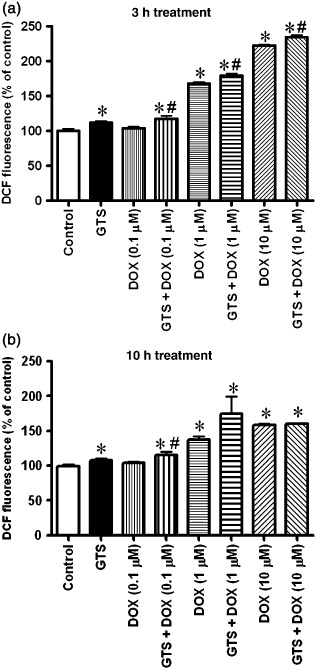
Intracellular reactive oxygen species levels (DCF fluorescence) of HeLa cells treated with Ganoderma triterpenes (GTS) (50 µg/mL), doxorubicin (DOX) (0.1, 1 or 10 µM), or a combination of GTS and DOX. Data are shown as the mean ± SEM. *P < 0.05 significant difference compared with control; #P < 0.05 significant difference when the combination GTS and DOX groups were compared with the DOC group at a corresponding dose.
Effect of a ROS scavenger on the cytotoxicity of GTS, DOX, and the combination of GTS and DOX. The effect of a ROS scavenger on the cytotoxicity of GTS, DOX, and the combination of GTS and DOX is shown in Figure 8. As shown in Figure 8, the use of the ROS scavenger N‐acetyl cysteine caused a decrease in the cytotoxicity of GTS as well as DOX. In particular, the cytotoxicity of GTS was strongly decreased. The CI values of the combinations of GTS and DOX indicated that the synergism between GTS and DOX almost disappeared (Fig. 8). These results suggested that ROS production is involved in the cytotoxicity of GTS, DOX, and the combination of GTS and DOX.
Figure 8.
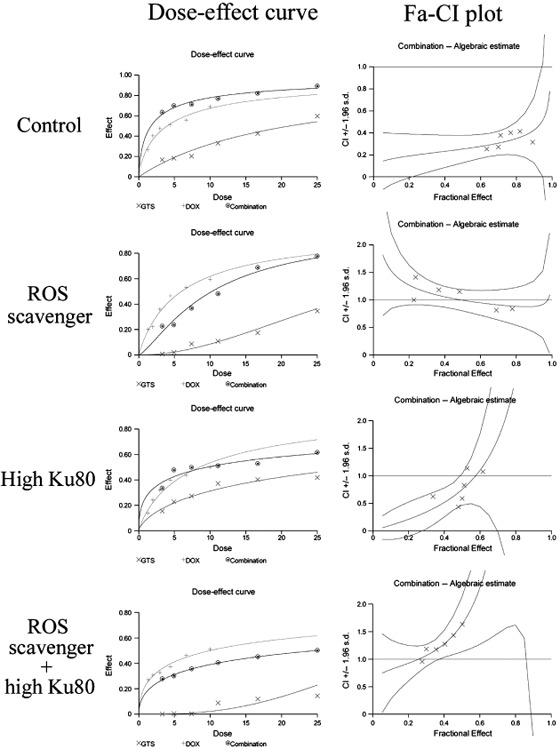
The interaction of Ganoderma triterpenes (GTS) with doxorubicin (DOX) in HeLa cells treated with reactive oxygen species (ROS) scavenger, cells with high Ku80 expression, or cells with high Ku80 expression plus treatment with ROS scavenger. Both the dose–effect curves and the combination index (CI) values were shown.
Effect of high Ku80 expression on the cytotoxicity of GTS, DOX, and the combination of GTS and DOX. The expression of Ku80 protein in cells transfected with pcDNA3VSV plasmid encoding full‐length human Ku80 cDNA was checked using western blotting. As showed in Figure 9, the Ku80 protein level in plasmid‐transfected cells was higher than that of wild‐type cells. The cytotoxicity assay using these transfected cells (Fig. 8) indicated that high Ku80 expression ameliorated the cytotoxicity of GTS as well as DOX. The CI values of the combinations of GTS and DOX showed that the synergism between GTS and DOX was only seen with some, but not all, of the combination doses (Fig. 8). The decreased cytotoxicity of DOX in cells with high Ku80 expression was consistent with a previous report that showed that the increased expression of DNA‐dependent protein kinase causes resistance to adriamycin.( 32 )
Figure 9.
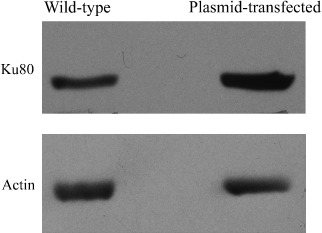
The expression of Ku80 protein in wild‐type cells and cells transfected with plasmid encoding full‐length human Ku80 cDNA. Cells transfected with plasmid showed a high expression level of Ku80 protein. Each blot is the representative result of three independent experiments.
Effect of a ROS scavenger and high Ku80 expression on the cytotoxicity of GTS, DOX, and the combination of GTS and DOX. As shown in Figure 8, combined use of ROS scavenger and cells with high Ku80 expression caused a strong decrease in the cytotoxicity of GTS and DOX and caused the total disappearance of synergism between GTS and DOX.
Discussion
Garnoderma lucidum (Lingzhi) is a highly appreciated traditional Chinese medicine, and the extract of G. lucidum has been used widely in China for adjuvant cancer therapy. Consistent with previous reports,( 18 , 19 , 20 , 21 ) GTS and the purified compound LCN both showed weak cytotoxicity against HeLa cells in the present study. More importantly, the present study showed that there were synergistic effects when GTS or LCN was used in combination with DOX in HeLa cells.
To understand the mechanism of cytotoxicity of GTS as well as its synergism with DOX, we checked the possible molecular targets of GTS in HeLa cells using a proteomic method. Our proteomic study found 14 proteins with regulated expression levels in GTS‐treated cells compared with the control. Previous reports suggested that these proteins play important roles in cell proliferation, cell cycle progression, apoptosis, and sensitization of cells to chemotherapeutics.
The proteins eIF5A and tryptophanyl‐tRNA synthetase are important factors in protein synthesis. eIF5A is a small (16–18 kDa) abundant protein that is highly conserved in eukaryotes. It is the only known cellular protein with an unusual post‐translational modification on a specific lysine residue that forms hypusine. A number of studies have indicated that downregulation or inhibition of hypusine synthesis impedes cancer cell growth and eIF‐5A can be taken as a target of anticancer strategies.( 33 , 34 ) Protein tryptophanyl‐tRNA synthetase is one of the important constituents of the early stages of the protein synthesis machinery, which catalyzes the first step of protein synthesis. Downregulation of eIF5A and tryptophanyl‐tRNA synthetase expression by GTS treatment may cause inhibition of protein synthesis as well as cell proliferation in HeLa cells.
The proteins 14‐3‐3 β/α and Ran‐binding protein 1 play important roles in cell cycle progression. 14‐3‐3 β/α belongs to the 14‐3‐3 protein family, which is involved in many different cellular processes, including mitogenesis, cell cycle control, and apoptosis.( 35 ) Ran‐binding protein 1 is a molecular partner of Ran GTPase. By regulating the transport of protein and nucleic acids across the nuclear membrane, it is implicated in the control of several processes, including DNA replication, mitotic entry and exit, cell cycle progression, nuclear structure, protein import, and RNA export.( 36 ) In particular, Ran‐binding protein 1 levels are cell cycle regulated in mammalian cells. Both overexpression and downregulation of Ran‐binding protein 1 cause mistakes in cell cycle progression. For example, overexpression of Ran‐binding protein 1 throughout the cell cycle yields abnormal mitoses characterized by severe defects in spindle polarization.( 37 ) Downregulation of 14‐3‐3 β/α expression and upregulation of Ran‐binding protein 1 expression by GTS treatment may cause cell cycle arrest in HeLa cells.
The proteins PP2A subunit A and proteasome α 1 subunit isoform 1 play important roles in apoptosis. PP2A subunit A is a subunit of PP2A, which is essential for cell survival, cell cycle regulation, DNA damage response, and embryonic development.( 38 ) Importantly, recent reports have suggested that PP2A is a critical regulator of BCL‐2 stability. PP2A‐mediated dephosphorylation of BCL‐2 might be required to protect BCL‐2 from proteasome‐dependent degradation. Knockdown or pharmacological inhibition of PP2A causes degradation of phosphorylated BCL‐2 and leads to an overall reduction in BCL‐2 levels.( 39 ) Protein proteasome α 1 subunit isoform 1 is an important subunit of proteasomes, which have essential functions in carcinogenesis. Proteasome inhibitors have effective antitumor activity in cell culture, inducing apoptosis by disrupting the regulated degradation of pro‐growth cell cycle proteins.( 40 ) Downregulation of PP2A subunit A expression and proteasome α 1 subunit isoform 1 expression by GTS treatment may induce apoptosis in HeLa cells.
The proteins PRDX2, chain B of the Ku heterodimer (Ku80), and cytokeratin 19 play important roles in sensitization of HeLa cells to chemotherapeutics. PRDX2 belongs to the peroxiredoxin family whose major role is to control the constitutive level of H2O2 in cells and thus protect cells against ROS‐induced damage.( 41 ) In HeLa cells, PRDX2 has been found to have dual functions as both a peroxidase and a molecular chaperone. The chaperone function of PRDX2 plays a major role in mediating cytoprotection by conferring apoptotic resistance against oxidative stress in HeLa cells.( 42 ) Ku80 is one chain of the Ku heterodimer. Ku is the DNA‐binding subunit of the DNA‐PK holoenzyme that functions as a DNA‐damage sensor and as a DNA repair complex. The catalytic subunits of the DNA‐dependent protein kinase (DNA‐PKcs) is recruited to DNA double‐strand breaks by the Ku heterodimer to form the core of a multiprotein complex that promotes synapsis of the broken DNA ends.( 43 ) It has been found that a decrease in the level of Ku can increase the response of cancer cells to DNA‐damaging agents.( 44 ) The protein cytokeratin 19 is an intermediate filament protein associated with the integrity of cell structure, and its elevated expression has been reported to correlate with the disease progression of cancers. In cervical cancer cells like HeLa cells, the functional role of cytokeratin‐19 was shown to be associated with apoptosis prevention and the drug resistance of cells. For example, a reduced cellular cytokeratin‐19 level could also increase the apoptotic rate of HeLa cells treated with chemotherapeutic agents such as cisplatin.( 45 , 46 ) Thus, downregulation of PRDX2, Ku80, and cytokeratin 19 levels by GTS treatment may induce sensitization of HeLa cells to chemotherapeutics that induce oxidative stress, DNA damage, and apoptosis.
Proteins including ATP synthase F0 subunit d, enoyl CoA hydratase chain 1, and LDH B are involved in energy production and utilization. Downregulation of the expression of these proteins may also indirectly contribute to the inhibition of cell proliferation by GTS. However, the roles of protein protease inhibitor 6 and tumor rejection antigen 1 in the cytotoxicity of GTS are not clear.
In summary, our proteomic study suggests that GTS might inhibit cell proliferation by inhibiting protein synthesis, inducing cell cycle arrest and apoptosis, and sensitizing cells to other chemotherapeutics. The effect of GTS on the expression of important proteins found in the proteomic study, such as eIF5A, 14‐3‐3 β/α, and Ku80, was confirmed by western blotting. The predicted effects of GTS on cell cycle progression and apoptosis were also confirmed by flow cytometric analysis. The results of the flow cytometric analysis showed that GTS induces weak G0–G1 cell cycle arrest in HeLa cells. Importantly, combined use of GTS and DOX, which could induce G2–M cell cycle arrest, caused an increase in the percentage of apoptotic cells.
The mechanism of the synergism between GTS and DOX might be predicted as follows. It is well known that DOX exhibits its cytotoxic effect mainly by inhibiting topoisomerase II, which was shown to cause DNA strand breaks. DOX also could induce ROS production, thus causing oxidative stress.( 47 ) So, the synergism between GTS and DOX might be, at least partly, based on: (1) enhancement of DOX‐induced oxidative stress by GTS; and (2) sensitization of cells to DOX‐induced DNA strand breaks by GTS through inhibition of the DNA excision repair system (regulating proteins such as Ku80). In the present study, to confirm our prediction of the enhancing effect of GTS on the intracellular ROS production induced by DOX, we checked the intracellular ROS levels of cells treated with GTS, DOX, or combinations of GTS and DOX. The results showed that GTS could significantly enhance DOX‐induced ROS production in HeLa cells. Furthermore, ROS scavenger treatment ameliorated the cytotoxicity of GTS as well as DOX and affected the synergism between GTS and DOX. These results confirmed the involvement of ROS production in the cytotoxicity of GTS, DOX, and the combination of GTS and DOX. To confirm the role of Ku80 in the synergism between GTS and DOX, we transfected cells with a plasmid encoding full‐length human Ku80 cDNA to obtain cells with high Ku80 expression and then used these cells to check the cytotoxicity of GTS, DOX, and the combination of GTS and DOX. The results indicate that high Ku80 expression caused a decrease in the cytotoxicity of DOX as well as GTS, and caused a disappearance of synergism between DOX and GTS at some dose combinations. More importantly, co‐use of a ROS scavenger and cells with high Ku80 expression caused a total disappearance of the synergism between GTS and DOX. Our results supported our prediction about the possible mechanism of synergism between GTS and DOX and also suggested that more than one factor is involved in the synergism.
To conclude, this study is the first, to our knowledge, to strictly evaluate the interactions between GTS and the chemotherapeutic regent DOX, which was popularly used in clinics for cancer therapy. The synergism between GTS and DOX supports the traditional use of G. lucidum as a complementary treatment for cancer therapy. Furthermore, the results of our research suggest that GTS might sensitize cells to chemotherapeutics by enhancing oxidative stress, DNA damage, and apoptosis.
Acknowledgments
This work was supported in part by grants from the National Natural Science Foundation of China (30701077), the Science and Technology commission of Shanghai Municipality (06DZ19731), and the Shanghai Pudong Science and Technology Committee (PKJ2006‐L07).
References
- 1. Yun TK. Update from Asia. Asian studies on cancer chemoprevention. Ann NY Acad Sci 1999; 889: 157–92. [DOI] [PubMed] [Google Scholar]
- 2. Sliva D. Cellular and physiological effects of Ganoderma lucidum (Reishi). Mini-Rev Med Chem 2004; 4: 873–9. [DOI] [PubMed] [Google Scholar]
- 3. Sliva D. Ganoderma lucidum in cancer research. Leuk Res 2006; 30: 767–8. [DOI] [PubMed] [Google Scholar]
- 4. Yuen JW, Gohel MD. Anticancer effects of Ganoderma lucidum: a review of scientific evidence. Nutr Cancer 2005; 53: 11–17. [DOI] [PubMed] [Google Scholar]
- 5. Chen X, Hu ZP, Yang XX et al . Monitoring of immune responses to a herbal immuno‐modulator in patients with advanced colorectal cancer. Int Immunolpharmacol 2006; 6: 499–508. [DOI] [PubMed] [Google Scholar]
- 6. Gao Y, Gao H, Chan E et al . Antitumor activity and underlying mechanisms of ganopoly, the refined polysaccharides extracted from Ganoderma lucidum, in mice. Immunol Invest 2005; 34: 171–98. [PubMed] [Google Scholar]
- 7. Hu H, Ahn NS, Yang X, Lee YS, Kang KS. Ganoderma lucidum extract induces cell cycle arrest and apoptosis in MCF‐7 human breast cancer cells. Int J Cancer 2002; 102: 250–3. [DOI] [PubMed] [Google Scholar]
- 8. Jiang J, Slivova V, Harvey K, Valachovicova T, Sliva D. Ganoderma lucidum suppresses growth of breast cancer cells through the inhibition of Akt/NF‐κB signaling. Nutr Cancer 2004; 49: 209–16. [DOI] [PubMed] [Google Scholar]
- 9. Jiang J, Slivova V, Valachovicova T, Harvey K, Sliva D. Ganoderma lucidum inhibits proliferation and induces apoptosis in human prostate cancer cells PC‐3. Int J Oncol 2004; 24: 1093–100. [PubMed] [Google Scholar]
- 10. Kim KC, Kim JS, Son JK, Kim IG. Enhanced induction of mitochondrial damage and apoptosis in human leukemia HL‐60 cells by the Ganoderma lucidum and Duchesnea chrysantha extracts. Cancer Lett 2007; 246: 210–17. [DOI] [PubMed] [Google Scholar]
- 11. Lu QY, Jin YS, Zhang Q et al . Ganoderma lucidum extracts inhibit growth and induce actin polymerization in bladder cancer cells in vitro . Cancer Lett 2004; 216: 9–20. [DOI] [PubMed] [Google Scholar]
- 12. Muller CI, Kumagai T, O’Kelly J, Seeram NP, Heber D, Koeffler HP. Ganoderma lucidum causes apoptosis in leukemia, lymphoma and multiple myeloma cells. Leuk Res 2006; 30: 841–8. [DOI] [PubMed] [Google Scholar]
- 13. Xie JT, Wang CZ, Wicks S et al . Ganoderma lucidum extract inhibits proliferation of SW480 human colorectal cancer cells. Exp Oncol 2006; 28: 25–9. [PubMed] [Google Scholar]
- 14. Johnston N. Medicinal mushroom cuts off prostate cancer cells’ blood supply. Drug Discov Today 2005; 10: 1584. [DOI] [PubMed] [Google Scholar]
- 15. Slivova V, Valachovicova T, Jiang J, Sliva D. Ganoderma lucidum inhibits invasiveness of breast cancer cells. J Cancer Integr Med 2004; 2: 25–30. [Google Scholar]
- 16. Stanley G, Harvey K, Slivova V, Jiang J, Sliva D. Ganoderma lucidum suppresses angiogenesis through the inhibition of secretion of VEGF and TGF‐β1 from prostate cancer cells. Biochem Biophys Res Commun 2005; 330: 46–52. [DOI] [PubMed] [Google Scholar]
- 17. Yeung WH, Lu QL, Zhang Q, Go VLW. Chemical and biochemical basis of the potential anti‐tumor properties of Ganoderma lucidum . Curr Top Nutraceut Res 2004; 2: 67–77. [Google Scholar]
- 18. Kimura Y, Taniguchi M, Baba K. Antitumor and antimetastatic effects on liver triterpenoid fractions of Ganoderma lucidum: mechanism of action and isolation of active substance. Anticancer Res 2002; 22: 3309–18. [PubMed] [Google Scholar]
- 19. Lin SB, Li CH, Lee SS, Kan LS. Triterpene‐enriched extracts from Ganoderma lucidum inhibit growth of hepatoma cells via suppressing protein kinase C, activating mitogen‐activated protein kinases and G2‐phase cell cycle arrest. Life Sci 2003; 72: 2381–90. [DOI] [PubMed] [Google Scholar]
- 20. Min BS, Gao JJ, Nakamura N, Hattori M. Triterpenes from the spores of Ganoderma lucidum and their cytotoxicity against meth‐A and LLC tumor cells. Chem Pharm Bull 2000; 48: 1026–33. [DOI] [PubMed] [Google Scholar]
- 21. Yang HL. Ganoderic acid produced from submerged culture of Ganoderma lucidum induces cell cycle arrest and cytotoxicity in human hepatoma cell line BEL7402. Biotechnol Lett 2005; 27: 835–8. [DOI] [PubMed] [Google Scholar]
- 22. Wu TS, Shi LS, Kuo SC. Cytotoxicity of Ganoderma lucidum triterpenes. J Nat Prod 2001; 64: 1121–2. [DOI] [PubMed] [Google Scholar]
- 23. Liu X, Fan XL, Zhao Y et al . Estrogen provides neuroprotection against activated microglia‐induced dopaminergic neuronal injury through both estrogen receptor‐α and estrogen receptor‐β in microglia. J Neurosci Res 2005; 81: 653–65. [DOI] [PubMed] [Google Scholar]
- 24. Chou TC, Talalay P. Analysis of combined drug effects: a new look at a very old problem. Trends Pharmacol Sci 1983; 4: 450–4. [Google Scholar]
- 25. Ma C, Guan SH, Yang M, Liu X, Guo DA. Differential protein expression in mouse splenic mononuclear cells treated with polysaccharides from spores of Ganoderma lucidum . Phytomedicine 2008; 15: 268–76. [DOI] [PubMed] [Google Scholar]
- 26. Shen H, Cheng G, Fan H et al . Expressed proteome analysis of human hepatocellular carcinoma in nude mice (LCI‐D20) with high metastasis potential. Proteomics 2006; 6: 528–37. [DOI] [PubMed] [Google Scholar]
- 27. Liu X, Zhu XZ. Roles of p53, c‐Myc, Bcl‐2, Bax and caspases in glutamate‐induced neuronal apoptosis and the possible neuroprotective mechanism of basic fibroblast growth factor. Brain Res Mol Brain Res 1999; 71: 210–16. [DOI] [PubMed] [Google Scholar]
- 28. Wang H, Joseph JA. Quantifying cellular oxidative stress by dichlorofluorescein assay using microplate reader. Free Rad Biol Med 1999; 27: 612–16. [DOI] [PubMed] [Google Scholar]
- 29. Shih SF, Wu YH, Hung CH, Yang HY, Lin JY. Abrin triggers cell death by inactivating a thiol‐specific antioxidant protein. J Biol Chem 2001; 276: 21 870–7. [DOI] [PubMed] [Google Scholar]
- 30. Fang L, Du Wang YD, Yang G et al . Cell polarity protein Par3 complexes with DNA‐PK via Ku70 and regulates DNA double‐strand break repair. Cell Res 2007; 17: 100–16. [DOI] [PubMed] [Google Scholar]
- 31. Jankovic D, Pesic M, Markovi J et al . The combination of sulfinosine and 8‐Cl‐cAMP induces synergistic cell growth inhibition of the human neuroblastoma cell line in vitro . Invest New Drugs 2006; 24: 15–25. [DOI] [PubMed] [Google Scholar]
- 32. Shen H, Schultz M, Kruh GD, Tew KD. Increased expression of DNA‐dependent protein kinase confers resistance to adriamycin. Biochim Biophys Acta 1998; 1381: 131–8. [DOI] [PubMed] [Google Scholar]
- 33. Caraglia M, Budillon A, Vitale G, Lupoli G, Tagliaferri P, Abbruzzese A. Modulation of molecular mechanisms involved in protein synthesis machinery as a new tool for the control of cell proliferation. Eur J Biochem 2000; 267: 3919–36. [DOI] [PubMed] [Google Scholar]
- 34. Caraglia M, Marra M, Giuberti G et al . The role of eukaryotic initiation factor 5A in the control of cell proliferation and apoptosis. Amino Acids 2001; 20: 91–104. [DOI] [PubMed] [Google Scholar]
- 35. Hermeking H, Benzinger A. 14‐33 proteins in cell cycle regulation. Semin Cancer Biol 2006; 16: 183–92. [DOI] [PubMed] [Google Scholar]
- 36. Battistoni A, Guarguaglini G, Degrassi F et al . Deregulated expression of the RanBP1 gene alters cell cycle progression in murine fibroblasts. J Cell Sci 1997; 110: 2345–57. [DOI] [PubMed] [Google Scholar]
- 37. Guarguaglini G, Renzi L, D’Ottavio F et al . Regulated Ran‐binding protein 1 activity is required for organization and function of the mitotic spindle in mammalian cells in vivo . Cell Growth Differ 2000; 11: 455–65. [PubMed] [Google Scholar]
- 38. Janssens V, Goris J. Protein phosphatase 2A: a highly regulated family of serine/threonine phosphatases implicated in cell growth and signaling. Biochem J 2001; 353: 417–39. [DOI] [PMC free article] [PubMed] [Google Scholar]
- 39. Lin SS, Bassik MC, Suh H et al . PP2A regulates BCL‐2 phosphorylation and proteasome mediated degradation at the endoplasmic reticulum. J Biol Chem 2006; 281: 23 003–12. [DOI] [PubMed] [Google Scholar]
- 40. Adams J, Palombella VJ, Sausville EA et al . Proteasome inhibitors: a novel class of potent and effective antitumor agents. Cancer Res 1999; 59: 2615–22. [PubMed] [Google Scholar]
- 41. Chevallet M, Wagner E, Luche S, Dorsselaer A, Leize‐Wagner E, Rabilloud T. Regeneration of peroxiredoxins during recovery after oxidative stress. J Biol Chem 2003; 278: 37 146–53. [DOI] [PubMed] [Google Scholar]
- 42. Moon JC, Hah YS, Kim WY et al . Oxidative stress‐dependent structural and functional switching of a human 2‐Cys peroxiredoxin isotype II that enhances HeLa cell resistance to H2O2‐induced cell death. J Biol Chem 2005; 280: 28 775–84. [DOI] [PubMed] [Google Scholar]
- 43. Spagnolo L, Rivera‐Calzada A, Pearl LH, Llorca O. Three‐dimensional structure of the human DNA‐PKcs/Ku70/Ku80 complex assembled on DNA and its implications for DNA DSB repair. Mol Cell 2006; 22: 511–19. [DOI] [PubMed] [Google Scholar]
- 44. Ayene IS, Ford LP, Koch CJ. Ku protein targeting by Ku70 small interfering RNA enhances human cancer cell response to topoisomerase II inhibitor and γ radiation. Mol Cancer Ther 2005; 4: 529–36. [DOI] [PubMed] [Google Scholar]
- 45. Yuan CC, Huang HC, Tsai LC, Ng HT, Huang TS. Cytokeratin‐19 associated with apoptosis and chemosensitivity in human cervical cancer cells. Apoptosis 1997; 2: 101–5. [DOI] [PubMed] [Google Scholar]
- 46. Yuan CC, Huang TS, Ng HT, Liu RS, Hung MW, Tsai LC. Elevated cytokeratin‐19 expression associated with apoptotic resistance and malignant progression of human cervical carcinoma. Apoptosis 1998; 3: 161–9. [DOI] [PubMed] [Google Scholar]
- 47. Torsten RD, Inga W, Manuela B, Gerhard F, Bernd K. Resistance of p53 knockout cells to doxorubicin is related to reduced formation of DNA strand breaks rather than impaired apoptotic signaling. DNA Repair 2003; 2: 49–60. [DOI] [PubMed] [Google Scholar]