

Abstract
We examined the effects of CCL1, CCL2, CCL12 and CCL21 on the expression of adhesion molecules in cultured human lymphatic endothelial cells using immunohistochemical staining or Western blot analysis. In addition, we investigated whether the expressed adhesion molecule was able to facilitate the attachment of carcinoma cells to the lymphatic endothelial cells as an in vitro micrometastatic model. CCL2 caused a selective and significant expression of ICAM‐1 on human lymphatic endothelial cells but CCL1, CCL12 and CCL21 did not. By increasing the stimulation time from 4 to 18 and 48 h, the intensity of immunoreactivity for ICAM‐1 was significantly increased in a time‐dependent manner up to 18 h. The ICAM‐1 mRNA levels were also elevated significantly up to 18 h. The CCL2‐mediated immunohistochemical expression of ICAM‐1 was dose‐dependently increased from 10 pg/mL to 1 ng/mL. The CCL2‐mediated expression of ICAM‐1 was significantly reduced by neutralization of CCL2 using a specific CCL2 antibody. The 18‐h treatment with CCL2 caused a significant facilitation of in vitro attachment of MDA‐MB‐231 and MCF‐7 cells to the lymphatic endothelial cells (LECs). The CCL2‐mediated response in the attachment assay was also significantly reduced either by the neutralization of CCL2 or by additional treatment with anti‐ICAM‐1 antibody. Immunohistochemical expression of ICAM‐1, but not E‐selectin, was strongly observed around and within the metastatic region of sentinel lymph node isolated from breast cancer patients. These findings suggest that CCL2 induces selective and significant expression of ICAM‐1 on cultured human lymphatic endothelial cells and then facilitates the attachment of carcinoma cells to the lymphatic endothelial cells, thus providing an in vitro micrometastatic model via the overexpression of ICAM‐1. (Cancer Sci 2009; 100: 419–428)
Chemokines are soluble, small molecular‐weight proteins that bind to their cognate G‐protein coupled receptors to elicit cellular responses, usually directional migration or chemotaxis.( 1 , 2 ) Tumor cells secrete and respond to chemokines, which facilitate the tumor growth that is achieved by increased endothelial cell recruitment, subversion of immunological surveillance, and maneuvering of the tumoral leukocyte chemokine profile to skew it (immunoediting) such that the chemokines released enable tumor growth and metastasis to distant sites. Thus, the CXCL12–CXCR4 axis facilitates metastasis to distant organs, and the CCL21–CCR7 pair favors metastasis to lymph nodes. These two chemokine ligand–receptor systems are key mediators of tumor cell metastasis for several malignancies and as such provide key targets for chemotherapy.( 2 , 3 )
Recently, the concept of sentinel lymph node (SLN), which is the first node in the lymphatic network draining the primary tumor, has been proposed by mapping of regional lymph nodes using radioisotopes or dye. The SLN is the presumptive initial site of lymphatic micrometastasis of carcinoma cells. The clinical importance of SLN has been proven in many breast cancer patients.( 4 ) However, the biological and histological properties of the lymphatic endothelial cells (LECs) in the SLN that interact with micrometastatic carcinoma cells remain unclear. It has also become known that primary tumors influence the microenvironment of tumor tissues before metastasis.( 5 , 6 ) However, it is unclear which molecules in the premetastatic SLN develop a suitable environment for the micrometastasis that is related to the attachment of carcinoma cells to LECs.
Therefore, we have attempted to examine the effects of various kinds of chemokines on the expression of adhesion molecules on cultured human LECs located in the nearest afferent lymph vessels of the SLN, and then investigate whether the expressed adhesion molecules are able to facilitate the attachment of carcinoma cells to the LECs. In addition, we studied the immunohistochemical expression of adhesion molecules on frozen tissues of SLNs isolated freshly from breast cancer patients.
Materials and Methods
Cell culture. Isolation and culture of human LECs were performed using the technique of Kawai et al.( 7 , 8 ) and the nearest afferent lymph vessels of the SLN in patients with breast cancer. The LECs were maintained in EGM‐2 with 10% fetal bovine serum (FBS) and used at the fifth to seventh passage. The LECs were incubated under atmospheric condition of 5% O2, 5% CO2 and 90% N2 at 37°C. The experimental protocols were approved by the ethical committee for human studies in the School of Medicine, Shinshu University, Japan. All subjects were informed of the risks and purposes of the studies before their written consents were obtained.
The human breast adenocarcinoma cell lines, MDA‐MB‐231 and MCF‐7, were purchased from the American Type Culture Collection (Manassas, VA, USA). The carcinoma cells were maintained in Dulbecco's modified Eagle's medium/Nutrient Mixture F12 Ham (DMEM/F12) culture medium supplemented with 10% FBS. The carcinoma cells were incubated under normoxic conditions of 21% O2, 5% CO2 and 74% N2 at 37°C.
Immunohistochemistry. Immunohistochemistry was performed on cultured human lymphatic endothelial cells (LECs) or fresh‐frozen sentinel lymph nodes (SLNs) isolated from breast cancer patients. In brief, the cultured LECs were fixed with 10% formalin in phosphate‐buffered saline solution (PBS) at room temperature. The cells were incubated for 4 h at room temperature with primary polyclonal antisera platelet–endothelial cell adhesion molecule (PECAM)‐1 (dilution 1:100, BD Biosciences, Franklin Lakes, NJ, USA), lymphatic vessel endothelial hyaluronan receptor (LYVE)‐1 (dilution 1:50, RELIATech, Braunschweig, Germany), Prox‐1 (dilution 1:50, AngioBio, Del Mar, CA, USA), podoplanin (dilution 1:50, AngioBio), vascular endothelium growth factor receptor 3 (VEGF R3) (dilution 1:50, Santa Cruz, Santa Cruz, CA, USA), E‐selectin/CD62E (dilution 1:50, R & D Systems, Minneapolis, MN, USA), P‐selectin/CD62P (dilution 1:50, R & D Systems), vascular cell adhesion molecule (VCAM)‐1/CD106 (dilution 1:50, R & D Systems), and intercellular adhesion molecule (ICAM)‐1/CD54 (dilution 1:50, R & D Systems). Before staining, permeabilization of the cultured cells with 0.1% Triton‐X was performed. Then, the cells were stained using the following antibodies: Alexa Fluor 488 chicken antirabbit IgG or Alexa Fluor 488 donkey antimouse IgG (Invitrogen, Carlsbad, CA, USA). The nuclei of cultured cells were counterstained and mounted with ProLong Gold antifade reagent with 4′‐6‐diamidine‐2‐phenylindole (DAPI) (Molecular Probes). The cultured cells were examined by a fluorescent microscope (Leica, Wetzlar, Germany) and photographed.
On the other hand, the fresh‐frozen SLNs tissues were fixed with 100% acetone at 4°C. Endogenous peroxidase activity was blocked with 0.3% H2O2 for 30 min at room temperature. The tissues were incubated for 1 h at room temperature with primary polyclonal antisera E‐selectin (R & D Systems) and ICAM‐1 (R & D Systems) and then for 30 min at room temperature with horseradish peroxidase‐labeled antirabbit IgG and antimouse IgG (Nichirei, Tokyo, Japan). The reaction product was developed using the DAB kit (Nichirei). The nuclei of the SLN tissues were also counter stained using hematoxylin staining. The SLN tissues were examined by a light microscope (Leica) and photographed.
To examine the effects of chemokines on the immunohistochemical expression of adhesion molecules on the LECs, the starvation culture medium was exchanged for 1 mL of EBM‐2 with 3% FBS containing various concentrations of chemokines and then stimulated the human LECs for 4, 18 or 48 h. The various concentrations of chemokines were constructed by diluting each chemokine with appropriate volumes of EBM‐2 with 3% FBS.
In some experiments, the effects of 10 ng/mL CCL2 on the immunohistochemical expression of ICAM‐1 on the human LECs were also evaluated using the same procedure as above, after overnight neutralization of CCL2 in the starvation culture medium with a CCL2‐specific antibody (1.0 µg/mL).
To obtain positive controls of primary antisera to E‐selectin, P‐selectin, VCAM‐1 and ICAM‐1, we examined the effects of 18‐h stimulation of 10 ng/mL tumor necrosis factor (TNF)‐α or 100 ng/mL lipopolysaccharide (LPS) on the immunohistochemical expression of the adhesion molecules on the human LECs.
For non‐specific staining, Block‐ace (Dainippon Sumitomo Pharma, Osaka, Japan) was substituted for primary antisera as a negative control.
To quantitatively examine the immunohistochemical data concerning the expression of ICAM‐1 on the human LECs, the high‐resolution digital microphotographs were processed using the Scion image analysis program. The constant area of each of the LECs was outlined on the gray scale image and processed for density measurement. The results were expressed in arbitrary units (mean density per pixel). The data are shown as mean ± SEM (n = 5).
In vitro human LECs attachment assay. The human LECs were plated to form a monolayer on type I collagen‐coated 35‐mm plates and incubated to confluence in 5% O2, 5% CO2 and 90% N2 at 37°C. The LECs were kept in serum‐starved medium containing EBM‐2 with 3% FBS. Selected plates were treated with 10 ng/mL CCL2 for 18 h. In some experiments, the plates were stimulated by the serum‐starved medium pretreated with overnight neutralization of 10 ng/mL CCL2 with 1.0 µg/mL CCL2‐specific antibody.
In some experiments, the plates were also treated with antihuman ICAM‐1 antibody (R & D Systems) for 30 min after the 18‐h treatment with 10 ng/mL CCL2.
The two kinds of breast cancer cells, MDA‐MB‐231 and MCF‐7, stained with PKH26 fluorescent dye (Sigma, St. Louis, MO, USA) were then plated at 1 × 10⁵ cells per plate and incubated for 30 min at 37°C. Unbound cells were removed by aspiration, and the plates were washed with EBM‐2 three times. The attachment of cancer cells was quantified by counting the number of cells under ×100 magnification using a Leica microscope.
To analyze the immunohistochemical expression of counter receptors/ligands against ICAM‐1 on the breast cancer cells, we evaluated the expressions of LFA‐1 (CD11a) and Mac‐1 (CD11b) on MDA‐MB‐231 and MCF‐7 breast cancer cell lines. The immunohistochemical procedure is the same as that adopted in the studies of the lymph vessel markers (Fig. 1). In the experiment, polyclonal antisera to LFA‐1 (dilution 1:50, AnaSpec, San Jose, CA, USA) and Mac‐1 (dilution 1:50, R & D Systems) were used.
Figure 1.
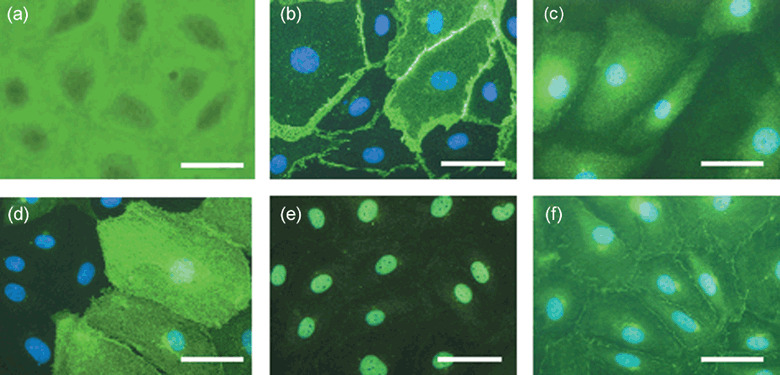
Representative photomicrographs of lymphatic endothelial cell markers such as (b) PECAM‐1, (c) VEGF R3, (d) LYVE‐1, (e) Prox‐1 and (f) podoplanin. (a) Phase‐contrast image of the culture cells. Each marker is 50 µm.
Quantitative RT‐PCR. The 0, 1, 4 and 18‐h expressions of ICAM‐1 mRNA were evaluated by quantitative reverse transcription polymerase chain reaction (RT‐PCR) for ICAM‐1 cDNA. Total RNA was extracted from the cultured human LECs using Isogen reagent (Nippon Gene, Toyama, Japan) according to the manufacturer's instructions. The concentrations of each RNA were calculated using absorbance at 260 nm with a spectrophotometer. The extracted RNA was reverse‐transcribed with M‐MLV reverse transcriptase (Ambion, Austin, TX, USA). For RT‐PCR analysis, each superscript first‐strand synthesis kit (Invitrogen) was used with 1.0 µg of total RNA. Forward and reverse primers of ICAM‐1 and cyclophilin A were used for each specific probe, respectively, as follows: ICAM‐1 (Takara, Kyoto, Japan), and cyclophilin A, 5′‐TTCGTGCTCTGAGCACTGGAG‐3′ (forward) and 5′‐GGACCCGTATGCTTTAGGATGAAG‐3′ (reverse). The cDNA was diluted five‐fold prior to PCR amplification. Quantitative RT‐PCR was performed using a Light Cycler rapid thermal cycler system (Roche Diagnostics, Burgess Hill, UK). Reactions were performed in a 20‐µL volume with 0.5 µM primers, Taq DNA polymerase, and the buffer was included in the SYBR Premix Ex Taq (Takara). The PCR protocol included a 10‐s denaturation step followed by 45 cycles of 95°C denaturation for 5 s and 60°C annealing for 20 s. The fluorescent product was detected at the end of the 60°C extension period. Negative controls included PCR reactions with cDNA omitted. To confirm amplification specificity, PCR products from each primer pair were subjected to melting curve analysis. Data were analyzed with Light Cycler analysis software. The results are presented as normalized ratio of the expression of ICAM‐1 mRNA to cyclophilin A.
Western blot analysis. Western blot analysis was performed to evaluate quantitatively the CCL2‐mediated ICAM‐1 expression on the cultured human LECs. The cells were dissolved in M‐PER Mammalian Protein Extraction Reagent (Thermo Scientific, Rockford, IL, USA), and centrifuged at 14 000 g for 10 min. A 15‐µg sample of total cell lysate was resolved in SDS sample buffer for sodium dodecylsulfate–polyacrylamide gel electrophoresis (SDS‐PAGE) and transferred to an polyvinylidene difluoride (PVDF) membrane (Atto, Tokyo, Japan), where it was incubated for 45 min. The membrane was probed with the anti‐ICAM‐1 antiserum (dilution 1:1000, Cell Signaling Technology, Danvers, MA, USA) and then incubated with antirabbit IgG horseradish peroxidase conjugated antibody. The same membrane was reprobed with monoclonal antiactin antibody (Santa Cruz) and then visualized with an ECL–Western blotting detection system (Amersham Bio Sciences, Cambridge, UK).
Drugs. All salts were obtained from Wako (Tokyo, Japan), and cell chemokines from R & D Systems. The concentration of drugs is expressed as the final concentration in the culture plate.
Statistical analysis. All results are expressed as the mean ± standard error of the mean (SEM). Statistical significance was analyzed by Student's t‐test for unpaired observations. The value of P < 0.05 was considered significant.
Results
Immunohistochemical expression of lymph vessel markers on cultured human LECs. Figure 1 shows representative microphotographs of lymph vessel markers such as VEGF R3 (Fig. 1c), LYVE‐1 (Fig. 1d), Prox‐1 (Fig. 1e) and podoplanin (Fig. 1f) on the cultured cells. The cells were also strongly stained by VEGF R3, Prox‐1, podoplanin and PECAM‐1 (Fig. 1b) antisera. In contrast, the antibody to LYVE‐1 stained weakly only a few of the cultured cells (Fig. 1d). Figure 1(a) shows a representative microphotograph of phase‐contrast images of the cultured cells. The findings suggest that the cultured cells may be human lymphatic endothelial cells (LECs) in nearest afferent lymph vessels of sentinel lymph nodes (SLNs) in patients with breast cancer.
Effects of chemokines on expression of adhesion molecules on human LECs. Figure 2(a) shows representative microphotographs of the effects of 18‐h stimulation with 10 ng/mL CCL1 (Fig. 2a 1–4), 10 ng/mL CCL2 (Fig. 2a 5–8), 10 ng/mL CCL12 (Fig. 2a 9–12) or 10 ng/mL CCL21 (Fig. 2a 13–16) on the immunohistochemical expression of adhesion molecules on cultured human LECs. The 18‐h stimulation with 10 ng/mL CCL2 only caused a marked expression of ICAM‐1 on the LECs. Thus, almost all cultured LECs were strongly stained by ICAM‐1 antiserum (Fig. 2a 8). Little or no expression of either E‐selectin or VCAM‐1 was observed on the cultured LECs (Fig. 2a 1,5,9,13 and 2a 3,7,11,15). In contrast, slight staining was observed with ICAM‐1 antiserum on the LECs stimulated with 10 ng/mL CCL1, 10 ng/mL CCL12 or 10 ng/mL CCL21 (Fig. 2a 4,12 and 16).
Figure 2.
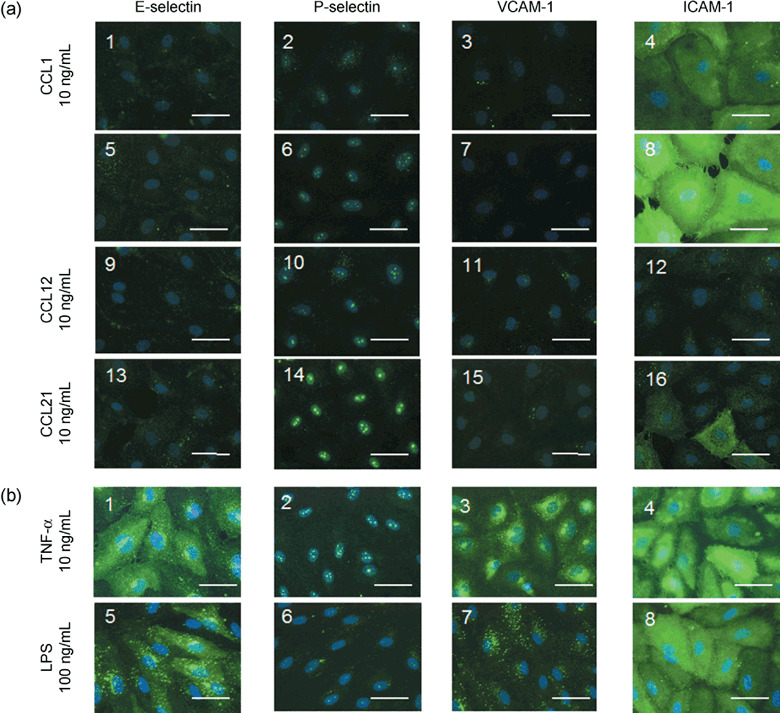
(a) Representative photomicrographs of the effects of CCL1 (10 ng/mL), CCL2 (10 ng/mL), CCL12 (10 ng/mL) and CCL21 (10 ng/mL) after 18‐h stimulation on the immunohistochemical expression of E‐selectin,( 1 , 5 , 9 , 13 ) P‐selectin,( 2 , 6 , 10 , 14 ) VCAM‐1,( 3 , 7 , 11 , 15 ) and ICAM‐1( 4 , 8 , 12 , 16 ) on cultured human LECs. (b) Representative photomicrographs of the effects of TNF‐α (10 ng/mL) and LPS (100 ng/mL) after 18‐h stimulation on the immunohistochemical expression of adhesion molecules on the LECs. Each photomicrograph was merged with the corresponding DAPI counterstaining image of the human LECs. Each marker is 50 µm.
For positive controls of E‐selectin, P‐selectin and VCAM‐1, we examined the effects of TNF‐α or LPS on immunohistochemical expressions of adhesion molecules on the cultured human LECs. As shown in Figure 2(b), an 18‐h stimulation with 10 ng/mL TNF‐α produced marked expression of E‐selectin (Fig. 2b 1), P‐selectin (Fig. 2b 2), VCAM‐1 (Fig. 2b 3) and ICAM‐1 (Fig. 2b 4) on the LECs. In contrast, 18‐h stimulation with 100 ng/mL LPS caused a marked expression of E‐selectin (Fig. 2b 5) and ICAM‐1 (Fig. 2b 8), but no or little expression of P‐selectin (Fig. 2b 6) and VCAM‐1 (Fig. 2b 7) on the LECs.
Effects of stimulation time on CCL2‐mediated expression of adhesion molecules or ICAM‐1 mRNA on human LECs. Figure 3(a) shows representative microphotographs of the effects of stimulation time on the CCL2‐mediated immunohistochemical expression of adhesion molecules on the cultured human LECs. As shown on the photomicrographs obtained at 0 h, no or little expression of E‐selectin, P‐selectin, VCAM‐1 or ICAM‐1 was observed on the cultured LECs (Fig. 3a 1–4). Thus, this overnight culture of starvation medium containing 3% FBS caused no or little expression of adhesion molecules on the LECs. Similar to this observation, 18 h‐culture of EBM‐2 containing 3% FBS also produced no significant expression of adhesion molecules on the human LECs.
Figure 3.
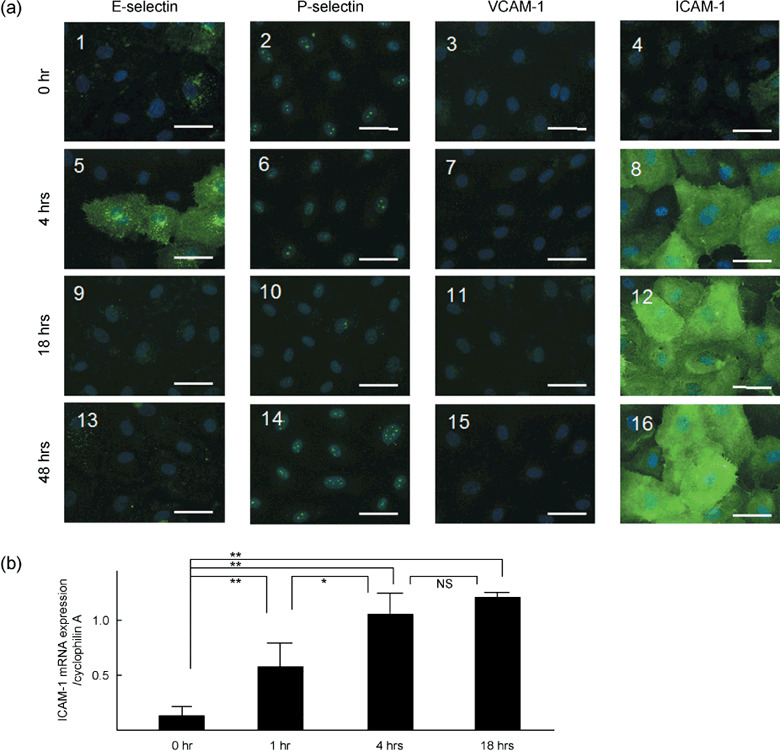
(a) Representative photomicrographs of the effects of the stimulation time (0, 4, 18, 48 h) on the 10 ng/mL CCL2‐mediated immunohistochemical expression of E‐selectin,( 1 , 5 , 9 , 13 ) P‐selectin,( 2 , 6 , 10 , 14 ) VCAM‐1( 3 , 7 , 11 , 15 ) and ICAM‐1( 4 , 8 , 12 , 16 ) on cultured human LECs. Each photomicrograph was merged with the corresponding DAPI counterstaining image of the human LECs. Each marker is 50 µm. (b) Effects of stimulation time (0, 1, 4, 18 h) of 10 ng/mL CCL2 on ICAM‐1 mRNA levels in the human LECs evaluated by RT‐PCR. **P < 0.01 and *P < 0.05, significantly different from each column. NS, not significant.
In contrast, 4‐h stimulation of 10 ng/mL CCL2 caused a marked expression of ICAM‐1 on the cultured LECs (Fig. 3a 8). Thus, almost all cultured LECs were markedly stained by ICAM‐1 antiserum. Slight staining with E‐selectin antiserum was also observed on the LECs (Fig. 3a 5). On the other hand, no or little expression of VCAM‐1 was found on the LECs (Fig. 3a 7). By increasing the stimulation time to 18 and 48 h, the immunoreaction of anti‐E‐selectin was markedly decreased (Fig. 3a 9,13). However, the intensity of the immunoreactivity for ICAM‐1 was significantly increased at the stimulation time of 18 h only (Fig. 3a 12). Thus, after 18 h of stimulation the immunoreactivity of ICAM‐1 was found to be dense on all cultured LECs.
Figure 3(b) summarizes data of the effects of stimulation time of 10 ng/mL CCL2 on ICAM‐1 mRNA levels in the cultured human LECs. The CCL2‐mediated expression of ICAM‐1 mRNA is significantly increased at 1 h after stimulation. The increase of CCL2‐mediated expression of ICAM‐1 mRNA was kept around 4 h after stimulation, as it was the maximum level of the expression. The CCL2‐mediated expression of ICAM‐1 mRNA increased slightly up to 18 h after stimulation.
Effects of concentration of CCL2 on immunohistochemical expression of ICAM‐1 on human LECs. Figure 4 shows the effects of the concentration of CCL2 on the immunohistochemical expression of ICAM‐1 on the human LECs. As shown, 10 pg/mL CCL2 caused a slight, but significant, expression of ICAM‐1 on the cultured human LECs (Fig. 4a 1). The CCL2‐mediated expression of ICAM‐1 on the LECs was dose‐dependently increased up to 1 ng/mL. Thus, 1 or 10 ng/mL of CCL2 produced a marked expression of ICAM‐1 on almost all cultured LECs. Figure 4(b) summarizes the following data: 10 pg/mL CCL2 (Fig. 4b 1) 134.5 ± 7.4 (n = 5) versus 100 pg/mL CCL2 (Fig. 4b 2) 132.2 ± 5.8 (n = 5, not significant); 1 ng/mL CCL2 (Fig. 4b 3) 163.8 ± 4.5 (n = 5, P < 0.01) versus 10 pg/mL CCL2 134.5 ± 7.4 (n = 5); and 10 ng/mL CCL2 (Fig. 4b 4) 172.5 ± 2.8 (n = 5, P < 0.01) versus 10 pg/mL CCL2 134.5 ± 7.4 (n = 5).
Figure 4.
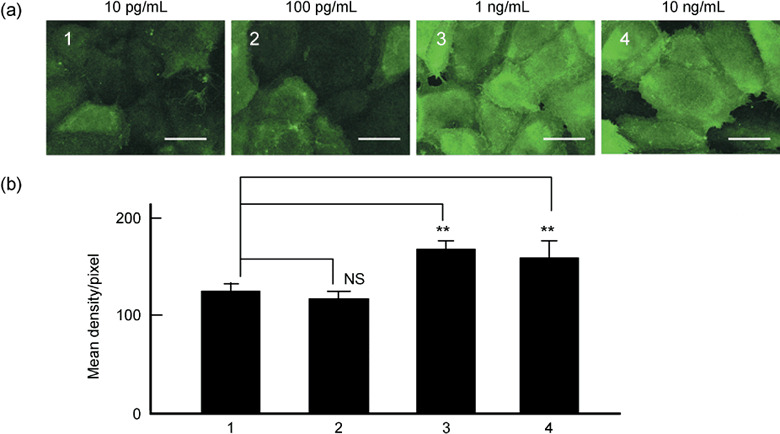
Effects of the concentration of CCL2 ranging from 10 pg/mL to 10 ng/mL on immunohistochemical expression of ICAM‐1 on human LECs. (a) Representative photomicrographs of the effects of 10 pg/mL,( 1 ) 100 pg/mL,( 2 ) 1 ng/mL( 3 ) and 10 ng/mL( 4 ) CCL2 for 18 h of stimulation of the expression of ICAM‐1 on the human LECs. Each marker is 50 µm. (b) Summarized density measurement data of each photomicrograph using Scion image analysis. The number of the abscissa coincides with each one shown in (a). The ordinate denotes the normalized value of the density measurement shown by mean density/pixel (n = 5). NS, not significant. **P < 0.01, significantly different from the value obtained with 10 pg/mL CCL2.
Effects of CCL2 neutralization on CCL2‐mediated expression of ICAM‐1 on human LECs. Figure 5 demonstrates the effects of CCL2 neutralization on the CCL2‐mediated expression of ICAM‐1 on cultured human LECs. As shown in Figure 5(a), the neutralization of CCL2 with a specific CCL2 antibody caused a significant reduction of the CCL2‐mediated immunohistochemical expression of ICAM‐1 on the cultured human LECs (Fig. 5a 3). The summarized data are shown in Figure 5(b). Thus, the 10 ng/mL CCL2‐mediated immunohistochemical expression of ICAM‐1 on the human LECs was significantly reduced by neutralization of CCL2: 10 ng/mL CCL2 (Fig. 5b 2) 182.8 ± 8.5 (n = 5) versus negative control with EBM‐2 (Fig. 5b 1) 88.2 ± 2.9 (n = 5, P < 0.01) and 10 ng/mL CCL2 with neutralization of CCL2 (Fig. 5b 3) 149.1 ± 8.0 (n = 5, P < 0.05) versus 10 ng/mL CCL2 (Fig. 5b 2) 182.8 ± 8.5 (n = 5).
Figure 5.

Effects of CCL2 neutralization of the CCL2‐mediated immunohistochemical expression of ICAM‐1 on cultured human LECs. (a) Representative photomicrographs of the effects of 10 ng/mL CCL2 in the presence( 3 ) or absence( 2 ) of 1.0 µg/mL CCL2‐specific antibody. Micrograph 1 denotes a negative control obtained with serum starvation cultured medium (EBM‐2 containing 3% FBS). Each marker is 50 µm. (b) Summarized density measurement data of each photomicrograph by Scion image analysis. The abscissa and ordinate are the same items as those in the Fig. 4. **P < 0.01 and *P < 0.05, significantly different from 10 ng/mL CCL2‐mediated response. (c) Representative tracings of the expression of ICAM‐1 protein in the human LECs evaluated by Western blot analysis. The number of the abscissa coincides with each one shown in (a or b).
To analyze quantitatively the effect of CCL2 neutralization on the CCL2‐mediated expression of ICAM‐1 protein in the cultured human LECs, Western blot analysis was performed. Figure 5(c) shows the representative data of Western blot analysis. As shown in Figure 5(c 2), 18 h‐stimulation of 10 ng/mL CCL2 produced a significant expression of ICAM‐1 protein in the cultured LECs. The CCL2‐mediated expression of ICAM‐1 protein was significantly inhibited by the treatment with CCL2 neutralization (Fig. 5c 3). Figure 5(c 1) shows a negative control.
Attachment assay with 18 h of stimulation with 10 ng/mL CCL2 in the presence or absence of neutralization of CCL2. As shown in Figure 6, the 18 h of stimulation of 10 ng/mL CCL2 caused a significant increase in the in vitro attachment of carcinoma cells, MCF‐7 (I) and MDA‐MB‐231 (II), to the human LECs. The increase in the attachment of carcinoma cells to the LECs was significantly reduced by the neutralization of CCL2 (I‐3 and II‐3). Experimental data are summarized: MCF‐7, 10 ng/mL CCL2 (I‐2) 14.8 ± 1.7 (n = 5) versus negative control with DMEM/F12 (I‐1) 8.8 ± 0.5 (n = 5, P < 0.01), and neutralization of CCL2 (I‐3) 5.6 ± 0.7 (n = 5, P < 0.01) versus 10 ng/mL CCL2; MDA‐MB‐231, 10 ng/mL CCL2 (II‐2) 23.4 ± 1.5 (n = 5) versus negative control with DMEM/F12 (II‐1) 13.2 ± 1.0 (n = 5, P < 0.01), and neutralization of CCL2 (II‐3) 12.4 ± 1.3 (n = 5, P < 0.01) versus 10 ng/mL CCL2.
Figure 6.
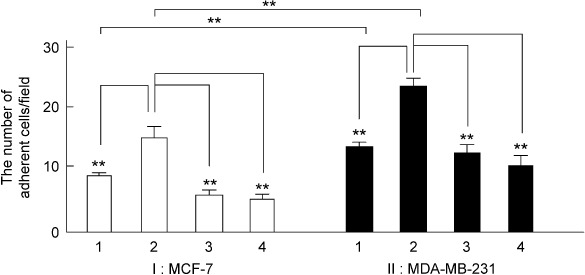
Summarized data of the attachment assay of the effects of 10 ng/mL CCL2 in the absence (I‐2 and II‐2) or presence of CCL2‐specific antibody (CCL2 neutralization, I‐3 and II‐3) or anti‐ICAM‐1 antibody (I‐4 and II‐4) using breast cancer cell lines MCF‐7 (I) and MDA‐MB‐231 (II). The ordinate shows the normalized number of adherent carcinoma cells per field (×100). **P < 0.01, significantly different from 10 ng/mL CCL2‐mediated response or significantly different from each breast cancer cell.
Attachment assay with 18 h of stimulation with 10 ng/mL CCL2 in presence or absence of anti‐ICAM‐1 antibody. Next, we examined whether the 10 ng/mL CCL2‐mediated facilitation of the attachment of carcinoma cells, MCF‐7 (Fig. 6 I) and MDA‐MB‐231 (Fig. 6 II), to the human LECs could be blocked by treatment with the ICAM‐1 antibody. Experimental data are summarized: MCF‐7, 10 ng/mL CCL2 (I‐2) 14.8 ± 1.7 (n = 5) versus 10 ng/mL CCL2 with anti‐ICAM‐1 antibody (I‐4) 5.2 ± 0.5 (n = 5, P < 0.01); MDA‐MB‐231, 10 ng/mL CCL2 (II‐2) 23.4 ± 1.5 (n = 5) versus 10 ng/mL CCL2 with anti‐ICAM‐1 antibody (II‐4) 10.6 ± 1.4 (n = 5, P < 0.01).
Immunohistochemical expressions of LFA‐1 and Mac‐1 on human breast cancer cell lines. To evaluate counter receptors/ligands of ICAM‐1, we examined immunohistochemical expressions of LFA‐1 (CD11a) and Mac‐1 (CD11b) on human breast cancer cell lines, MCF‐7 and MDA‐MB‐231. Figure 7 shows representative microphotographs of the expression of LFA‐1 (Fig. 7a–c) and Mac‐1 (Fig. 7d–f) on MCF‐7 and MDA‐MB‐231 cancer cells. Immunohistochemical expressions of both LFA‐1 and Mac‐1 were strongly observed on the MCF‐7 and MDA‐MB‐231 cells. Figure 7(c,f) are representative microphotographs of negative controls without primary antibodies of LFA‐1 and Mac‐1, respectively.
Figure 7.
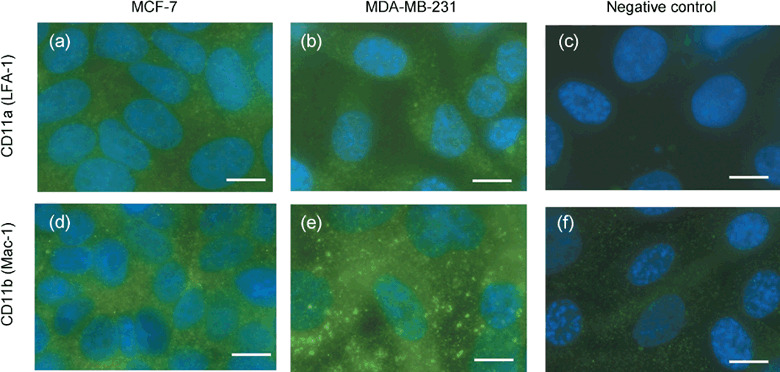
Representative photomicrographs of immunohistochemical expression of LFA‐1 (a,b) or Mac‐1 (d,e) on the human breast cancer cell lines, MCF‐7 and MDA‐MB‐231. (c,f) Negative controls without primary antibody of LFA‐1 and MAC‐1, respectively. Each marker is 10 µm.
Immunohistochemical expressions of E‐selectin and ICAM‐1 on the SLN tissues with or without metastasis of carcinoma cells. Figure 8 demonstrates representative microphotographs of immunohistochemical expressions of E‐selectin and ICAM‐1 on the fresh‐frozen SLN tissues isolated from breast cancer patients. As shown in Fig. 8(f,h), the immunohistochemical expressions of ICAM‐1 are strongly observed on the SLN tissue with metastasis of carcinoma cells. In contrast, the expression of ICAM‐1 is weakly found on the SLN tissue without metastasis of carcinoma cells isolated from the same patient with breast cancer (Fig. 8e,g).
Figure 8.

Representative photomicrographs of immunohistochemical expression of (c,d) E‐selectin and (e,f,g,h) ICAM‐1 on the fresh‐frozen SLNs tissues with or without metastasis of carcinoma cells isolated from a patient with breast cancer. (a,b) Hematoxylin–eosin stained SLNs tissues. *, metastatic region of carcinoma cells in the SLN. Each marker is 100 µm.
On the other hand, no or little expression of E‐selectin is confirmed on the SLN tissues with and without metastasis of carcinoma cells (Fig. 8c,d).
Representative hematoxylin–eosin stained microphotographs of the SLN tissues with (Fig. 8b) and without (Fig. 8a) metastasis of carcinoma cells are shown.
Discussion
CCL2 causes ICAM‐1‐mediated facilitation of the attachment of carcinoma cells to human LECs. Regional lymph nodes are the most common and earliest sites of metastasis of malignant tumors. The clinical success of sentinel node navigation surgery( 9 , 10 ) suggests that the regional lymph node possesses an effective filtering function as a mechanical barrier against metastatic cancer cells. However, it is also known that primary tumors influence the microenvironment of tumor tissue before metastasis.( 5 , 6 ) It is unclear which molecules in the regional lymph nodes develop a suitable environment for micrometastasis within these nodes. Therefore, we have hypothesized that malignant tumors and/or metastatic carcinoma cells release key chemical substances that produce a microenvironment suitable for micrometastasis of carcinoma cells within regional lymph nodes.
Our major findings in the present study can be summarized as follows. The chemokine CCL2, but none of CCL1, CCL12, nor CCL21 caused a selective and significant immunohistochemical expression of ICAM‐1 in cultured human LECs isolated from the nearest afferent lymph vessels of sentinel lymph nodes in patients with breast cancer. By increasing the stimulation time of CCL2 from 4 to 18 and 48 h, the intensity of the immunoreactivity for ICAM‐1 was significantly increased dependent on the stimulation time up to 18 h. The ICAM‐1 mRNA levels were also elevated significantly up to 18 h. The CCL2‐mediated expression of ICAM‐1 protein was also confirmed at 18‐h stimulation by Western blot analysis. The CCL2‐mediated immunohistochemical expression of ICAM‐1 on the LECs was dose‐dependently increased from 10 pg/mL to 1 ng/mL. The CCL2‐mediated expression of ICAM‐1 on the human LECs was significantly reduced by the neutralization of CCL2 with a specific CCL2 antibody. Eighteen hours of treatment with CCL2 caused a significant facilitation of the in vitro attachment of carcinoma cells, MDA‐MB‐231 and MCF‐7, to the human LECs. The CCL2‐mediated response in the attachment assay was significantly reduced by the neutralization of CCL2, or by additional treatment with an anti‐ICAM‐1 antibody. Therefore, we conclude that CCL2, but none of CCL1, CCL12, nor CCL21, induces the selective expression of ICAM‐1 mRNA and protein on cultured human LECs and then facilitates in vitro attachment of carcinoma cells, MDA‐MB‐231 and MCF‐7, to the cultured LECs through the overexpression of ICAM‐1 in an in vitro micrometastatic experimental model. Thus, the CCL2‐mediated overexpression of ICAM‐1 on human LECs may contribute, in part, to creating a suitable microenvironment and then developing micrometastasis of carcinoma cells within regional lymph nodes.
This conclusion may be compatible with a recent paper that showed that an intratumoral injection of CCL2 in mouse pancreatic cancer produced expression of ICAM‐1 in the tumor tissues and then induces effective interaction between monocytes and endothelial cells in the peritumoral area.( 11 ) It is also known that CCL2 binds to specific receptors, mainly found on monocytes, and regulates monocyte behavior in inflammatory and cancer tissues.( 12 , 13 , 14 , 15 , 16 ) However, the assertion that monocyte/macrophage infiltration is an important aspect of host response in tumor growth remains controversial.( 17 ) Activated macrophages are known to be cytotoxic for cancer cells, but less so for normal cells.( 18 ) On the other hand, tumor‐associated macrophages have been shown to promote the growth of tumor cells in vitro ( 19 ) and to be positively correlated with tumor invasion and progression.( 20 ) Although the role of monocytes/macrophages in tumor tissues is controversial, monocyte migration via micro‐ and lymph‐circulation to tumor sites would be necessary in host immune responses at least before advanced stages. In addition, the administration of specific chemokines for the recruitment of monocytes may trigger antitumor host responses.
It may be noteworthy to mention again that in the present study CCL2 produced an overexpression of ICAM‐1 on human lymphatic endothelial cells (LECs) in the nearest afferent lymph vessels, and/or within sentinel lymph nodes, and this facilitated interactions between LECs and carcinoma cells.
However, the source of CCL2 which causes an overexpression of ICAM‐1 within sentinel lymph node remains unclear. The concentrations of CCL2 in the supernatants of culture media of MDA‐MB‐231 and MCF‐7 cells were determined to be less than 62.5 pg/mL by enzyme‐linked immunosorbent assay (ELISA). Further investigation will be needed in future to evaluate the source of CCL2 in SLNs.
On the other hand, Sawa et al.( 21 ) reported recently that LPS induces the expression of ICAM‐1 and CCL2 on the cultured human LECs isolated from dermal microlymph vessels. The possibility that LPS‐induced CCL2 expression may have a role in the induction of ICAM‐1 on the human LECs should be also evaluated in future.
Pivotal roles of ICAM‐1 in micrometastasis. ICAM‐1 expression by tumor cells has been reported to be a major contributing factor that facilitates metastatic progression.( 22 ) On the other hand, the study of tumor microvessels with leukocyte–endothelial cell adhesion has revealed that adhesive interactions diminished under both basal and cytokine‐stimulated conditions.( 23 ) This observation is consistent with immunohistochemical( 24 ) and cytofluorimetric( 25 ) studies that showed that reduced endothelial ICAM‐1 expression is predicted in tumor microvessels. Thus, it has been suggested that the proposed down‐regulation of endothelial ICAM‐1 facilitates tumor progression by allowing tumor cells to avoid immunosurveillance by circulating lymphocytes. However, there are several other studies of tumor vasculature that invoke the enhanced expression of endothelial ICAM‐1, resembling an inflammatory phenotype, in breast cancer.( 26 ) The expression of adhesion molecules on human LECs remains unclear.
In the present experiments, CCL2 produced the overexpression of ICAM‐1 on human LECs, and then facilitated ICAM‐1‐mediated attachment of carcinoma cells to the LECs located in the nearest afferent lymph vessels of sentinel lymph nodes in patients with breast cancer. The counter receptors/ligands of ICAM‐1 such as LFA‐1 and Mac‐1 were clearly observed on MDA‐MB‐231 and MCF‐7 human breast cancer cells, which were used in the in vitro attachment assay. In addition, the immunohistochemical expression of ICAM‐1, but not E‐selectin, was strongly observed on the fresh‐frozen SLN tissues with metastasis of carcinoma cells isolated from breast cancer patients in the present study. Therefore, this study may be the first to suggest that CCL2 may play crucial roles in the development of a microenvironment within the regional lymph node for producing micrometastasis of carcinoma cells.
Acknowledgments
This study was supported financially, in part, by Grants‐in‐Aid for Scientific Research (17591873, 19209044) from the Japanese Ministry of Education, Science, Sports and Culture, and by the Intelligent Surgical Instruments Project of METI (Japan) (2007‐).
References
- 1. Rot A, Von Adrian UH. Chemokines in innate and adaptive host defense: basic chemokines grammar for immune cells. Annu Rev Immunol 2004; 22: 891–928. [DOI] [PubMed] [Google Scholar]
- 2. Raman D, Baugher PJ, Thu YM et al . Role of chemokines in tumor growth. Cancer Lett 2007; 256: 137–65. [DOI] [PMC free article] [PubMed] [Google Scholar]
- 3. Müller A, Homey B, Soto H et al . Involvement of chemokine receptors in breast cancer metastasis. Nature 2001; 410: 50–6. [DOI] [PubMed] [Google Scholar]
- 4. Giuliano AE, Kirgan DM, Guenther JM et al . Lymphatic mapping and sentinel lymphadenectomy for breast cancer. Ann Surg 1994; 220: 391–401. [DOI] [PMC free article] [PubMed] [Google Scholar]
- 5. Kaplan RN, Riba RD, Zacharoulis S et al . VEGFR1‐positive haematopoietic bone marrow progenitors initiate the pre‐metastatic niche. Nature 2005; 438: 820–7. [DOI] [PMC free article] [PubMed] [Google Scholar]
- 6. Hiratsuka S, Watanabe A, Aburatani H et al . Tumor‐mediated upregulation of chemoattractants and recruitment of myeloid cells predetermines lung metastasis. Nat Cell Biol 2006; 8: 1369–75. [DOI] [PubMed] [Google Scholar]
- 7. Kawai Y, Minami T, Fujimori M et al . Characterization and microarray analysis of genes in human lymphatic endothelial cells from patients with breast cancer. Lymphat Res Biol 2007; 5: 115–26. [DOI] [PubMed] [Google Scholar]
- 8. Kawai Y, Hosaka K, Kaidoh M et al . Heterogeneity in immunohistochemical, genomic, and biological properties of human lymphatic endothelial cells between initial and collecting lymph vessels. Lymphat Res Biol 2008; 6: 15–27. [DOI] [PubMed] [Google Scholar]
- 9. Tanabe KK, Reintgen D. The role of sentinel lymph node mapping for melanoma. Adv Surg 1997; 31: 79–103. [PubMed] [Google Scholar]
- 10. Veronesi U, Paqanelli G, Viale G et al . A randomized comparison of sentinel‐node biopsy with routine axillary dissection in breast cancer. N Engl J Med 2003; 349: 546–53. [DOI] [PubMed] [Google Scholar]
- 11. Okudaira K, Tsuzuki Y, Hokari R et al . Effects of intratumoral injection of CCL2 on monocyte–endothelial cell interactions in mouse pancreatic cancer. Microcirculation 2007; 14: 241–51. [DOI] [PubMed] [Google Scholar]
- 12. Evans R. Macrophage accumulation in primary and transplanted tumors growing in C5‐deficient B10.D2/oSn mice. Int J Cancer 1980; 26: 227–9. [DOI] [PubMed] [Google Scholar]
- 13. Balch CM, Riley LB, Bae YJ et al . Patterns of human tumor‐infiltrating lymphocytes in 120 human cancers. Arch Surg 1990; 125: 200–5. [DOI] [PubMed] [Google Scholar]
- 14. Boring L, Gosling J, Chensue SW et al . Impaired monocyte migration and reduced type 1 (Th1) cytokine responses in C‐C chemokine receptor 2 knockout mice. J Clin Invest 1997; 100: 2552–61. [DOI] [PMC free article] [PubMed] [Google Scholar]
- 15. Kurihara T, Warr G, Loy J et al . Defects in macrophage recruitment and host defense in mice lacking the CCR2 chemokine receptor. J Exp Med 1997; 186: 1757–62. [DOI] [PMC free article] [PubMed] [Google Scholar]
- 16. Kuziel WA, Morgan SJ, Dawson TC et al . Severe reduction in leukocyte adhesion and monocyte extravasation in mice deficient in CC chemokine receptor 2. Proc Natl Acad Sci USA 1997; 94: 12053–8. [DOI] [PMC free article] [PubMed] [Google Scholar]
- 17. Conti I, Rollins BJ. CCL2 (monocyte chemoattractant protein‐1) and cancer. Semin Cancer Biol 2004; 14: 149–54. [DOI] [PubMed] [Google Scholar]
- 18. Piessens WF, Churchill WH Jr, David JR. Macrophage activated in vitro with lymphocyte mediators kill neo plastic but not normal cells. J Immunol 1975; 114: 293–9. [PubMed] [Google Scholar]
- 19. Mantovani A, Bottazzi B, Colotta F et al . The origin and function of tumor‐associated macrophages. Immunol Today 1992; 13: 265–70. [DOI] [PubMed] [Google Scholar]
- 20. Van Netten JP, George EJ, Ashmead BJ et al . Macrophage–tumour cell associations in breast cancer. Lancet 1993; 342: 872–3. [PubMed] [Google Scholar]
- 21. Sawa Y, Tsuruga E, Iwasawa K et al . Leukocyte adhesion molecule and chemokine production through lipoteichoic acid recognition by toll‐like receptor 2 in cultured human lymphatic endothelium. Cell Tissue Res 2008; 333: 237–52. [DOI] [PubMed] [Google Scholar]
- 22. Johnson JP. Cell adhesion molecules of the immunoglobulin supergene family and their role in malignant transformation and progression to metastatic disease. Cancer Metastasis Rev 1991; 10: 11–22. [DOI] [PubMed] [Google Scholar]
- 23. Wu NZ, Klitzman B, Dodge R et al . Diminished leukocyte–endothelium interaction in tumor microvessels. Cancer Res 1992; 52: 4265–8. [PubMed] [Google Scholar]
- 24. Kuzu I, Bicknell R, Fletcher CD et al . Expression of adhesion molecules on the endothelium of normal tissue vessels and vascular tumors. Lab Invest 1993; 69: 322–8. [PubMed] [Google Scholar]
- 25. Griffioen AW, Damen CA, Martinotti S et al . Endothelial intercellular adhesion molecule‐1 expression is suppressed in human malignancies: the role of angiogenic factors. Cancer Res 1996; 56: 1111–17. [PubMed] [Google Scholar]
- 26. Fox SB, Turner GD, Gatter KC et al . The increased expression of adhesion molecules ICAM‐3, E‐ and P‐selectins on breast cancer endothelium. J Pathol 1995; 177: 369–76. [DOI] [PubMed] [Google Scholar]