

Abstract
Abrogated mitotic progression is a common hallmark of cancer. UbcH10, one of the components of the ubiquitin/proteasome pathway, plays a pivotal role in the regulation of mitotic progression. Abnormal UbcH10 activity is reported in certain types of human cancers; its overexpression is occasionally encountered in cancerous tissue compared with adjacent normal tissue. Current studies have suggested the critical role of UbcH10 in the spindle assembly checkpoint and the subsequent accurate separation of sister chromatids, which is orchestrated by a series of molecular interactions governed by the complex and diverse cell cycle machinery. To validate the potential role of UbcH10 in cell proliferation in cancer, we have analyzed the clinicopathological relevance of UbcH10 in progression of breast cancer using a combinatorial approach of human tumor arrays and biochemical analyses. Our results show that the percentage of tested samples which stained positive for UbcH10 in breast cancer tissues is significantly higher compared to the adjacent nonmalignant tissue. Furthermore, results from the clinicopathological analysis have revealed that elevated expression of UbcH10 is associated with higher histological grade tumors. In addition, depletion of UbcH10 by RNA interference in breast cancer cells resulted in decreased cellular proliferation, while overexpression of UbcH10 significantly enhanced cellular growth in breast cancer. Our results suggest a pathological correlation between UbcH10 and cell proliferation in breast cancer. Thus, aberrant UbcH10 activity may induce the dysfunction of proper cell cycle progression and result in the aggressive behavior of tumor cells in patients with breast cancer. (Cancer Sci 2009; 100: 238–248)
Abrogated cell cycle regulation is often related to the progression of human cancers.( 1 ) Proper cell cycle progression is ensured by controlled oscillation of the cell cycle machinery. The ubiquitin/proteasome system has been strongly linked to the orchestration of several critical cell cycle machineries such as the stage‐dependent CDK and their inhibitors.( 2 , 3 , 4 , 5 , 6 ) Skp1‐cullin‐F box (SCF) complex and anaphase‐promoting complex (APC) have been implicated as two major ubiquitin E3 ligases that govern mitotic progression and transition from the G1 to S phase.( 7 , 8 , 9 ) The activity of APC is mainly regulated by Cdc20 and Cdh1 from mitosis to the G1 phase. When cells enter mitosis, phosphorylation of APC by the mitotic Cdc2 kinase enhances the formation of the active Cdc20/APC complex. The onset of anaphase triggers degradation of securin and separation of sister chromatids by activation of separase. In rate mitosis, Cdc20 is degraded by Cdh1/APC, leading to a complete replacement of Cdc20/APC by Cdh1/APC.( 10 , 11 )
Recent studies have demonstrated that UbcH10, an E2 protein catalyzing the E3‐dependent multiple ubiqutination leading to proteolysis of substrate proteins, can activate Cdc20/APC, and specifically override the spindle checkpoint through the dissociation of checkpoint proteins.( 12 , 13 ) Addition of UbcH10 to an active spindle checkpoint extract leads to the degradation of Cyclin A and securin, but not Cdc20.( 13 ) These observations suggest the possibility that UbcH10 might be involved in the termination of the spindle assembly checkpoint. Indeed, supplementation of UbcH10 dissociates the checkpoint proteins Mad2 and BubR1 from the APC/C,( 13 , 14 ) implicating that UbcH10‐dependent ubiquitination of Cdc20 promotes the dissociation of Cdc20 from Mad2, which is then followed by the ubiquitination of other substrates from the metaphase to anaphase transition. Results of these studies therefore suggest that aberrant expression of UbcH10 impairs the spindle assembly checkpoint, potentially inducing chromosomal instability.
Pathological and epigenetic studies have demonstrated that malfunction or mutation of molecules involved in the spindle assembly checkpoint are associated with the progression of a variety of cancers.( 15 , 16 , 17 , 18 , 19 , 20 ) Some of these molecules have been suggested to be potential biological markers for several types of cancers and can be used to predict the properties of certain types of malignancies.( 1 , 15 , 16 ) Dysfunction of several components of the spindle assembly checkpoint, including Mad1, Mad2, BubR1, and Aurora A, are correlated with chromosomal instability in certain types of cancers such as prostate, testicular, gastric, and lung cancers.( 17 , 18 , 19 , 20 ) These molecules have also been implicated in determining the sensitivity of certain chemotherapeutic agents in cancer patients.( 21 , 22 , 23 ) Nevertheless, the underlying mechanisms as well as the clinicopathological relevance by which UbcH10 is involved in the aforementioned carcinogenesis have not been fully addressed and remain unknown. Exploring whether UbcH10 and its role in the spindle assembly checkpoint are important machinery in the tumorigenic pathway will be critical for enhancing our knowledge toward understanding the initiation and/or progression of human cancer.
Previous study using cell line–based analysis has suggested the role of UbcH10 in regulating spindle assembly–mediated chromosomal instability.( 24 , 25 , 26 ) To validate the connection between UbcH10 and breast cancer progression, we used a cell line–based tissue array to elucidate the clinicopathological relevance of UbcH10 in breast cancer. The results of this study confirmed that aberrant expression of UbcH10 promoted tumor expansion via dysfunction of mitotic progression. These results further suggest that the E2 enzyme UbcH10 may promote breast tumor growth through abrogation of mitotic progression mediated via the spindle assembly checkpoint.
Materials and Methods
Plasmid preparation and small interfering RNA. pcDNA3‐Flag and pcDNA3‐Flag‐UbcH10 (G418‐resistant) plasmids have been reported previously.( 24 ) Knockdown using small interfering RNA (siRNA) for UbcH10 was carried out using the target sequence UbcH10 495 – 5′‐AACCTGCAAGAAACCTACTCA‐3′.( 25 ) Scramble siRNA (All stars negative control siRNA; Qiagen, Valencia, CA, USA) was used as the control. Transfection of siRNA was carried out using Lipofectamine 2000 (Invitrogen, Carlsbad, CA, USA) according to the manufacturer's protocol.
To obtain the pcDNA3‐Flag‐UbcH10 or pcDNA3‐Flag clone, MCF7 and MCF10A cells were transfected with these plasmids using Lipofectamine 2000 (Invitrogen) according to the manufacturer's protocol. Selection of the positive clones was started 48 h after transfection in the presence of 0.1–1.0 mg/mL of G418‐containing (Promega, Madison, WI, USA) medium, and subcloned by limiting dilution in 96‐well flat‐bottomed culture plates. Subclones were tested for Flag expression by immunoblotting using mouse monoclonal anti‐Flag M2 antibody (F3165) (Sigma, St Louis, MO, USA).
Cell culture. The human breast cancer cell line MCF7, MDA‐MB231, and MDA‐MB463 were obtained from the American Type Culture Collection (Manassas, VA, USA) and grown in RPMI‐1640 medium (Sigma) supplemented with 10% (v/v) fetal bovine serum, penicillin (100 IU/mL; Invitrogen), and streptomycin (100 µg/mL; Invitrogen), following incubation in 5% CO2 at 37°C. MCF10A cells were obtained from the American Type Culture Collection and the cells were maintained routinely in a 1:1 mixture of Dulbecco's modified Eagle's medium/Ham's F12 medium (Invitrogen) containing 15 mM Hepes (Cambrex Bio Science Walkersville, Walkersville, MD, USA), 5% horse serum (Invitrogen), 10 µg/mL bovine insulin (Cambrex Bio Science), 20 ng/mL epidermal growth factor (Cambrex Bio Science), 100 ng/mL cholera toxin (Cambrex Bio Science), 0.5 µg/mL hydrocortisone (Cambrex Bio Science), 100 IU/mL penicillin (Invitrogen), and 100 µg/mL streptomycin (Invitrogen). Cultures were passaged every 3–4 days by trypsin/EDTA (Invitrogen) detachment.
Antibodies and reagents. Antibodies were obtained from the following: rabbit polyclonal anti‐UbcH10 (A‐650) (Boston Biochem, MA, USA), mouse monoclonal anti‐α‐tubulin (DM1B) (Calbiochem, San Diego, CA, USA), rabbit polyclonal antiphosphorylated‐histone H3 (#9701) (Cell Signaling Technology, Danvers, MA, USA), rabbit polyclonal anticyclin B1 (sc‐752) (Santa Cruz Biotechnology, Santa Cruz, CA, USA), HRP‐conjugated goat antimouse antibody (Promega), and HRP‐conjugated goat antirabbit antibody (Promega). Western blot analysis was performed using an enhanced chemiluminescence detection kit (Amersham, Buckinghamshire, UK). Semi‐quantification of the data was performed using an image densitometer (X‐Rite, Grandville, MI, USA).
Cell synchronization. To synchronize cells in mitosis, cells were grown in the presence of 0.4 mM thymidine (Sigma) for 18 h, washed with phosphate‐buffered saline (PBS), and grown in fresh medium for 4 h. This was followed by growth in 50 ng/mL of nocodazole (Sigma) for 12 h, and then the release of the cells. At each time‐point, the cells were harvested and analyzed.
Cell cycle analysis. Cells were harvested and pelleted by centrifugation, and were resuspended and fixed in ethanol. After fixation, the cells were resuspended in PBS containing 50 µg/mL of propidium iodide (PI) solution (Sigma) with 5 µg/mL of RNase (Sigma). Flow cytometric analysis of PI‐stained cells was performed using a FACScan (Becton Dickinson, Mountain View, CA, USA). The population of the cells in each cell‐cycle phase was determined using ModiFIT software (Becton Dickinson).
Colony formation by soft agar assay. Twenty‐four hours after transfection, 2.0 × 10⁵/mL viable cells were counted. Cells were seeded into soft agar as described previously( 27 ) with slight modification (Dr Flemington, Tulane Cancer Center, New Orleans, LA, USA). Briefly, 1% agarose (Sigma) solution was made with sterile water and 5 mL agarose was added to a six‐well plate until the plate was covered completely. The agarose was then pipetted to obtain a thin film of agarose on the bottom and side of each well, and 2.0 × 10⁵ cells/well were plated. Colony formation was assessed by microscopic inspection (×10) and counted 7 days after cell seeding. Since the aggregates of the cells did not grow throughout the duration of the experiment, they were not considered as colonies. Each experiment was repeated at least three times. Values given are mean (± SD) values.
Immunofluorescence. Immunofluorescence analysis was performed using the following concentration of the primary antibodies: UbcH10 (1:500), tubulin (1:100), and phosphorylated‐histone H3 (1:100). Anti‐mouse Cy2‐conjugated antibody (1:500; Jackson ImmunoResearch, West Grove, PA, USA), antimouse fluorescein‐isothiocyanate‐conjugated antibody (1:500; Jackson ImmunoResearch), and antirabbit Texas‐Red‐conjugated antibody (1:100; Jackson ImmunoResearch) were used as secondary antibodies. Semi‐quantification of the data was performed using Scion imaging software (Frederick, MD, USA).
Immunohistochemical staining and prognostic analysis. Samples were deparaffinized in xylene and rehydrated in a series of graded alcohols. The antigen was retrieved in 0.01 M sodium citrate buffer; thereafter, the sections were treated with 0.6% hydrogen peroxide.( 28 ) Samples were incubated using a rabbit antihuman UbcH10 antibody (1:200). Next, the sections were treated with a biotinylated donkey antirabbit immunoglobulin (Jackson ImmunoResearch) and a goat antimouse antibody (Vector Laboratories, Burlingame, CA, USA) followed by incubations with avidin–biotin peroxidase complex solution (DAKO Cytomation, Carpinteria, CA, USA) and 3‐amino‐9‐ethylcarbazole solution (DAKO Cytomation). The counterstaining was carried out using Mayer's hematoxylin (Sigma). Tissue arrays were purchased from US Biomax (Rockville, MD, USA). Expression of each molecule was tested in the breast cancer tissue array, which contained breast cancer tissues as well as their matched normal adjacent breast tissues for each patient. For clinicopathological analysis, human breast tissues were provided by the Breast Tissue Bank at Okayama University School of Medicine, Okayama, Japan. All the breast cancer tissues were surgically removed from Japanese patients who had not undergone any prior treatment with chemotherapy and/or radiation therapy. Clinicopathological information of the patients were as follows: mean age, 50.3 ± 11.1 years; gender, 98.7% females and 1.3% males; tumor size, 31.4 ± 10.5 mm (mean ± SD: 4.3% T1, 68.7% T2, 21.5% T3, 5.5% T4); lymph node metastasis, 72.4%; disease stage (Stage I, 3.4%; Stage II, 68.1%; Stage III, 27.7%; Stage IV, 0.8%), histological grade (Grade 1, 10%; Grade 2, 79.5%; Grade 3, 11.5%), hormone receptor status (positive for estrogen or progesterone receptor 69.1%), and all specimens were histologically proven as invasive ductal carcinomas. Stages of the disease in these patients were determined according to the 6th version of the tumor‐node‐metastasis staging system of the American Joint Committee on Cancer (AJCC) for breast cancer. To verify the specificity and optimal concentration of the antibody, each antibody and its concentration was verified using the test tissue array slides of BR241t, BR804t (US Biomax), and sectioned tissue samples (Breast Tissue Bank, Okayama University School of Medicine).
Scoring of immunohistochemical staining. UbcH10 immunohistochemical stainings were examined under a microscope (Olympus, Tokyo, Japan). Staining intensity and subcellular localization were evaluated twice in a blinded manner, based on a pre‐agreed standard for scoring staining provided by a trained pathologist (Professor S. Cheng, Department of Pathology, University of Pittsburgh, PA, USA). Staining intensity was scored separately using the following scoring criteria: (a) 0–1, negative or low staining intensity in >50% of tumor cells or moderate to high in <50% of the cells (hereafter referred to as low); and (b) 2–3, moderate to high staining intensity in >50% of tumor cells (hereafter referred to as high).( 29 )
Statistical analysis. Each value is a representative of at least three independent experiments for quantification of data. Level of statistical significance was evaluated from at least three independent experiments using the two‐tailed Student's t‐test. The χ2‐test, Fisher's exact test, and Spearman correlation test were used for statistical analysis of immunostaining results and analysis of clinicopathological data. A P‐value of <0.05 was considered statistically significant. All data were analyzed with SPSS 14.0 (Chicago, IL, USA) for Windows.
Results
Overexpression of UbcH10 in cancer. It has been demonstrated that proper mitotic progression is critical in cell cycle control, otherwise abrogation of mitotic machinery results in tetraploidy or aneuploidy, which is a hallmark of cancer.( 11 , 12 , 13 ) Based on several large genome‐wide studies as well as cell line–based biophysical analysis, UbcH10 is believed to possess the oncogenic potential to enhance carcinogenicity.( 24 ) Previous biochemical studies have demonstrated that UbcH10 plays important roles in mitosis associated with the ubiquitin–proteosome pathway.( 11 , 14 , 26 ) Current studies have implicated UbcH10 in having a pivotal role in orchestrating the metaphase‐to‐anaphase transition, thereby promoting the precocious progress into anaphase.( 11 , 26 , 30 ) To investigate the oncogenic potential of UbcH10 with malignant tumor status, we analyzed the expression of UbcH10 in various types of human malignant tissues. Using tissue array, we examined over 400 tissue samples, representing 16 different types of cancer tissues together with the adjacent nonmalignant tissues, and scored the staining intensity. In our tumor tissue analyses, both tumor and adjacent normal tissues were examined for UbcH10. Mean values of scores were obtained with statistical analyses. In several tissues, especially breast cancer tissue, UbcH10 expression is relatively high as compared with the adjacent nonmalignant tissues (Fig. 1a). In addition, the staining intensity showed statistically significant differences between cancer and nonmalignant adjacent tissues in breast, colon, lung, ovary, cervical, and thyroid cancers (Fig. 1b).
Figure 1.

Aberrant expression of UbcH10 in cancer. (a) Immunohistochemical analysis of the expression profile of UbcH10 in various types of cancers from 16 different organs and over 400 different tissues revealed that UbcH10 levels are significantly higher compared with adjacent nonmalignant tissues from colon, breast, lung, ovary, thymus, and cervical cancers. M, malignant tissue; N, normal tissue. (b) Summary of the expression profile of UbcH10 in human tissues shows that statistically significant differences are observed in the UbcH10 level between cancer and normal adjacent tissues. M, malignant tissue; N, normal tissue. *P < 0.05. (c) Results of immunoblotting analysis of UbcH10 in human breast cancer cells (MCF‐7, MDA‐MB231, and MDA‐MB463) and nonmalignant breast epithelial cells (MCF10A). UbcH10 is markedly expressed in breast cancer cells compared with normal breast epithelial cells (results are obtained from at least three independent experiments). (d) Immunofluorescence of UbcH10 in MCF7 and MCF10A cells. Higher level of UbcH10 was detected in MCF7 cells compared with MCF10A cells and it was predominantly localized in the nucleus (results are obtained from at least three independent experiments).
To further confirm the expression of UbcH10 in breast cancer and normal breast epithelia, we examined the levels of UbcH10 in different types of breast cancer as well as normal‐like cell lines (MCF10A). As demonstrated in Fig. 1(c), expression levels of UbcH10 were higher in the cancer cell line than in the normal‐like breast epithelial cell line (P < 0.05). The expression level of UbcH10 was also elevated in Hela cells (Fig. 1c)
To confirm the results obtained from the above immunoblotting analysis, we performed immunocytochemical analysis of the breast cancer cell line (MCF7) and compared it to the epithelial cells from normal‐like breast cell line (MCF10A). As demonstrated in Fig. 1(d), UbcH10 was highly expressed in the cytoplasm and the nucleus, and its localization was not significantly different between cancer and normal‐like cells. Quantification analyses demonstrated that the expression of UbcH10 in cancer cells is about 2.5‐times higher than that in normal‐like cells (Fig. 1d). The immunocytochemical analyses results are consistent with the initial immunoblotting results. The results from tissue array, immunoblotting, and immunocytochemical analyses together suggest a potential role for UbcH10 in breast cancer.
Overexpression of UbcH10 enhances cellular proliferation in breast cancer cells. To analyze the functional role of UbcH10 in promoting cellular growth associated with cell cycle regulation mediated through mitosis, we overexpressed UbcH10 in MCF7 breast cancer cells. Using pcDNA3‐Flag‐UbcH10 plasmid (containing resistance to G418), we performed overexpression of UbcH10 and subsequent selection of the successfully transfected population using G418 (Fig. 2a). As demonstrated in Fig. 2(b,c), overexpression of UbcH10 in MCF7 cells results in significant acceleration of cellular growth. Results of the cell cycle analyses showed that overexpression of UbcH10 in MCF7 cells reduced the fraction of cells in the G2/M phase (Fig. 2d). To validate whether the increase in the population in G2/M phase is due to the G2‐ or M‐phase, we further analyzed the mitotic cell population with immunofluorescence using the mitosis marker phosphorylated‐histone H3 antibody. As demonstrated in Fig. 2(e), the percentage of mitotic cells was significantly lower in cells overexpressing UbcH10 than in the control.
Figure 2.

Overexpression of UbcH10 promotes cell proliferation and alters the cell cycle profile of breast cancer cells. (a) Overexpression of UbcH10 by successful transfection of pcDNA3‐Flag‐UbcH10 (resistant to G418) in MCF7 breast cancer cells. Significantly higher levels of UbcH10 were detected in pcDNA3‐Flag‐UbcH10‐transfected cells compared with the control. Transfection was validated by immunoblot testing of Flag levels. (b) Cell proliferation rate of UbcH10‐overexpressed MCF7 (pcDNA3‐Flag‐UbcH10) cells was remarkably higher compared with that of the control plasmid (pcDNA3‐Flag) (resistant to G418) delivered cells. (c) Representative picture of the cells at the 72 h time‐point in the cell proliferation assay. Cell proliferation was markedly increased in the UbcH10‐overexpressing cells. (d) Cell cycle profile of G418‐resistant UbcH10‐overexpressing and control cells shows that the population of G2/M‐phase decreases in UbcH10 delivered cells. (e) Evaluation of the percentage of mitotic cells with immunofluorescent analysis using phosphorylated‐histone H3. pH3, green; DAPI, blue. Percentage of mitotic cells was significantly reduced in UbcH10‐overexpressing MCF7 cells (mean ± SD; *P < 0.05). (f) (left) Representative images of the cells in anchorage‐independent growth assay. Promotion of anchorage‐independent growth was observed in UbcH10‐overexpressed breast cancer cells. (right) Quantification of anchorage‐independent growth analysis by three repeat experiments. Number of colonies was markedly higher in UbcH10‐overexpressing cells (mean ± SD; *P < 0.05).
To assess the ability of MCF‐7 cells to formulate oncogenic colonies and their capacity for accelerated cell growth in response to alteration in UbcH10 expression, we conducted an anchorage‐independent growth assay and measured the cell cycle profile. As shown in Fig. 2(f), overexpression of UbcH10 in MCF‐7 cells promoted the number as well as the size (data not shown) of the colonies on soft agar.
In summary, the results based on the above analyses suggest that an increase in UbcH10 protein levels could lead to an aberrant cell cycle, particularly during mitosis, which in turn would promote oncogenesis in the breast cancer cells.
Depletion of UbcH10 suppresses cellular proliferation in breast cancer cells. To confirm the above results, we further performed depletion of UbcH10 in breast cancer cells (Fig. 3a) and subsequently examined the effects on colony formation as well as proliferation. Twenty‐four hours after the delivery of siRNA against UbcH10, the cells were counted (at 0 and 24 h after transfection) and seeded, and their cellular growth measured. As shown in Fig. 3(b,c), knockdown of UbcH10 in MCF7 cells largely reduced the rate of cellular proliferation in MCF7 cells.
Figure 3.
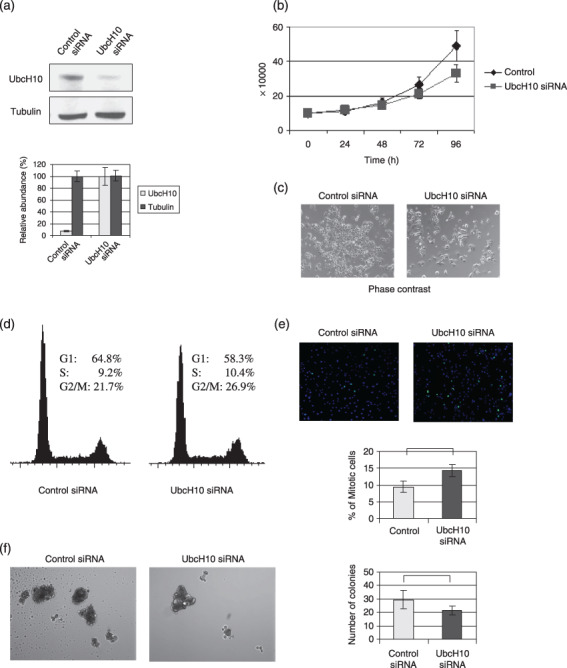
Depletion of UbcH10 suppresses the cellular proliferation in breast cancer cells. (a) Knockdown of UbcH10 with RNA interference in MCF7 cells. (b) Cell proliferation rate of the UbcH10‐siRNA‐transfected and control cells. Twenty‐four hours after transfection, the number of cells was found to be 10 × 104, and cellular growths were measured at each time‐point. Cell proliferation rate of the UbcH10‐depleted MCF7 cells was decreased compared with the control cells. (c) Representative picture of the cells at the 72 h time‐point in the cell proliferation assay. Cell proliferation rate was reduced in UbcH10‐knockdown MCF7 cells. (d) Results of the cell cycle analysis in UbcH10 siRNA‐transfected and control cells. Cell cycle profiles of UbcH10‐knockdown and control cells revealed that the population of G2/M cells increased with the depletion of UbcH10. (e) Evaluation of the percentage of mitotic cells by immunofluorescence analysis using phosphorylated‐histone H3. pH3, green; DAPI, blue. Percentage of mitotic cells was significantly increased in UbcH10‐knockdown MCF7 cells compared with the control cells (mean ± SD; *P < 0.05). (f) (left) Representative images of the cells in anchorage‐independent growth assay. Depletion of UbcH10‐suppressed anchorage‐independent growth in breast cancer cells. (right) Quantification of anchorage‐independent growth analysis by three repeat experiments (mean ± SD). Number of colonies was significantly reduced in UbcH10‐knockdown cells (mean ± SD; *P < 0.05).
Results of cell cycle analysis demonstrated that the fraction of cells in the G2/M phase was significantly elevated in UbcH10‐depleted MCF7 cells (Fig. 3d). To validate whether the increase in the population in the G2/M phase is due to the G2‐ or M‐phase, we further analyzed the mitotic cell population with immunofluorescence as described above. As demonstrated in Fig. 2(e), the percentage of mitotic cells was significantly higher in UbcH10‐depleted cells than in the control.
The oncogenic colony formation and accelerated cell growth properties of MCF‐7 cells with UbcH10 depletion were measured. As demonstrated in Fig. 3(f), both the number and size of the colonies dropped significantly when UbcH10 was depleted, confirming the potential oncogenic effects of UbcH10 in breast cancer.
Taken together, the above results further suggest that UbcH10 promotes oncogenic proliferation and can orchestrate mitotic progression, thereby promoting the acceleration of tumor growth.
Aberrant levels of UbcH10 promotes mitotic progression. Results of the overexpression or depletion of UbcH10 revealed that aberrant high levels of UbcH10 promote both cell proliferation and oncogenic cellular growth, which supports prior observations that overexpression of UbcH10 is frequently observed in human cancers. Previous demonstrations suggested the possibility that UbcH10 is potentially involved in the metaphase‐to‐anaphase transition, dissociating the checkpoint proteins from the APC/C. Consistent with these demonstrations, our study revealed that aberrant high levels of UbcH10 result in the reduction of mitotic cell populations, while depletion of UbcH10 increased the percentage of cells in mitosis. Therefore, to validate the potential role of UbcH10 in mitotic progression in breast cancer cells, we evaluated the cytological dynamics during mitosis in the presence of abundant UbcH10.
Using UbcH10‐overexpressing MCF‐7 cells, we first examined the mitotic progression with immunofluorescence. As demonstrated in Fig. 4(a), UbcH10 is abundant during the transition from metaphase to anaphase, and its localization is predominantly around the chromatids in the cell, which is in accordance with a previous report.( 30 ) Next, the cells were released from synchronization with thymidine/nocodazol block and examined for the progression of mitosis using molecular markers such as cyclin B1 and phosphorylated‐histone H3. As observed in Fig. 4(b), cyclin B1 and phosphorylated‐histone H3 disappeared earlier in UbcH10‐overexpressing cells compared with controls, suggesting that mitotic progression is quickened in the presence of abundant UbcH10.
Figure 4.

Mitotic progression in UbcH10‐overexpressing cells. (a) Representative images of the cells in metaphase and anaphase in UbcH10‐overexpressing MCF7 cells. Abundant UbcH10 was detected in metaphase and anaphase and it was localized predominantly around the chromosome. DAPI, blue; tubulin, green; UbcH10, red. (b) Expression profile of cyclin B1 and phosphorylated‐histone H3 after the release, following synchronization at mitosis with thymidine/nocodazol block. Mitotic progression was quickened in UbcH10‐overexpressed MCF7 cells compared with the control plasmid‐transfected cells. (c) Representative images of mitotic cells after the release from thymidine/nocodazol block. Mitotic progression is promoted in UbcH10‐overexpressed MCF7 cells compared with the control cells, and mitotic progression was particularly promoted during the metaphase‐to‐anaphase transition. DAPI, blue; tubulin, green.
Considering the previous observation that UbcH10 potentially participates in overriding the spindle checkpoint through dissociation of the checkpoint molecules,( 24 , 25 , 26 ) we further examined the cell cycle profile and cytological dynamics. Representative immunofluorescent images and cell cycle profiles at each time‐point are shown in Fig. 4(c). Consistent with the results of immunoblotting analysis, mitotic progression was promoted in UbcH10‐overexpressing cells, particularly at the stage of metaphase‐to‐anaphase transition.
In summary, progression of mitosis was promoted in UbcH10‐overexpressing MCF7 cells, suggesting that the promoted progression was potentially due to the metaphase‐to‐anaphase transition, where the spindle checkpoint plays important roles in proper cell cycle progression.
Clinicopathologial significance of UbcH10 in breast cancer patients. The immunohistochemical analysis results of the tissue arrays from various cancers suggest a potential function of UbcH10 in promoting breast cancer progression (Fig. 1a–d). To determine the clinical or pathological relevance of the molecular results, we performed a clinicopathological analysis of UbcH10 in breast cancer patients. In this study, using a different and independent set of over 150 breast cancer samples and normal breast epithelial samples as controls, we immunohistochemically evaluated and scored the expression levels of UbcH10. As demonstrated in Fig. 5(a), a higher UbcH10 level was detected in breast cancer tissue compared with nonmalignant normal breast epithelial tissues, which is consistent with our previous observation (Fig. 1a). Fig. 5(b) represents the images of the different expression scores of the specimens. Based on the results of the expression profile of UbcH10, we analyzed the patients’ age, tumor size (T1–4), lymph node status (N0–2), distant metastatic status (M0–1), hormone receptor status, and histological grade (G1–3) to evaluate the significance of UbcH10 in these patients.
Figure 5.
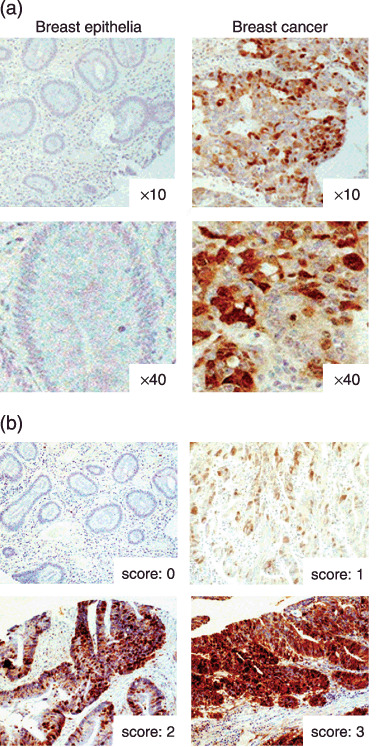
Immunohistochemical analysis of UbcH10 in breast cancer patients. (a) Representative picture of breast cancer and nonmalignant normal adjacent breast tissues examined for UbcH10. Breast cancer tissues are more frequently positive for UbcH10 compared with normal adjacent breast tissues. (b) Representative picture of negative and positive staining of tissue samples.
Of the 150 patients, 72 patients (48%) were positive for UbcH10, which is consistent with the previous observation in Fig. 1(a) (data not shown). There were no significant differences in the patients’ age (P = 0.341), tumor size (P = 0.740), stage of the disease (P = 0.285), and status of the hormone receptor (P = 0.914) (Table 1) between the UbcH10‐positive and ‐negative cancers. However, statistically significant differences were observed in lymph node metastasis (P = 0.013) and histological grade (P = 0.024) between UbcH10‐positive and ‐negative breast cancers, where UbcH10‐positive cancer was more frequently categorized as high histological grade tumor (Grade 3: UbcH10[–]: 4.0%, UbcH10[+]: 20.3%) and as a node‐positive tumor (LN positive: UbcH10[–]: 68.7%, UbcH10[+]: 83.9%) (Fig. 6a,b). Results of the clinicopathological analysis indicate that abundant UbcH10 correlates with high histological grade tumor, thereby suggesting that abundant UbcH10 could be associated with aggressive cellular behavior and a potentially poor prognosis for the breast cancer patient. Taken together, these results implicate UbcH10 in playing a substantial role in promoting breast progression, and UbcH10 could be a potential prognostic marker in patients with breast cancer.
Table 1.
Clinical and pathological features regarding the status of UbcH10 in patient with breast cancer
| UbcH10(–) | UbcH10(+) | P‐values | |
|---|---|---|---|
| Age | NS (0.341) | ||
| 50 > | 45 | 41 | |
| 50 ≤ | 46 | 31 | |
| Tumor size | NS (0.740) | ||
| T1 | 4 | 3 | |
| T2 | 63 | 49 | |
| T3 | 21 | 14 | |
| T4 | 3 | 6 | |
| Lymph node metastasis | 0.013* | ||
| N– | 24 | 10 | |
| N+ | 44 | 52 | |
| Stage | NS (0.285) | ||
| I & II | 54 | 31 | |
| III & IV | 18 | 16 | |
| Hormone receptor | NS (0.914) | ||
| ER(+) and/or PgR(+) | 45 | 38 | |
| ER(–) and PgR(–) | 21 | 17 | |
| Histological grade | 0.024* | ||
| 1 | 9 | 5 | |
| 2 | 63 | 46 | |
| 3 | 3 | 13 |
Analysis with χ2‐test. NS, not significant.
Figure 6.
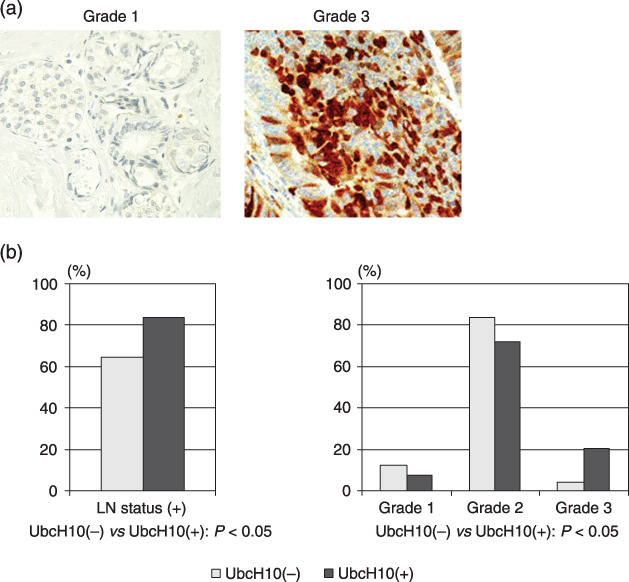
Correlation between the level of UbcH10 and histological grade of the tumor. (a) Representative picture of breast cancer tissues immunohistochemically tested for UbcH10. UbcH10 tends to be abundant in Grade 3 tumors compared with Grade 1 tumors, with no remarkable difference in its cellular localization. Regardless of the histological grade, UbcH10 is mainly detected in the nucleus. (b) Correlation between the level of UbcH10 and clinicopathological status in patients with breast cancer.
Discussion
Precise and accurate proteolytic regulation of the cell cycle machinery by the ubiquitin/proteasome system ensures proper cell cycle progression, while its deregulation is often related with cancer.( 1 , 2 , 7 , 8 , 9 ) SCF and APC, two major E3 ligases, are believed to be critical ubiquitin protein ligases that govern mitosis and G1/S progression.( 7 , 8 , 9 , 10 ) Accordingly, it is not surprising that dysfunction of the SCF or APC pathway has been implicated in many types of cancer.( 31 , 32 , 33 , 34 , 35 ) Previous study provides evidence that various E2 proteins also play important roles regulating cell cycle progression.( 26 ) Recent studies have demonstrated that a potential role of UbcH10, an E2 protein, is to promote the dissociation of Cdc20 from Mad2 and BubR1, a critical moment in the metaphase–anaphase transition, where several vital molecules are involved in organizing the spindle assembly checkpoint.( 12 , 13 , 14 ) Supplementation of UbcH10 dissociates the spindle assembly checkpoint proteins of Mad2 and BubR1 from APC/Cdc20, which is then followed by the ubiquitination of other substrates such as securin at the metaphase‐to‐anaphase transition.( 12 , 13 , 14 ) As well as these observations, it is suggested that aberrant levels of UbcH10 could be associated with the missegregation of sister chromatids resulting in chromosomal instability. The present study using molecular and clinicopathological analysis of human breast tissues addresses the significance of UbcH10‐mediated breast tumorigenesis via modulation of the cell cycle. The results confirm that the tumor‐promoting effect of UbcH10 is through regulation of cell cycle progression and advances our understanding of the carcinogenic mechanisms of UbcH10.
Involvement of UbcH10 in breast tumorigenesis through regulating the spindle assembly checkpoint. Abnormal levels of UbcH10 promote aberrant cell cycle progression and are believed to be associated with tumor progression in various types of malignant tumors.( 24 , 25 , 26 , 36 ) In particular, a recent finding suggests that UbcH10 plays an important role in proper chromatid separation in the spindle assembly checkpoint. Hence, deregulation of the spindle assembly checkpoint often leads to abrogated mitotic progression, which in turn is related to cancer progression. Results based on cultured cell studies have indicated a framework, the potential oncogenic role of UbcH10.( 24 , 36 ) Given the correlation between dysfunction of mitotic machinery and chromosomal instability, a hallmark of cancer, the demonstration of the association of UbcH10 and mitotic regulation further implicates the potential regulatory role of UbcH10 in the progression of human cancer.( 24 , 26 , 36 )
To assess the involvement of UbcH10 in breast cancer progression and address its biological function, we conducted analyses of the loss of function as well as the overexpression of UbcH10 using breast cancer cells. Our results, including those from the analyses of the overexpression and knockdown of UbcH10 in MCF10A cells (Supporting Figs S1 and 2), suggest that the aberrant activity of UbcH10 potentially leads to an increase in oncogenic potential and accelerates cell proliferation in cancer as well as in normal‐like cells (Fig. 1b,c). Overexpression or RNA interference with UbcH10 induces significant changes in cell proliferation, cell cycle profile, and the oncogenic growth potential in both breast cancer and normal‐like cells (Supporting Figs S1 and 2), which is consistent with the previous notion that aberrant levels of UbcH10 impair the mitotic machinery, alter the cell cycle profile, and enhance cell proliferation.
Modulating mitotic progression is a putative means of UbcH10 involved in tumorigenesis. The function of the spindle assembly checkpoint has been characterized as ensuring faithful separation of duplicated daughter genomes during mitosis, with the dysfunction of this system often resulting in aneuploidy–a hallmark of cancer.( 32 , 33 , 34 ) The results of epigenetic studies have drawn our attention to the correlation of the involvement of spindle assembly checkpoint molecules with tumorigenesis. Deregulation of these molecules, including Mad1, Mad2, BubR1, and Aurora A, are found in prostate, testicular, gastric, and lung cancers.( 15 , 16 , 17 , 18 , 19 , 20 ) Further, pathological analysis has demonstrated the aberrant expression of these spindle assembly checkpoint molecules in multiple types of malignant tumors.( 18 , 19 , 20 , 24 , 36 ) Previous evidence from several cell lines has established a framework for spindle assembly checkpoint involvement in tumor progression. The present results based on breast cancer tissue arrays with immunohistochemical analysis of UbcH10 are in agreement with previous results obtained from studies on cultured cells, with pathological relevance further suggesting that deregulation of the spindle assembly checkpoint may be a means of initiation or progression of cancer.
Clinicopathological analysis confirms the oncogenic role of UbcH10. We used a combinatorial approach to estimate the significance of UbcH10 in breast cancer progression. Overexpression of UbcH10 in MCF‐7 cells markedly accelerated cellular growth, while depletion of UbcH10 resulted in the suppression of the proliferation of breast cancer. The results from alteration of UbcH10 using RNA interference and overexpression verified that UbcH10 is important in promoting breast cancer.
Based on the in vitro observations, we wanted to verify the potential function of UbcH10 in promoting tumor cell growth. Therefore, we further validated the clinicopathological relevance of UbcH10 in breast cancer patients. Our data derived from a population of over 150 patients suggests that UbcH10‐negative breast cancers are associated with low histological grade tumors. Thus, UbcH10 activity may be linked to the biological characteristic of tumors.
Based on the results of our in vitro examination of UbcH10 and its clinicopathological relevance in breast cancer patients, we hypothesized that UbcH10 promotes tumor growth via deregulation of spindle assembly checkpoint, thereby leading to aberrant mitotic progression.( 24 , 36 )
In support of our results, previous demonstrations of large‐scale genetic screening have revealed that UbcH10 is one of the candidate genes related to higher histological grade tumors.( 37 , 38 ) Therefore, our assessment of the clinicopathological relevance of UbcH10 is compatible with prior epigenetic studies. In addition, biological studies demonstrated that UbcH10 was an important component of breast cancer during mitotic progression, and therefore, abnormal levels of UbcH10 may contribute to immature anaphase progression impairing appropriate chromatid separation. Furthermore, previous reports showing a lower level of p31 comet, another molecule that prevents premature anaphase‐to‐metaphase transition and acts as a potential prognostic marker in cancer, may support our present findings.( 39 , 40 ) The current opinion that a balance between the anaphase–metaphase promoters UbcH10 or p31comet and suppressor Usp44 could determine the accurate chromatid separation, further explains the significance of UbcH10 in patients with breast cancer.( 41 )
The regulatory role of UbcH10 in tumorigenesis is consistent with the current paradigm. Dysfunction of the ubiquitin/proteasome system has been strongly linked to carcinogenesis through its disruption of the balance between oncoproteins and tumor suppressor proteins, particularly in the cell cycle machinery.( 3 , 4 , 5 ) Regulation of mitotic progression is a key event during the cell cycle, and its dysregulation can lead to genomic instability and uncontrolled cellular growth. Therefore, the spindle assembly checkpoint is a critical point dictating chromatid separation during mitosis and orchestrating appropriate cell proliferation. Loss of control of this checkpoint has been correlated to a variety of malignancies.( 15 , 16 , 17 , 18 , 19 , 20 ) Our study validated the molecular paradigm of UbcH10 in breast cancer and verified the importance of an ubiquitylation regulatory cascade. Deregulation of mitotic regulation is indicated to be related with progression of cancer, where one E2 protein participates in the metaphase–anaphase transition resulting in promotion of mitotic progression. The present results from our combinatorial studies based on biochemical and immunohistochemical analyses provide further understanding of UbcH10 and its role in breast cancer.
Supporting information
1. Materials and Methods for Supporting Experiment
2. Legends for Supporting Figures
The following are attached as files named ‘Supporting Figures’
3. Supplemental Figures (Supporting Figs S1 and S2)
Please note: Wiley‐Blackwell are not responsible for the content or functionality of any supporting materials supplied by the authors. Any queries (other than missing material) should be directed to the corresponding author for the article.
Supporting info item
Supporting info item
References
- 1. Yamasaki L, Pagano M. Cell cycle, proteolysis and cancer. Curr Opin Cell Biol 2004; 16: 623–8. [DOI] [PubMed] [Google Scholar]
- 2. Pagano M. Cell cycle regulation by the ubiquitin pathway. Faseb J 1997; 11: 1067–75. [DOI] [PubMed] [Google Scholar]
- 3. Weissman AM. Themes and variations on ubiquitylation. Nat Rev Mol Cell Biol 2001; 2: 169–78. [DOI] [PubMed] [Google Scholar]
- 4. Hoeller D, Hecker CM, Dikic I. Ubiquitin and ubiquitin‐like proteins in cancer pathogenesis. Nat Rev Cancer 2006; 6: 776–88. [DOI] [PubMed] [Google Scholar]
- 5. Datto M, Wang XF. Ubiquitin‐mediated degradation a mechanism for fine‐tuning TGF‐beta signaling. Cell 2005; 121: 2–4. [DOI] [PubMed] [Google Scholar]
- 6. Gutierrez GJ, Ronai Z. Ubiquitin and SUMO systems in the regulation of mitotic checkpoints. Trends Biochem Sci 2006; 31: 324–32. [DOI] [PMC free article] [PubMed] [Google Scholar]
- 7. Pagano M, Tam SW, Theodoras AM et al . Role of the ubiquitin–proteasome pathway in regulating abundance of the cyclin‐dependent kinase inhibitor p27. Science 1995; 269: 682–5. [DOI] [PubMed] [Google Scholar]
- 8. Carrano AC, Eytan E, Hershko A, Pagano M. SKP2 is required for ubiquitin‐mediated degradation of the CDK inhibitor p27. Nat Cell Biol 1999; 1: 193–9. [DOI] [PubMed] [Google Scholar]
- 9. Sutterluty H, Chatelain E, Marti A et al . p45SKP2 promotes p27Kip1 degradation and induces S phase in quiescent cells. Nat Cell Biol 1999; 1: 207–14. [DOI] [PubMed] [Google Scholar]
- 10. Hsu JY, Reimann JD, Sorensen CS, Lukas J, Jackson PK. E2F‐dependent accumulation of hEmi1 regulates S phase entry by inhibiting APC (Cdh1). Nat Cell Biol 2002; 4: 358–66. [DOI] [PubMed] [Google Scholar]
- 11. Reimann JD, Gardber BE, Margottin‐Goguet F, Jackson PK. Emi1 is a mitotic regulator that interacts with Cdc20 and inhibits the anaphase promoting complex. Cell 2001; 105: 645–55. [DOI] [PubMed] [Google Scholar]
- 12. De Gramont A, Ganier O, Cohen‐Fix O. Before and after the spindle assembly checkpoint: an APC/C point of view. Cell Cycle 2006; 5: 2168–71. [DOI] [PubMed] [Google Scholar]
- 13. Reddy SK, Rape M, Margansky WA, Kirschner MW. Ubiquitination by the anaphase‐promoting complex drives spindle checkpoint inactivation. Nature 2007; 446: 921–5. [DOI] [PubMed] [Google Scholar]
- 14. Rape M, Reddy SK, Kirschner MW. The processivity of multiubiquitination by the APC determines the order of substrate degradation. Cell 2006; 124: 89–103. [DOI] [PubMed] [Google Scholar]
- 15. Minhas KM, Singh B, Jiang WW, Sidransky D, Califano JA. Spindle assembly checkpoint defects and chromosomal instability in head and neck squamous cell carcinoma. Int J Cancer 2003; 107: 46–52. [DOI] [PubMed] [Google Scholar]
- 16. Saeki A, Tamura S, Ito N et al . Frequent impairment of the spindle assembly checkpoint in hepatocellular carcinoma. Cancer 2002; 94: 2047–54. [DOI] [PubMed] [Google Scholar]
- 17. Kienitz A, Vogel C, Morales I, Muller R, Bastians H. Partial downregulation of MAD1 causes spindle checkpoint inactivation and aneuploidy, but does not confer resistance towards taxol. Oncogene 2005; 24: 4301–10. [DOI] [PubMed] [Google Scholar]
- 18. Hemando F, Orlow I, Liberal V, Nohales G, Benezra R, Cordon‐Cardo C. Molecular analyses of the mitotic checkpoint components hsMAD2, hBUB1 and hBUB3 in human cancer. Int J Cancer 2001; 95: 223–7. [DOI] [PubMed] [Google Scholar]
- 19. Ouyang B, Knauf JA, Ain K, Nacev B, Fagin JA. Mechanisms of aneuploidy in thyroid cancer cell lines and tissues: evidence for mitotic checkpoint dysfunction without mutations in BUB1 and BUBR1. Clin Endocrinol 2002; 56: 341–50. [DOI] [PubMed] [Google Scholar]
- 20. Meraldi P, Honda R, Nigg EA. Aurora kinases link chromosome segregation and cell division to cancer susceptibility. Curr Opin Genet Dev 2004; 14: 29–36. [DOI] [PubMed] [Google Scholar]
- 21. Anand S, Penrhyn‐Lowe S, Venkitaraman AR. AURORA‐A amplification overrides the mitotic spindle assembly checkpoint, inducing resistance to Taxol. Cancer Cell 2003; 3: 51–62. [DOI] [PubMed] [Google Scholar]
- 22. Sudo T, Nitta M, Saya H, Ueno T. Dependence of paclitaxel sensitivity on a functional spindle assembly checkpoint. Cancer Res 2004; 64: 2582–8. [DOI] [PubMed] [Google Scholar]
- 23. Weaver BA, Cleveland DW. Decoding the links between mitosis, cancer, and chemotherapy: the mitotic checkpoint, adaptation, and cell death. Cancer Cell 2005; 8: 7–12. [DOI] [PubMed] [Google Scholar]
- 24. Okamoto Y, Ozaki T, Miyazaki K, Aoyama M, Miyazaki M, Nakagawara A. UbcH10 is the cancer‐related E2 ubiquitin‐conjugating enzyme. Cancer Res 2003; 63: 4167–73. [PubMed] [Google Scholar]
- 25. Pallanto P, Berlingieri MT, Troncone G et al . UbcH10 overexpression may represent a marker of anaplastic thyroid carcinomas. Br J Cancer 2005; 93: 464–71. [DOI] [PMC free article] [PubMed] [Google Scholar]
- 26. Townsley FM, Aristarkhov A, Beck S, Hershko A, Ruderman JV. Dominant‐negative cyclin‐selective ubiquitin carrier protein E2‐C/UbcH10 blocks cells in metaphase. Proc Natl Acad USA 1997; 94: 2362–7. [DOI] [PMC free article] [PubMed] [Google Scholar]
- 27. Kolligs FT, Hu G, Dang CV, Fearon ER. Neoplastic transformation of RK3E by mutant beta‐catenin requires deregulation of Tcf/Lef transcription but not activation of c‐myc expression. Mol Cell Biol 1999; 19: 5696–706. [DOI] [PMC free article] [PubMed] [Google Scholar]
- 28. Guo P, Imanishi Y, Cackowski FC et al . Up‐regulation of angiopoietin‐2, matrix metalloprotease‐2, membrane type 1 metalloprotease, and laminin 5 gamma 2 correlates with the invasiveness of human glioma. Am J Pathol 2005; 166: 877–90. [DOI] [PMC free article] [PubMed] [Google Scholar]
- 29. Zhang F, Lundin M, Ristimaki A et al . Ski‐related novel protein N (SnoN), a negative controller of transforming growth factor‐beta signaling, is a prognostic marker in estrogen receptor‐positive breast carcinomas. Cancer Res 2003; 63: 5005–10. [PubMed] [Google Scholar]
- 30. Lin Y, Hwang WC, Basavappa R. Structural and functional analysis of human mitotic‐specific ubiquitin‐conjugating enzyme, UbcH10. J Biol Chem 2002; 277: 21913–21. [DOI] [PubMed] [Google Scholar]
- 31. Signoretti S, Di Marcotullio L, Richardson A et al . Oncogenic role of the ubiquitin ligase subunit Skp2 in human breast cancer. J Clin Invest 2002; 110: 633–41. [DOI] [PMC free article] [PubMed] [Google Scholar] [Retracted]
- 32. Wang Q, Moyret‐Lalle C, Couzon F et al . Alterations of anaphase‐promoting complex genes in human colon cancer cells. Oncogene 2003; 22: 1486–90. [DOI] [PubMed] [Google Scholar]
- 33. Wang CX, Fisk BC, Wadehra M, Su H, Braun J. Overexpression of murine fizzy‐related (fzr) increases natural killer cell‐mediated cell death and suppresses tumor growth. Blood 2000; 96: 259–63. [PubMed] [Google Scholar]
- 34. Singhal S, Amin KM, Kruklitis R et al . Alterations in cell cycle genes in early stage lung adenocarcinoma identified by expression profiling. Cancer Biol Ther 2003; 2: 291–8. [DOI] [PubMed] [Google Scholar]
- 35. Kim JM, Sohn HY, Yoon SY et al . Identification of gastric cancer‐related genes using a cDNA microarray containing novel expressed sequence tags expressed in gastric cancer cells. Clin Cancer Res 2005; 11: 473–82. [PubMed] [Google Scholar]
- 36. Wagner KW, Sapinoso LM, El‐Rifai W et al . Overexpression, genomic amplification and therapeutic potential of inhibiting the UbcH10 ubiquitin conjugase in human carcinomas of diverse anatomic origin. Oncogene 2004; 23: 6621–9. [DOI] [PubMed] [Google Scholar]
- 37. Sotiriou C, Wirapati P, Loi S et al . Gene expression profiling in breast cancer: understanding the molecules basis of histological grade to improve prognosis. J Natl Cancer Inst 2006; 98: 262–72. [DOI] [PubMed] [Google Scholar]
- 38. Ma XJ, Salunga R, Tuggle JT et al . Gene expression profiles of human breast cancer progression. Proc Natl Acad USA 2003; 100: 5974–9. [DOI] [PMC free article] [PubMed] [Google Scholar]
- 39. Yang M, Li B, Tomchick DR, Machius M, Rizo J, Yu H, Luo X. p31comet blocks Mad2 activation through structural mimicry. Cell 2007; 131: 744–55. [DOI] [PMC free article] [PubMed] [Google Scholar]
- 40. Yun MY, Kim SB, Park S et al . Mutation analysis of p31comet gene, a negative regulator of Mad2, in human hepatocellular carcinoma. Exp Mol Med 2007; 39: 508–13. [DOI] [PubMed] [Google Scholar]
- 41. Stegmeier F, Rape M, Draviam VM et al . Anaphase initiation is regulated by antagonistic ubiquitination and deubiquitination activities. Nature 2007; 446: 876–81. [DOI] [PubMed] [Google Scholar]
Associated Data
This section collects any data citations, data availability statements, or supplementary materials included in this article.
Supplementary Materials
1. Materials and Methods for Supporting Experiment
2. Legends for Supporting Figures
The following are attached as files named ‘Supporting Figures’
3. Supplemental Figures (Supporting Figs S1 and S2)
Please note: Wiley‐Blackwell are not responsible for the content or functionality of any supporting materials supplied by the authors. Any queries (other than missing material) should be directed to the corresponding author for the article.
Supporting info item
Supporting info item