

Abstract
S‐1, an oral fluoropyrimidine derivative, has been shown to be clinically effective against various solid tumors, and preclinical studies have demonstrated activity against hepatocellular carcinoma. We conducted a phase I/II study in patients with advanced hepatocellular carcinoma to examine the pharmacokinetics, recommended dose, safety and efficacy of S‐1. In phase I, the administered dose of S‐1 was approximately 64 mg/m2 per day in three patients (level 1) and approximately 80 mg/m2 per day in six patients (level 2). There was no dose‐limiting toxicity at level 1, but two patients had dose‐limiting toxicity at level 2 (grade 3 anorexia and grade 2 rash requiring eight or more consecutive days of rest). The recommended dose was finally estimated to be 80 mg/m2 per day. There were no significant differences in the pharmacokinetics of S‐1 between patients with Child‐Pugh A and those with B. In phase II, five of 23 patients (21.7%) had partial responses. The median progression‐free survival and overall survival were 3.7 and 16.6 months, respectively. The most common toxicities of grade 3 or 4 were elevated serum aspartate aminotransferase levels, hypochromia and thrombocytopenia. In conclusion, S‐1 showed an acceptable toxicity profile and promising antitumor activity for hepatocellular carcinoma, warranting further evaluation in randomized clinical trials. (Cancer Sci 2010; 101: 2606–2611)
Hepatocellular carcinoma (HCC) is one of the most common cancers in the world. Outcomes remain poor because the disease is usually advanced and associated with hepatic impairment at diagnosis, and because of the high rate of recurrence resulting from either intrahepatic metastases from the primary tumor or multicentric lesions. As for therapy, surgical resection and percutaneous ethanol injection (PEI) or radiofrequency ablation (RFA) are considered the mainstays of treatment in patients with potentially curable disease. Transcatheter arterial chemoembolization (TACE) is the treatment of choice for noncurative HCC. Despite numerous clinical trials of a wide variety of cytotoxic agents, survival remains dismal in HCC.( 1 ) Recently, sorafenib, an oral multi‐kinase inhibitor that targets mainly Raf kinases and receptor tyrosine kinases associated with angiogenesis (vascular endothelial growth factor receptor [VEGFR]‐2/‐3 and platelet‐derived growth factor receptor [PDGFR]‐β), provided a significant survival benefit in patients with advanced HCC enrolled in placebo‐controlled, randomized, phase III trials, including Asian as well as European subjects.( 2 , 3 ) An initial phase I study in Japanese patients with HCC associated mainly with hepatitis C virus (HCV) infection showed promising antitumor activity and a favorable tolerability profile.( 4 ) However, further improvement in the treatment of advanced HCC is essential.
S‐1 is a novel, orally administered drug that combines tegafur (FT), 5‐chloro‐2,4‐dihydroxypyridine (CDHP) and oteracil potassium (Oxo) in a molar concentration ratio of 1:0.4:1.( 5 ) CDHP is a competitive inhibitor of dihydropyrimidine dehydrogenase (DPD), a metabolizing enzyme of 5‐fluorouracil (5‐FU) that is expressed in the liver. Inhibition of DPD by CDHP results in prolonged effective concentrations of 5‐FU in plasma and tumor tissue.( 6 ) Oxo, a competitive inhibitor of orotate phosphoribosyltransferase, inhibits the phosphorylation of 5‐FU in the gastrointestinal tract, thereby reducing serious 5‐FU‐related gastrointestinal toxicity.( 7 ) Clinically, S‐1 has been shown to be effective against a variety of solid tumors, with response rates ranging 21–49% in late phase II studies conducted in Japan.( 8 ) S‐1 has yet to be evaluated in patients with HCC. However, in nude rats with human HCC xenografts, S‐1 has been confirmed to have antitumor activity.( 9 )
Patients with HCC usually have various degrees of liver dysfunction because of associated liver disease and replacement of liver tissue by tumor, leading to pathophysiological changes that influence drug disposition. Decreased hepatic blood flow, extrahepatic and intrahepatic blood shunting and hepatocyte loss also alter drug metabolism, and decreased protein synthesis reduces drug binding to plasma proteins. In fact, the maximal tolerated dose (MTD) of 5‐FU given as a 5‐day continuous infusion in patients with HCC is approximately 50% of that in patients with normal organ function, and patients with cirrhosis have significantly lower clearance of 5‐FU than those without cirrhosis.( 10 ) We therefore conducted a multicenter phase I/II study to evaluate the pharmacokinetics, safety and efficacy of S‐1 monotherapy in patients with advanced HCC.
Materials and Methods
Eligibility.
Eligible patients had histologically or cytologically proved HCC that was not amenable to treatment by resection, liver transplantation, RFA, PEI or percutaneous microwave coagulation therapy (PMCT) and was not expected to respond to TACE. A hypervascular mass on computed tomography (CT) or magnetic resonance imaging (MRI) associated with a serum alpha‐fetoprotein level or a serum protein induced by vitamin K absence or antagonist (PIVKA‐II) level of more than the upper limit of normal (ULN) was considered a sufficient non‐invasive diagnostic criterion for HCC. At least one measurable lesion on CT or MRI (not including necrotic lesions caused by prior treatment) was required. Other eligibility criteria included: age of at least 20 years; Eastern Cooperative Oncology Group (ECOG) performance status (PS) of 0–2; estimated life expectancy of at least 60 days; adequate hematological function (white blood cells [WBC] ≥3000/mm3, hemoglobin ≥ 9.0 g/dL, platelets ≥ 7.0 × 10⁴/mm3); adequate hepatic function (aspartate aminotransferase [AST] and alanine aminotransferase [ALT] ≤5 times the ULN, total bilirubin ≤2.0 mg/dL, serum albumin ≥2.8 g/dL, prothrombin activity ≥40%); adequate renal function (serum creatinine ≤ULN); and a Child‐Pugh class of A or B. Prior treatment for HCC, such as resection, liver transplantation, RFA, PEI, PMCT and TACE was permitted if the treatment had been performed 30 or more days before registration in the study. Patients were excluded if they had: tumor involving more than 50% of the liver; brain or bone metastasis or vascular invasion of the main trunk and first‐order branch(es) of the portal vein, hepatic veins, hepatic arteries or bile duct; severe complications; other malignancies; or inability to comply with the protocol requirements. Written informed consent was obtained from each patient. The study was approved by the local institutional review boards at all participating centers.
Study design.
S‐1 was supplied by Taiho Pharmaceutical Co., Ltd (Tokyo, Japan) in capsules containing 20 or 25 mg of FT. Individual doses were calculated according to body surface area. The calculated dose was rounded to derive the daily dose and the number of capsules to be dispensed per patient. At each dose level, S‐1 was administered orally twice daily (after breakfast and dinner) for 28 consecutive days, followed by a 14‐day recovery period. Each treatment cycle was 42 days. If grade 3 or higher hematological toxicity, grade 2 or higher non‐hematological toxicity, grade 3 or higher elevations of AST or ALT, or grade 2 or higher increases in the serum creatinine concentration occurred, treatment with S‐1 was temporarily suspended, the dose of S‐1 was reduced, or both (minimum dose, 50 mg/day). Treatment continued until there was evidence of disease progression, or if the recovery period exceeded 28 days, the patient requested treatment to be discontinued or unacceptable toxicity developed and treatment was terminated at the discretion of the investigator. Drug compliance and accountability were carefully monitored; patients were requested to record their intake of S‐1 and other medications in a diary.
During phase I, the starting dose of S‐1 (level 1) was approximately 64 mg/m2 per day twice daily (80% of the standard dose), level 2 was approximately 80 mg/m2 per day and level 0 was approximately 50 mg/m2 per day (80% of level 1). Patients were enrolled in cohorts of three for each dose level. The dose was escalated according to the cohort and was not increased in the same patient. If none of the first three patients had dose‐limiting toxicity (DLT) during the first cycle, the dose was increased to level 2. If one or two of the first three patients had DLT, three additional patients were entered at the same dose level; if only one or two of the first six patients at level 1 had DLT, the dose was increased to level 2; if all of the first three patients or three or more of the first six patients had DLT, the dose was decreased to level 0; if none of the first three patients had DLT at level 0 or level 2, three additional patients were assigned to receive the same dose level. The DLT was defined as any of the following: (i) hematological toxicity ≥grade 4; (ii) non‐hematological toxicity ≥grade 3; (iii) AST, ALT ≥15 times the ULN; or (iv) a rest period of 8 or more consecutive days was required. The recommended dose (RD) determined in the phase I part of this study was used in phase II.
Pharmacokinetics.
Blood samples (5 mL) were obtained from each patient assigned to receive level 2 in the phase I part of the study. The samples were taken before and 1, 2, 4, 6, 8, 10 and 12 h after administration of S‐1 on days 1 and 8 of the first treatment cycle. Plasma was separated from the whole‐blood samples by centrifugation and stored at −20°C until analysis. Plasma FT concentrations were measured by high‐performance liquid chromatography with ultraviolet detection. Plasma concentrations of 5‐FU, CDHP and Oxo were measured by gas chromatography‐negative ion chemical ionization mass spectrometry, as described previously.( 11 )
Pharmacokinetic data, including the maximum plasma concentration (Cmax, ng/mL), time to reach Cmax (Tmax, h), area under the plasma‐concentration–time curve for 0–12 h (AUC0–12, ng h/mL) and the elimination half‐life (T1/2, h) were calculated by noncompartment model analysis using WinNonlin software, version 4.1 (Pharsight, Cary, NC, USA).
Assessment of efficacy and toxicity.
All patients who received at least one dose of the study drug were included in the evaluations of response and toxicity. During each course of treatment, tumor response was assessed according to the Response Evaluation Criteria in Solid Tumors (RECIST) by computed tomography (CT) or magnetic resonance imaging (MRI), with a slice thickness of no more than 5 mM.( 12 ) The primary efficacy end‐point in the phase II part of this study was the overall response rate, assessed on the basis of changes in tumor dimensions. The other end‐points were overall survival (OS) and progression‐free survival (PFS). The PFS was defined as the interval between the date of initiating treatment and the date on which disease progression was first confirmed or the date of death from any cause. Overall survival was defined at the interval from the date of initiating treatment to the date of death from any cause. Median OS and median PFS were estimated using the Kaplan–Meier method. Physical findings and the results of serum chemical and urine analyses were assessed at 2‐week intervals; vital signs were assessed as necessary. Patients were observed until death or at least 1 year after registration to determine survival status. The severity of all adverse events was evaluated according to the Common Terminology Criteria for Adverse Events, version 3.0 (CTCAE, Ver. 3.0). The duration of all adverse events and their relation to S‐1 were initially assessed by the attending physicians. Subsequently, an independent review committee reviewed data on objective response and adverse events.
Statistical considerations.
With the response rate as the primary end‐point, a total sample size of at least 23 patients was estimated to be required in the phase II portion to allow the study to have a one‐sided 5% significance level of 0.05 and a power of 70%, assuming a threshold response rate of 5% and an expected response rate of 20%.
Results
Patient characteristics and treatment.
Between May 2006 and April 2007, a total of 26 patients (nine in phase I and 17 in phase II) were enrolled at four centers in Japan. All patients were eligible for the evaluation of toxicity and efficacy. The first six patients who received dose level 2 (80 mg/m2 per day) during the phase I part of this study were included in the phase II assessment, along with the 17 other patients (a total of 23 patients in the phase II assessment). The characteristics of patients are summarized in Table 1. At the study entry, 11 of 26 (42.3%) had metastatic disease. Six patients (23.1%) had single extrahepatic metastases (lung metastases, three patients; lymph node metastasis, three patients). Four patients had two sites of metastases, including the lung, lymph nodes and adrenal glands. Of the 26 patients, 23 had received some prior treatment, including three who had received systemic chemotherapy.
Table 1.
Patient characteristics
| Level 1 (n = 3) | Level 2 (n = 23) | |
|---|---|---|
| n (%) | n (%) | |
| Median age (range) (years) | 67.0 (63–68) | 68.0 (45–78) |
| Gender | ||
| Male | 2 (66.7) | 21 (91.3) |
| Female | 1 (33.3) | 2 (8.7) |
| Virus marker | ||
| HBs (+) | 1 (33.3) | 3 (13.0) |
| HCV (+) | 1 (33.3) | 14 (60.9) |
| HBs(−), HCV(−) | 1 (33.3) | 6 (26.1) |
| Child‐Pugh classification | ||
| A | 3 (100) | 16 (69.6) |
| B | 0 (0) | 7 (30.4) |
| Stage | ||
| Stage II | 1 (33.3) | 3 (13.0) |
| Stage III | 1 (33.3) | 10 (43.5) |
| Stage IVB | 1 (33.3) | 10 (43.5) |
| Vascular invasion | 0 (0) | 2 (8.7) |
| ECOG PS | ||
| 0 | 3 (100) | 21 (91.3) |
| 1 | 0 (0) | 2 (8.7) |
| Pretreatment | ||
| TA(C)E | 2 (66.7) | 17 (73.9) |
| Surgery | 1 (33.3) | 8 (34.8) |
| RFA | 0 (0) | 7 (30.4) |
| HAI | 2 (66.7) | 6 (26.1) |
| PEI | 0 (0) | 4 (17.4) |
| Radiation | 0 (0) | 4 (17.4) |
| PMCT | 0 (0) | 3 (13.0) |
| Systemic chemotherapy | 0 (0) | 3 (13.0) |
| BCLC staging | ||
| Early | 0 (0) | 1 (4.3) |
| Intermediate | 2 (66.7) | 11 (47.8) |
| Advanced | 1 (33.3) | 11 (47.8) |
BCLC, Barcelona Clinic Liver Cancer Group; ECOG, Eastern Cooperative Oncology Group; HAI, hepatic arterial infusion; HBs, hepatitis B surface antigen; HCV, hepatitis C virus antibody; PEI, percutaneous ethanol injection; PMCT, percutaneous microwave coagulation therapy; PS, performance status; RFA, radiofrequency ablation; TACE, transcatheter arterial chemoembolization.
Dose‐limiting toxicity and RD.
None of the three patients who received dose level 1 (64 mg/m2 per day) in the phase I part of the study had DLT. At dose level 2 (80 mg/m2 per day), one patient with Child‐Pugh class B had grade 3 anorexia during the first course of treatment, but the other two patients in the same cohort had no DLT. Three additional patients were enrolled to confirm safety, and one patient with Child‐Pugh class B had a grade 2 rash; recovery required eight or more consecutive days of rest. Because two of the six patients who received level 2 had DLT, level 2 was defined as the RD for the phase II part of the study.
Treatment delivered.
Twenty‐three patients received a total of 85 cycles of treatment at dose level 2 (median, three cycles per patient; range, 1–15). The dose of S‐1 was reduced in seven patients (30.4%) or a total of nine cycles (10.6%). The most common reasons for dose reductions were rash in four patients, and elevated serum bilirubin concentrations and anorexia in two patients each (some overlap among patients). Treatment was delayed because of toxicity in 12 patients (20 cycles), most often in cycles 1 or 2. The most common reasons for toxicity‐related treatment delays were fatigue (five patients), rash (four patients) and elevated serum bilirubin concentrations (three patients). The reasons for terminating treatment were progressive disease in 19 patients (82.6%), adverse reactions in two patients (8.7%) and other reasons in two patients (8.7%; one required 28 or more consecutive days of rest, and one withdrew consent).
Toxicity.
Drug‐related adverse events occurring in all 26 patients in the phase I/II portion of the study are shown in Table 2. Treatment with S‐1 was generally well tolerated throughout the study. Grade 3 or 4 toxicity occurred in 10 of the 23 patients (43.5%) who received level 2. Most toxic effects were laboratory abnormalities. There was no grade 3 or 4 toxicity at level 1. The most common grade 3 or 4 hematological toxic effects were hypochromia (17.4%), thrombocytopenia (17.4%) and lymphopenia (13.0%); the most common grade 3 or 4 nonhematological toxic effects were elevated serum AST levels (17.4%) and elevated serum bilirubin concentrations (13.0%).
Table 2.
Toxic effects
| Toxicity | Level 1 (n = 3) | Level 2 (n = 23) | Child Pugh A (n = 16) | Child Pugh B (n = 7) | ||||
|---|---|---|---|---|---|---|---|---|
| All grades | ≥G3 | All grades | ≥G3 | All grades | ≥G3 | All grades | ≥G3 | |
| n (%) | n (%) | n (%) | n (%) | n (%) | n (%) | n (%) | n (%) | |
| All adverse events | 3 (100.0) | 0 (0.0) | 23 (100.0) | 10 (43.5) | 16 (100.0) | 8 (50.0) | 7 (100.0) | 2 (28.6) |
| Hematological | ||||||||
| Erythropenia | 1 (33.3) | 0 (0.0) | 21 (91.3) | 1 (4.3) | 14 (87.5) | 1 (6.3) | 7 (100.0) | 0 (0.0) |
| Hypochromia | 1 (33.3) | 0 (0.0) | 19 (82.6) | 4 (17.4) | 12 (75.0) | 4 (25.0) | 7 (100.0) | 0 (0.0) |
| Leukopenia | 2 (66.7) | 0 (0.0) | 18 (78.3) | 1 (4.3) | 12 (75.0) | 1 (6.3) | 6 (85.7) | 0 (0.0) |
| Lymphopenia | 2 (66.7) | 0 (0.0) | 12 (52.2) | 3 (13.0) | 7 (43.8) | 3 (18.8) | 5 (71.4) | 0 (0.0) |
| Neutropenia | 1 (33.3) | 0 (0.0) | 17 (73.9) | 1 (4.3) | 12 (75.0) | 1 (6.3) | 5 (71.4) | 0 (0.0) |
| Reduced hematocrit | 1 (33.3) | 0 (0.0) | 19 (82.6) | 1 (4.3) | 12 (75.0) | 1 (6.3) | 7 (100.0) | 0 (0.0) |
| Reduced prothrombin content | 1 (33.3) | 0 (0.0) | 19 (82.6) | 0 (0.0) | 14 (87.5) | 0 (0.0) | 5 (71.4) | 0 (0.0) |
| Thrombocytopenia | 1 (33.3) | 0 (0.0) | 18 (78.3) | 4 (17.4) | 12 (75.0) | 4 (25.0) | 6 (85.7) | 0 (0.0) |
| Non‐hematological | ||||||||
| Elevated alkaline phosphatase | 0 (0.0) | 0 (0.0) | 8 (34.8) | 1 (4.3) | 7 (43.8) | 1 (6.3) | 1 (14.3) | 0 (0.0) |
| Elevated lactate dehydrogenase | 0 (0.0) | 0 (0.0) | 15 (65.2) | 0 (0.0) | 9 (56.3) | 0 (0.0) | 6 (85.7) | 0 (0.0) |
| Elevated serum AST | 1 (33.3) | 0 (0.0) | 8 (34.8) | 4 (17.4) | 6 (37.5) | 3 (18.8) | 2 (28.6) | 1 (14.3) |
| Elevated serum bilirubin | 0 (0.0) | 0 (0.0) | 18 (78.3) | 3 (13.0) | 13 (81.3) | 2 (12.5) | 5 (71.4) | 1 (14.3) |
| Hyponatremic | 0 (0.0) | 0 (0.0) | 8 (34.8) | 0 (0.0) | 5 (31.3) | 0 (0.0) | 3 (42.9) | 0 (0.0) |
| Reduced cholinesterase | 2 (66.7) | 0 (0.0) | 18 (78.3) | 0 (0.0) | 13 (81.3) | 0 (0.0) | 5 (71.4) | 0 (0.0) |
| Reduced serum albumin | 0 (0.0) | 0 (0.0) | 18 (78.3) | 2 (8.7) | 12 (75.0) | 1 (6.3) | 6 (85.7) | 1 (14.3) |
| Reduced total protein | 0 (0.0) | 0 (0.0) | 11 (47.8) | 0 (0.0) | 8 (50.0) | 0 (0.0) | 3 (42.9) | 0 (0.0) |
| Anorexia | 1 (33.3) | 0 (0.0) | 18 (78.3) | 2 (8.7) | 13 (81.3) | 1 (6.3) | 5 (71.4) | 1 (14.3) |
| Ascites | 0 (0.0) | 0 (0.0) | 7 (30.4) | 0 (0.0) | 3 (18.8) | 0 (0.0) | 4 (57.1) | 0 (0.0) |
| Diarrhea | 0 (0.0) | 0 (0.0) | 10 (43.5) | 0 (0.0) | 8 (50.0) | 0 (0.0) | 2 (28.6) | 0 (0.0) |
| Fatigue | 0 (0.0) | 0 (0.0) | 19 (82.6) | 2 (8.7) | 13 (81.3) | 2 (12.5) | 6 (85.7) | 0 (0.0) |
| Pigmentation | 0 (0.0) | 0 (0.0) | 20 (87.0) | 0 (0.0) | 14 (87.5) | 0 (0.0) | 6 (85.7) | 0 (0.0) |
| Rash | 0 (0.0) | 0 (0.0) | 8 (34.8) | 0 (0.0) | 5 (31.3) | 0 (0.0) | 3 (42.9) | 0 (0.0) |
| Stomatitis | 0 (0.0) | 0 (0.0) | 7 (30.4) | 0 (0.0) | 5 (31.3) | 0 (0.0) | 2 (28.6) | 0 (0.0) |
Dosage level, level 1, 2 (n = 3, 23); AST, aspartate aminotransferase.
Efficacy.
A response could be evaluated in 26 patients in the phase I/II portion of the study. In the phase I part of the study (dose level 1), one patient had a partial response, one had progressive disease and the other was not evaluable. Of the 23 patients in the phase II part of the study, five (21.7%; 90% confidence interval [CI], 9.0–40.4%) responded to treatment Among the 23 patients in whom a response could be evaluated, five had a partial response, seven had stable disease, and 10 had progressive disease (Table 3). The remaining patient underwent imaging studies, but treatment was completed after one course, and continuation of stable disease for at least 6 weeks could not be confirmed. The duration of the five responses was 42, 147, 188, 238 and 371 days, respectively.
Table 3.
Efficacy in patients who received dose level 2
| Child‐Pugh A (n = 16) | Child‐Pugh B (n = 7) | Total (n = 23) | |
|---|---|---|---|
| Partial response† | 4 | 1 | 5 |
| Stable disease‡ | 5 | 2 | 7 |
| Progressive disease | 7 | 3 | 10 |
| Not evaluable | 0 | 1 | 1 |
| Response rate (90%CI)§ (%) | – | – | 23.1 (9.0–40.4) |
| Response rate (95%CI) (%) | 25.0 (7.3–52.4) | 14.3 (0.4–57.9) | 23.1 (7.5–43.7) |
| Median PFS (95% CI) (months) | 3.3 (2.3–5.1) | 3.7 (2.5–7.4) | 3.7 (2.5–5.1) |
| Median OS (95% CI) (months) | 17.8 (14.0–NA) | 14.5 (9.6–18.7) | 16.6 (14.0–24.5) |
| 1‐year survival (95% CI) (%) | – | – | 69.6 (50.8–88.4) |
| 1.5‐years survival (95% CI) (%) | – | – | 43.0 (22.6–63.5) |
| Disease control rate¶ | |||
| 6W (95% CI) (%) | – | – | 47.8 (26.8–69.4) |
| 12W (95% CI) (%) | – | – | 26.1 (10.2–48.4) |
| 24W (95% CI) (%) | – | – | 21.7 (7.5–43.7) |
†Partial response was re‐evaluated after at least 4 weeks in patients with a partial response. ‡Stable disease was reassessed after at least 6 weeks. §Response rate (90% CI) is a primary end‐point. ¶Disease control rates were respectively estimated by dividing the number of patients with no disease progression by the total number of patients. Disease control was defined as a response of complete response, partial response or stable disease. CI, confidence interval; NA, not available; OS, overall survival; PFS, progression‐free survival.
The median PFS was 3.7 months (95% CI, 2.5–5.1 months). The disease control rates at 6, 12 and 24 weeks were 47.8% (95% CI, 26.8–69.4%), 26.1% (95% CI, 10.2–48.4%) and 21.7% (95% CI, 7.5–43.7%), respectively. The PFS and OS are shown in Figure 1. The median OS was 16.6 months (95% CI, 14.0–24.5 months). Survival rates were 69.6% (95% CI, 50.8–88.4%) at 1 year and 43.0% (95% CI, 22.6–63.5%) at 1.5 years.
Figure 1.
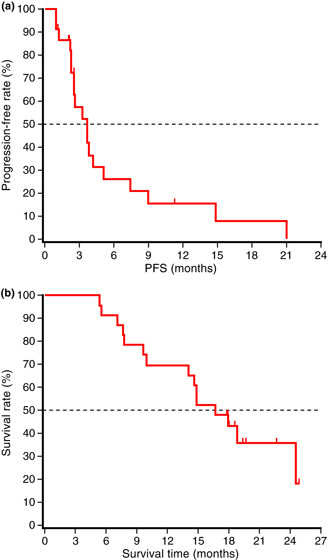
Progression‐free survival (PFS) (a) and overall survival (b) in patients who received dose level 2 of S‐1 (n = 23). The median progression‐free survival and overall survival were 3.7 and 16.6 months, respectively.
Pharmacokinetic analysis.
Table 4 shows the pharmacokinetic data for the components of S‐1 and 5‐FU at level 2 on days 1 and 8. Compared with day 1, the Cmax and AUC0‐12 of FT increased markedly on day 8; however, these increases were within the expected range given the slow elimination of FT, and repeated administration of S‐1 had no effect on the Tmax or T1/2 of FT. There was no evidence of accumulation of 5‐FU, CDHP or Oxo on day 8.
Table 4.
Pharmacokinetics of FT, 5‐FU, CDHP and Oxo on day 1 and day 8 in patients with HCC who received dose level 2
| Cmax (ng/mL) | Tmax (h) | AUC0‐12 (ng h/mL) | T1/2 (h) | ||
|---|---|---|---|---|---|
| FT | Day 1 | 2032 ± 437 | 3.3 ± 1.0 | 17070 ± 5139 | 10.1 ± 2.8 |
| Day 8 | 4365 ± 1712 | 3.7 ± 0.8 | 42399 ± 18137 | 12.7 ± 5.0 | |
| 5‐FU | Day 1 | 114.5 ± 35.5 | 4.3 ± 0.8 | 695.3 ± 223.6 | 2.3 ± 1.0 |
| Day 8 | 145.8 ± 31.4 | 4.3 ± 0.8 | 936.6 ± 292.3 | 2.4 ± 1.0 | |
| CDHP | Day 1 | 267.2 ± 76.8 | 3.3 ± 1.0 | 1424.8 ± 414.2 | 3.3 ± 0.9 |
| Day 8 | 281.0 ± 113.8 | 3.3 ± 1.0 | 1694.4 ± 603.5 | 3.4 ± 0.9 | |
| Oxo | Day 1 | 38.5 ± 1.8 | 3.7 ± 0.8 | 231.6 ± 69.8 | 4.0 ± 2.1 |
| Day 8 | 33.4 ± 9.5 | 4.0 ± 0.0 | 241.5 ± 115.6 | 4.0 ± 2.0 | |
Parameters are represented as mean ± SD. CDHP, 5‐chloro‐2,4‐dihydroxypyridine; 5‐FU, 5‐fluorouracil; FT, tegafur; Oxo, oteracil potassium.
Figure 2 compares the plasma‐concentration–time profiles of S‐1 components and 5‐FU between patients with Child‐Pugh class A and those with Child‐Pugh class B on days 1 and 8. The plasma‐concentration–time profiles of FT, 5‐FU, CDHP and Oxo were similar in patients with Child‐Pugh class A and those with Child‐Pugh class B on both days.
Figure 2.
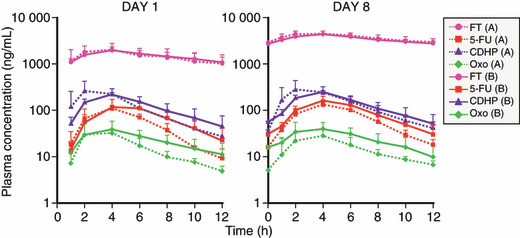
Plasma‐concentration–time profiles of tega‐fur (FT), 5‐fluorouracil (5‐FU), 5‐chloro‐2,4‐dihydroxypyridine (CDHP) and oteracil potassium (Oxo) on day 1 and day 8 were similar in patients with Child‐Pugh class A (n = 3) and those with Child‐Pugh class B (n = 3).
Discussion
There has been no established standard therapy for patients with advanced HCC refractory to surgery, transplantation, local ablation and TACE.( 13 , 14 ) Some cytotoxic regimens have produced encouraging response rates, but survival benefits have been minimal compared with control groups, at the cost of clinically unacceptable adverse effects.( 1 , 15 )
S‐1 is an anticancer drug consisting of FT, CDHP and Oxo. The conversion of FT to 5‐FU is mediated mainly by hepatic cytochrome CYP2A6.( 16 ) 5‐FU is rapidly metabolized by DPD in the liver after the intravenous administration of 5‐FU alone, but S‐1, which includes a DPD inhibitor (i.e. CDHP), produces prolonged, effective concentrations of 5‐FU in the blood. Thus, the liver plays an important role in the metabolism of FT.
The RD of S‐1 in patients with HCC was estimated to be 80 mg/m2 per day in phase I, which is similar to the dose recommended for the treatment of other solid tumors. However, in patients with HCC, Ueno et al. (10) reported that the DLT of 5‐FU administered as a 5‐day continuous infusion was stomatitis. Moreover, the MTD was equivalent to approximately 50% of that of 5‐FU in patients with normal organ function,( 10 ) suggesting that 5‐FU‐related gastrointestinal toxicity was reduced by Oxo in the formulation of S‐1. We did not determine the MTD in this study because S‐1 was approved for the treatment of other cancers. The pharmacokinetic properties of S‐1 components and 5‐FU in patients with HCC were similar to those in patients with pancreatic cancer or biliary tract cancer.( 17 , 18 )
Hematological toxic effects and symptomatic events such as pigmentation (87.0%), fatigue (82.6%), anorexia (78.3%) and ascites (30.4%) were more common than previously reported for S‐1 in patients with other cancers. Nonetheless, severe toxic effects were comparable among patients with HCC and those with other cancers. Nonhematological toxic effects related to hepatic function were also more frequent than reported previously for S‐1 in patients with other types of cancer, but such effects may have been caused by differences in underlying liver disease.
The pharmacokinetics of S‐1 did not obviously differ between patients with Child‐Pugh class A and those with Child‐Pugh class B, suggesting that hepatic dysfunction associated with Child‐Pugh class B did not affect the pharmacokinetics of S‐1 components or 5‐FU. The sample size of the pharmacokinetic evaluations was small because the primary end‐point was to determine the RD as the evaluation of DLT in phase I. At dose level 2, DLT occurred in two patients with Child‐Pugh class B (Grade 3 anorexia in one, and a Grade 2 rash requiring 8 or more consecutive days of rest in the other). There was no DLT at level 1 (given only to patients with Child‐Pugh class A). However, the patient who had DLT of grade 3 anorexia had renal dysfunction at baseline, and the plasma 5‐FU concentrations in this patient on day 8 were higher than those in other patients, perhaps contributing to the development of DLT (data not shown). In addition, there were no obvious differences in the incidence or grade of drug‐related adverse events between patients with Child‐Pugh class A and those with Child‐Pugh class B, consistent with the results of pharmacokinetic analysis. These results suggested that there were no clinically meaningful differences in pharmacokinetics or safety according to Child‐Pugh class or between patients with HCC and those with other cancers, and that S‐1 was well tolerated in patients with HCC, similar to patients with other cancers. However, our study had several limitations: only a very small number of patients with Child‐Pugh class B were included; among the patients with Child‐Pugh class B, the score was heterogeneous, ranging from 7 to 9; and only patients with better scores were studied. Therefore, extra care should be taken when S‐1 is given to patients with Child‐Pugh class B.
As for efficacy, five of 23 patients had partial responses at dose level 2. Compared with previously reported response rates obtained with single‐agent chemotherapy in patients with HCC, our results are good. In particular, the median OS appeared to be longer than that obtained with other agents in non‐Japanese studies. The reason for the better OS in Japanese patients might be similar to that previously reported for sorafenib. (4) The median OS in our study was similar to that in a Japanese phase I study of sorafenib. (4) In studies of sorafenib in non‐Japanese and Japanese patients with HCC, the median TTP and response rates were comparable, but the median OS was 15.6 months in Japanese patients compared with only 9.2 months in non‐Japanese patients.( 4 ) Differences in various treatments, including hepatic arterial infusion chemotherapy, and the palliative care of patients with progressive disease who had conditions such as hepatic decompression and variceal bleeding might be related to the longer survival time in Japanese rather than non‐Japanese patients with HCC.
In conclusion, our results suggested that S‐1 is effective and has an acceptable toxicity profile in patients with advanced HCC. Nonetheless, S‐1 should be used with caution in the presence of liver dysfunction. Sorafenib has been established to be a standard treatment for advanced HCC. Perhaps, systemic chemotherapy with S‐1 plus molecular‐targeted therapies such as sorafenib will further improve survival in patients with advanced HCC or monotherapy with S‐1 will be useful as a second‐line regimen for chemotherapy.
Disclosure Statement
J. Furuse received honoraria for lecture fees from Taiho Pharmaceutical; T. Okusaka, S. Kaneko, M. Kudo, K. Nakachi, H. Ueno, T. Yamashita and K. Ueshima have no conflict of interest.
Acknowledgments
We thank Drs T. Taguchi, M. Kurihara, K. Tanaka and K. Aiba for their kind advice, and Drs N. Moriyama, J. Tanaka and W. Koizumi for their extramural review. The authors are indebted to Peter Star of Medical Network K.K., Tokyo, Japan for his review of this manuscript. This study was supported by Taiho Pharmaceutical Co., Ltd.
Clinical trial registration: this trial was not registered in the clinical trial database because it was an early phase trial and not a controlled study.
References
- 1. Zhu AX. Systemic therapy of advanced hepatocellular carcinoma: how hopeful should we be? Oncologist 2006; 11: 790–800. [DOI] [PubMed] [Google Scholar]
- 2. Cheng AL, Kang YK, Chen Z et al. Efficacy and safety of sorafenib in patients in the Asia‐Pacific region with advanced hepatocellular carcinoma: a phase III randomised, double‐blind, placebo‐controlled trial. Lancet Oncol 2009; 10: 25–34. [DOI] [PubMed] [Google Scholar]
- 3. Llovet JM, Ricci S, Mazzaferro V et al. Sorafenib in advanced hepatocellular carcinoma. N Engl J Med 2008; 359: 378–90. [DOI] [PubMed] [Google Scholar]
- 4. Furuse J, Ishii H, Nakachi K, Suzuki E, Shimizu S, Nakajima K. Phase I study of sorafenib in Japanese patients with hepatocellular carcinoma. Cancer Sci 2008; 99: 159–65. [DOI] [PMC free article] [PubMed] [Google Scholar]
- 5. Shirasaka T, Shimamato Y, Ohshimo H et al. Development of a novel form of an oral 5‐fluorouracil derivative (S‐1) directed to the potentiation of the tumor selective cytotoxicity of 5‐fluorouracil by two biochemical modulators. Anticancer Drugs 1996; 7: 548–57. [DOI] [PubMed] [Google Scholar]
- 6. Tatsumi K, Fukushima M, Shirasaka T, Fujii S. Inhibitory effects of pyrimidine, barbituric acid and pyridine derivatives on 5‐fluorouracil degradation in rat liver extracts. Jpn J Cancer Res 1987; 78: 748–55. [PubMed] [Google Scholar]
- 7. Shirasaka T, Shimamoto Y, Fukushima M. Inhibition by oxonic acid of gastrointestinal toxicity of 5‐fluorouracil without loss of its antitumor activity in rats. Cancer Res 1993; 53: 4004–9. [PubMed] [Google Scholar]
- 8. Shirasaka T. Development history and concept of an oral anticancer agent S‐1 (TS‐1): its clinical usefulness and future vistas. Jpn J Clin Oncol 2009; 39: 2–15. [DOI] [PMC free article] [PubMed] [Google Scholar]
- 9. Yamashita T, Kaneko S, Furuse J, et al. Experimental and Early Clinical Studies of S‐1, a Novel Oral DPD Inhibitor, Chemotherapy for Advanced Hepatocellular Carcinoma. San Francisco: The American Association for the Study of Liver Diseases, 2008; Publication Number 1442. [Google Scholar]
- 10. Ueno H, Okada S, Okusaka T, Ikeda M, Kuriyama H. Phase I and pharmacokinetic study of 5‐fluorouracil administered by 5‐day continuous infusion in patients with hepatocellular carcinoma. Cancer Chemother Pharmacol 2002; 49: 155–60. [DOI] [PubMed] [Google Scholar]
- 11. Matsushima E, Yoshida K, Kitamura R, Yoshida K. Determination of S‐1 (combined drug of tegafur, 5‐chloro‐2,4‐dihydroxypyridine and potassium oxonate) and 5‐fluorouracil in human plasma and urine using high‐performance liquid chromatography and gas chromatography‐negative ion chemical ionization mass spectrometry. J Chromatogr B Biomed Sci 1997; 691: 95–104. [DOI] [PubMed] [Google Scholar]
- 12. Therasse P, Arbuck SG, Eisenhauer EA et al. New guidelines to evaluate the response to treatment in solid tumors. European Organization for Research and Treatment of Cancer, National Cancer Institute of the United States, National Cancer Institute of Canada. J Natl Cancer Inst 2000; 92: 205–16. [DOI] [PubMed] [Google Scholar]
- 13. Couto OF, Dvorchik I, Carr BI. Causes of death in patients with unresectable hepatocellular carcinoma. Dig Dis Sci 2007; 52: 3285–9. [DOI] [PubMed] [Google Scholar]
- 14. Ng KK, Poon RT, Lo CM, Yuen J, Tso WK, Fan ST. Analysis of recurrence pattern and its influence on survival outcome after radiofrequency ablation of hepatocellular carcinoma. J Gastrointest Surg 2008; 12: 183–91. [DOI] [PubMed] [Google Scholar]
- 15. Thomas M. Molecular targeted therapy for hepatocellular carcinoma. J Gastro-enterol 2009; 44: 136–41. [DOI] [PubMed] [Google Scholar]
- 16. Ikeda K, Yoshisue K, Matsushima E et al. Bioactivation of tegafur to 5‐fluorouracil is catalyzed by cytochrome P‐450 2A6 in human liver microsomes in vitro. Clin Cancer Res 2000; 6: 4409–15. [PubMed] [Google Scholar]
- 17. Ueno H, Okusaka T, Ikeda M, Takezako Y, Morizane C. Phase II study of S‐1 in patients with advanced biliary tract cancer. Br J Cancer 2004; 91: 1769–74. [DOI] [PMC free article] [PubMed] [Google Scholar]
- 18. Ueno H, Okusaka T, Ikeda M, Takezako Y, Morizane C. An early phase II study of S‐1 in patients with metastatic pancreatic cancer. Oncology 2005; 68: 171–8. [DOI] [PubMed] [Google Scholar]