

Abstract
The majority of cancer cells harbor homoplasmic somatic mutations in the mitochondrial genome. We show here that mutations in mitochondrial DNA (mtDNA) are responsible for anticancer drug tolerance. We constructed several trans‐mitochondrial hybrids (cybrids) with mtDNA derived from human pancreas cancer cell lines CFPAC‐1 and CAPAN‐2 as well as from healthy individuals. These cybrids contained the different mitochondrial genomes with the common nuclear background. We compared the mutant and wild‐type cybrids for resistance against an apoptosis‐inducing reagent and anticancer drugs by exposing the cybrids to staurosporine, 5‐fluorouracil, and cisplatin in vitro, and found that all mutant cybrids were more resistant to the apoptosis‐inducing and anticancer drugs than wild‐type cybrids. Next, we transplanted mutant and wild‐type cybrids into nude mice to generate tumors. Tumors derived from mutant cybrids were more resistant than those from wild‐type cybrids in suppressing tumor growth and inducing massive apoptosis when 5‐fluorouracil and cisplatin were administered. To confirm the tolerance of mutant cybrids to anticancer drugs, we transplanted a mixture of mutant and wild‐type cybrids at a 1:1 ratio into nude mice and examined the effect by the drugs on the drift of the ratio of mutant and wild‐type mtDNA. The mutant mtDNA showed better survival, indicating that mutant cybrids were more resistant to the anticancer drugs. Thus, we propose that mutations in the mitochondrial genome are potential targets for prognosis in the administration of anticancer drugs to cancer patients. (Cancer Sci 2009; 100: 1680–1687)
Many studies have reported various somatic mutations in mitochondrial DNA (mtDNA) in cancer cells.( 1 , 2 , 3 ) Around 70% of cancer harbors somatic mutant mtDNA,( 4 , 5 ) and preferential accumulation of somatic mutations in tumor mtDNAs contributes to tumor growth( 6 , 7 ) and regulates tumor cell metastasis.( 8 ) Furthermore, chemoresistant leukemias with more mutant mtDNA survived after chemotherapy.( 9 ) Alternatively, mtDNA mutations have been examined as clinical markers in the proliferation and infiltration of cancer.( 10 , 11 , 12 , 13 , 14 , 15 )
Most anticancer drugs, including 5‐fluorouracil (5FU) and cisplatin (CDDP) induce apoptosis,( 16 , 17 , 18 ) and it has been well established that mitochondria play an important role in apoptosis regulation.( 19 , 20 ) In the previous study, we showed that pathogenic mtDNA mutations derived from patients with mitochondrial encephalopathy suppress apoptosis induced by cisplatin;( 6 ) however, it is critical to investigate the role of mutant mtDNA derived from human cancer cells. In this study, we used human pancreatic cancer cell lines CFPAC‐1 and CAPAN‐2( 21 ) as donors of mutant mtDNA. Here, we constructed trans‐mitochondrial hybrids containing mutant mtDNAs derived from the human pancreatic cancer cell lines with the common nuclear background and show that the mutant cybrids are more resistant to staurosporine (STS), 5FU, and CDDP than wild‐type cybrids containing mtDNAs derived from healthy individuals.
Materials and Methods
Cells and cell cultures. The cells used in this study were as follows: EB8 cells( 22 ) which were derived from the 8‐azaguanine‐resistant HeLa cell line and completely lack mtDNA; two human pancreas cancer cells, CFPAC‐1 and CAPAN‐2;( 21 ) and two wild‐type cybrids carrying normal mtDNA, 9 W and A2,( 6 ) which were constructed by transferring of mitochondria prepared from two different healthy individuals into EB8 cells. CFPAC‐1 and CAPAN‐2 were obtained from the American Type Culture Collection (Manassas, VA, USA). CFPAC‐1 has four mtDNA mutations (T10970C [Trp to Arg] in the ND4 gene, T8696C [Met to Thr], T9070G [Ser to Ala] in the ATP‐6 gene, and A2905G in the 16S rRNA gene); CAPAN‐2 has two mtDNA mutations (G6267A [Ala to Thr] in the COI gene, and G10176A [Gly to Ser] in the ND3 gene).( 21 ) All cells, including the cybrids described below, were cultured in Dulbeco's modified Eagle's medium: Nutrient Mixture F‐12 (DMEM/F‐12; Invitrogen Corp.‐Gibco, Carlsbad, CA, USA) supplemented with 10% fetal bovine serum (FBS).
Construction of cybrids. The construction method of cybrids was reported previously.( 22 , 23 ) Briefly, pancreas cancer cell lines were treated with cytochalasin B (10 µg/mL; Sigma‐Aldrich, Milwaukee, WI, USA) for enucleation. The enucleated cells were fused with EB8 cells with polyethyleneglycol HYBRIMAX (Sigma‐Aldrich). Cybrids were selected in selection medium RPMI‐1640 (Invitrogen Corp.‐Gibco), where the medium lacks glucose and contains 8‐azaguanine (1 mg/L). Randomly, two clones were selected and designated Cmt15‐3 and Cmt15‐8 from CFPAC‐1, and two clones, designated Cmt4‐4 and Cmt4‐7, from CAPAN2. The nucleotide sequences were confirmed after establishment of the clones.
Characterization of mitochondria. Membrane potential and O2 consumption were measured according to the previous study.( 24 , 25 )
Cell cycle and Sub‐G1 analysis. Cells were harvested and fixed with 70% ethanol for 30 min. The cells were treated with RNaseA (10 µg/mL) at 37°C for 20 min. The cells were stained with propidium iodide (PI; 1 µM) for 15 min. Approximately 1000 cells were analyzed with a flow cytometer, EPICS Elite ESP (Beckman Coulter Inc., Fullerton, CA, USA).
Tumor‐bearing mouse model and anticancer treatment. Male BALB/c‐nu/nu nude mice (8 weeks old; Japan SLC, Hamamatsu, Shizuoka, Japan) were used. On day 0, cells (1 × 10⁶ cells in 100‐µL saline) were subcutaneously (s.c.) injected into mice. An anticancer drug, 5‐fluorouracil (5FU) (50 mg/kg; KYOWA, Tokyo, Japan) or cisplatin (CDDP) (10 mg/kg; Bristol‐Myers Squibb, New York, NY, USA) was intraperitoneally (i.p.) injected into the mice on days 2, 4, and 6, consecutively, unless otherwise stated. Tumor tissue was removed from the mice on the indicated days and analyzed as mentioned below. The tumor was measured using a caliper, and tumor volume was calculated using the formula a 2 b/2, where a and b are the shorter and longer diameters of the tumor, respectively.( 6 ) After the tissues were fixed, paraffin‐embedded sections (5 µm) were prepared from the tissues, and subjected to hematoxylin–eosin (H&E) staining. To determine the area of oncogenic necrosis, TUNEL staining (Molecular Probes, Invitrogen Corp., Carlsbad, CA, USA) was used, followed by hematoxylin counterstaining. Animals were housed and maintained under a 12‐h light–dark cycle, with ad libitum access to food and water. All experiments were performed in accordance with the guidelines of the Animal Use Ethics Committee of Nippon Medical School.
Detection of mutant mtDNA using mismatch PCR primers. To measure the ratio of wild‐type and mutant mtDNA, PCR was performed using a set of mismatch primers. For mtDNA originating from CFPAC‐1, the combination of F‐CFPAC, 5′‐acctaattgg aagcgccacc ctagcgata‐3′, corresponding to nucleotide position (np) 9041 to 9069 (revised Cambridge Reference Sequence), and R‐CFPAC, 5′‐cgtgcaggtagaggcttactagaagtgtg‐3′, corresponding to np 9196 to 9168, was used, in which the former had one mismatched nucleotide (italicized nucleotide) to generate an EcoR V site (5′‐gatatc‐3′) in the PCR products of CFPAC‐1‐originated mtDNA due to a mutation of T9070G. Restriction enzyme EcoR V can cleave the PCR products (156‐bp) of wild type mtDNA but not CFPAC‐1‐originated mtDNA. Similarly, for CAPAN2‐originated mtDNA, the combination of F‐CAPAN, 5′‐gaaaaatccaccccttacgactgc‐3′, corresponding nucleotide position (np) 10152 to 10175, and R‐CAPAN, 5′‐gtttgtagggctcatggtaggggtaa‐3′, corresponding to np 10300 to 10275, was used, in which the former had one mismatched nucleotide (italicized nucleotide) to generate a Pst I site (5′‐ctgcat‐3′) in the PCR products of CAPAN2‐originated mtDNA due to a mutation of G10176A. Restriction enzyme Pst I can cleave the PCR products (149‐bp) of CAPAN2‐originated mtDNA but not wild‐type. PCR products were treated with EcoR V for CFPAN‐1‐derived mtDNA or Pst I for CAPAN2‐derived mtDNA.
Change of ratio of mtDNAs between mutant and wild‐type cybrids. To compare tumor growth in vivo, a mutant cybrid, Cmt15‐3 or Cmt4‐4 (106 cells in 100 µL saline), was mixed with a wild‐type cybrid, A2 or 9 W (1 × 10⁶ cells in 100 µL saline) and s.c. injected into mice. The tumor was removed at the indicated time‐points from tumor‐bearing mice treated with anticancer drugs, as mentioned above. Total DNA was prepared from the tumor tissue using the QIAamp DNA Mini Kit (Qiagen, Hilden, Germany). The ratio of mutant and wild‐type mtDNA was estimated by mismatch PCR analysis as mentioned above. To compare cell growth in vitro, two kinds of cybrids were cocultured, and the ratio of mutant mtDNA with wild‐type mtDNA was obtained as above.
Results
Mutant cybrids grow more slowly than wild‐type cybrids. It is essential to investigate the role of mtDNA under the common nuclear background. Thus, we established four cybrid clones, Cmt15‐3 and Cmt15‐8 from a pancreatic cancer cell line CFPAC‐1, and Cmt4‐4 and Cmt4‐7 from CAPAN2 cells, where the nucleus is common. First, we found that mutant cybrids grow more slowly than wild‐type ones (Fig. 1a). Moreover, when two kind cybrids were cocultured, mutant mtDNAs had a disadvantage in relative increase (Fig. 1b).
Figure 1.
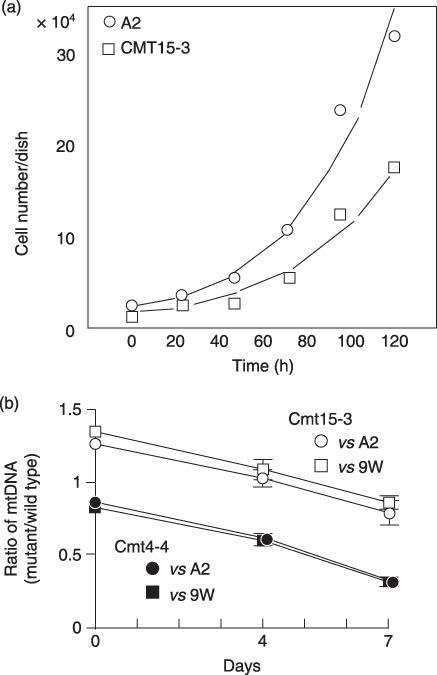
Cell growth of cybrids. (a) Cybrids (A2 or Cmt15‐3) were plated in 24‐well dishes and the cell number was counted at indicated times. (b) Two kinds of cybrids were cocultured and the ratios of mutant versus wild‐type mitochondrial DNA (mtDNA) were examined as described in ‘Materials and Methods’.
Mitochondrial activity of cybrids. Next, we examined whether mutant mtDNA affects mitochondrial activity. Mitochondrial membrane potential (ΔΨm) of mutant cybrids (Cmt15‐3, Cmt15‐8, Cmt4‐4, and Cmt4‐7) tended to be higher than wild‐type cybrids (A2 and 9 W), and O2 consumption of the mutant cybrids tended to be slower than the wild‐type cybrids; however, these changes were not significant (Fig. 2).
Figure 2.
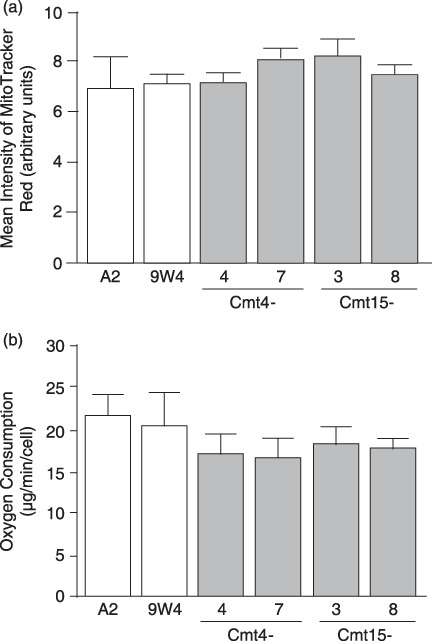
Membrane potential and oxygen consumption. (a) Membrane potential. Cells cultured in complete medium without anticancer drugs were stained with MitoTracker Red. After harvesting by trypsin treatment, approximately 10 000 cells were analyzed by flow cytometry. Means of MitoTracker Red intensity are shown with SD (vertical bars). (b) Oxygen consumption. Cells cultured in complete medium without anticancer drugs were harvested by trypsin treatment. The cells were suspended in complete medium to measure oxygen consumption using an oxygen meter. Means of three independent experiments are shown with SD (vertical bars).
In vitro resistance of mutant cybrids to anticancer drugs. Mitochondrial functions are involved in apoptosis regulation,( 19 ) and anticancer drugs 5FU and CDDP are known to induce apoptosis.( 16 , 17 ) STS is widely used as a typical inducer of apoptosis, which is characterized by cytochrome (cyt.) c release from mitochondria to the cytosol as well as nuclear morphological changes (nuclear chromatin condensation and nuclear fragmentation). In wild‐type cybrids (A2 and 9 W), STS treatment (1 µM) decreased the rate of normal nuclear morphology and increased the rate of apoptotic nuclear morphology with time ( Fig. 3a,b ). In contrast, only 10–20% of the mutant cybrids exhibited apoptotic nuclear morphology 3 and 5 h after STS treatment. Apoptotic nuclear morphology increased in a STS concentration‐dependent manner, where the rate of apoptotic nuclear morphology in Cmt15‐3 cells was around a half of that in A2 cells in the range of 0.5 to 1 µM (Fig. 3c). The Sub‐G1 populations were examined to estimate nuclear DNA fragmentation during apoptosis. STS treatment increased the Sub‐G1 populations more greatly in wild‐type cybrids than in mutant cybrids (Fig. 4). Notably, an inhibitor of cytchrome c oxidase, sodium azide, significantly prevented the increase in the Sub‐G1 population of wild‐type cybrids with STS (data not shown), suggesting that respiratory chain activity is involved in STS‐induced apoptosis. Furthermore, we investigated cyt. c release from mitochondria by immunostaining. Most cells with no treatment with STS showed great mitochondria membrane potential (ΔΨm: MitoTracker Red) and cyt. c (green) was co‐located with mitochondria (Fig. 5a upper panels). Four hours after treatment with STS, most cells of wild‐type cybrid A2 lost ΔΨm (loss of MitoTracker Red staining) and were diffusely stained with anti‐cyt. c antibody (Fig. 5a ), indicating cyt. c release to the cytosol (Fig. 5b). In contrast, Cmt15‐3 and Cm4‐4 maintained their mitochondrial membrane potential and co‐localization of cyt. c (Fig. 5a lower panels and b). These results clearly indicate that mtDNA mutations of Cmt4‐4 and Cmt15‐3 inhibit cyt. c‐dependent apoptosis.
Figure 3.
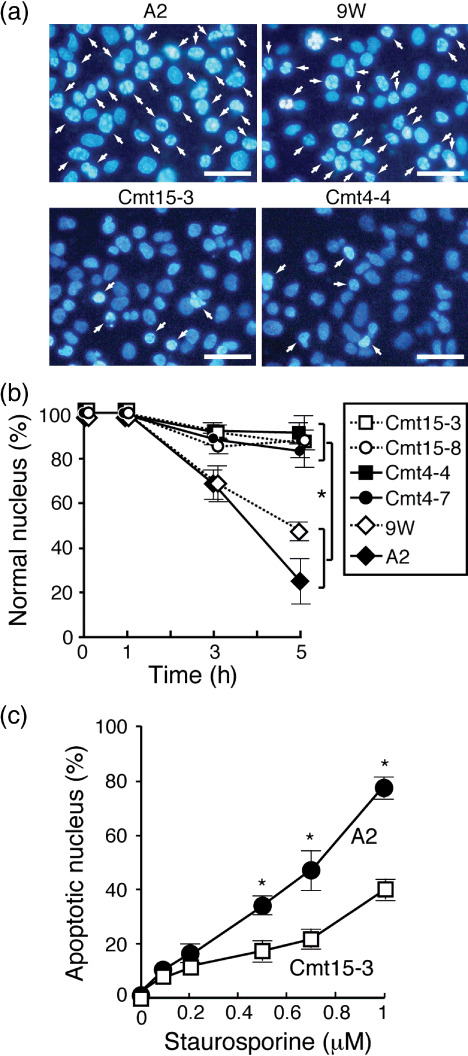
Mutant mitochondrial DNAs (mtDNAs) inhibited staurosporine (STS)‐induced nuclear apoptosis. Cells (1 × 10⁶ in a 6‐cm dish) were incubated in complete medium containing STS (1 µM) for 1, 3, and 5 h and stained with Hoechst 33342 (1 µg/mL; Takara Bio, Shiga, Japan) and propidium iodide (PI), and then imaged with a fluoromicroscope. (a) Representative images after 5‐h incubation. Many nuclei of wild‐type cybrids exhibited typical morphologies, nuclear fragmentation, and chromatin condensation (white arrows). Bars: 10 µm. (b) Ratio of normal nucleus. Apoptotic and dead cells were determined by nuclear morphology (condensation or fragmentation) under a fluorescence microscope.( 26 ) A total of 300 to 400 cells per experiment were examined to obtain the ratio of normal nuclei to total nuclei. Means of three independent experiments are shown with SD (vertical bars). *P < 0.01. (c) Cmt15‐3 and A2 cells were incubated in complete medium containing the indicated concentration of STS for 5 h. Cells were stained with Hoechst 33342 and PI to count apoptotic nucleus, as mentioned above. A total of 300 to 400 cells per experiment were examined to obtain the ratio of apoptotic nuclei to total nuclei. Means of five independent experiments are shown with SD (vertical bars). *P < 0.05.
Figure 4.
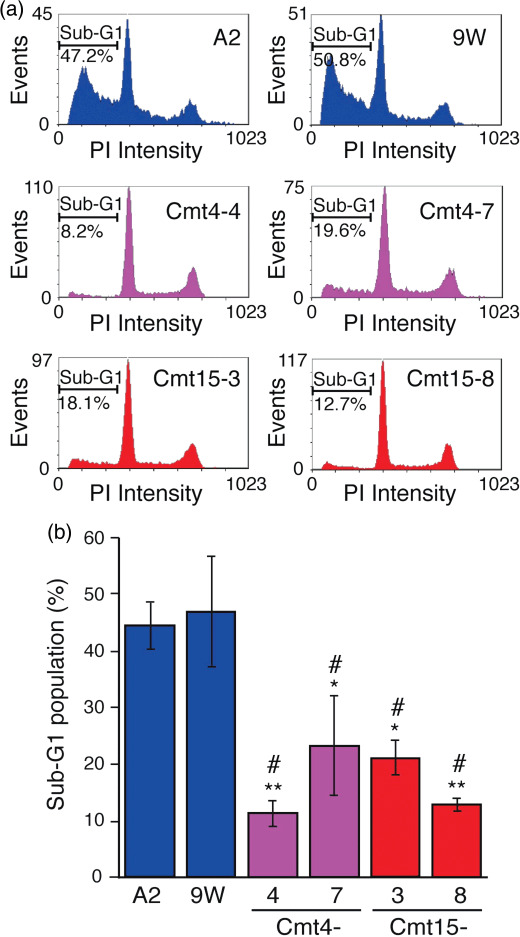
Mutant mitochondrial DNAs (mtDNAs) inhibited staurosporine (STS)‐induced nuclear DNA fragmentation. Cells were incubated in complete medium containing STS (0.5 µM) for 6 h. The cells were harvested and stained with propidium iodide (PI), followed by flow cytometry. (a) Representative charts are presented. (b) Means of the Sub‐G1 population obtained from three independent experiments (around 10 000 cells/experiment) are shown with SD (vertical bars). *P < 0.05; **P < 0.01, versus A2; #P < 0.05, versus 9 W.
Figure 5.
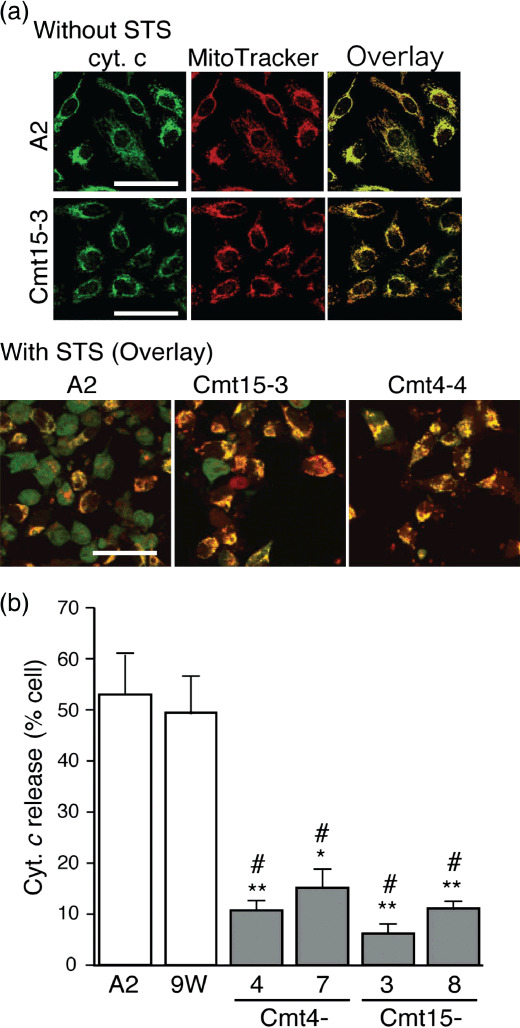
Mutant mitochondrial DNAs (mtDNAs) inhibited cytochrome (cyt.) c release. Cells were incubated in complete medium with or without staurosporine (STS) (0.5 µM) for 4 h and then treated with MitoTracker Red (red). After fixing, permeabilizing and blocking, the cells were treated with anti‐cyt. c mouse monoclonal antibody (250‐dilution; Promega, Madison, WI, USA), followed by incubation with antimouse IgG BODIPY (green) as a secondary antibody as described.(24) The cells were imaged with a confocal laser scanning microscope. (a) Upper panels: representative images of cells without STS treatment at high magnification. Lower panels: representative overlaid images of cells with STS treatment. Cells exhibiting cyt. c release were diffusely stained green. In contrast, cells without cyt. c release were stained yellow (overlay of green and red) Bar: 50 µm. (b) Population of cells exhibiting cyt. c release. Approximately 300 cells per experiment were examined to obtain the ratio of cells exhibiting cyt. c release to the total cell number. Means of the ratio from three independent experiments are shown with SD (vertical bars). Bar: 100 µm. *P < 0.05, **P < 0.001, versus A2; #P < 0.001, versus 9 W.
The chemoresistance of mutant cybrids to commonly used anticancer drugs 5FU (10 µg/mL) and CDDP (2 µg/mL) was examined. The mutant cybrids exhibited significantly higher survival rates than wild‐type cybrids (Fig. 6). It is noted that 5FU and CDDP induced typical apoptotic nuclear morphology in many cells of wild‐type cybrids, compared with mutant cybrids, as described in the STS treatment above (images not shown). In addition, CDDP (2 µg/mL) significantly increased the Sub‐G1 population of A2, but not that of Cmt4‐4.
Figure 6.
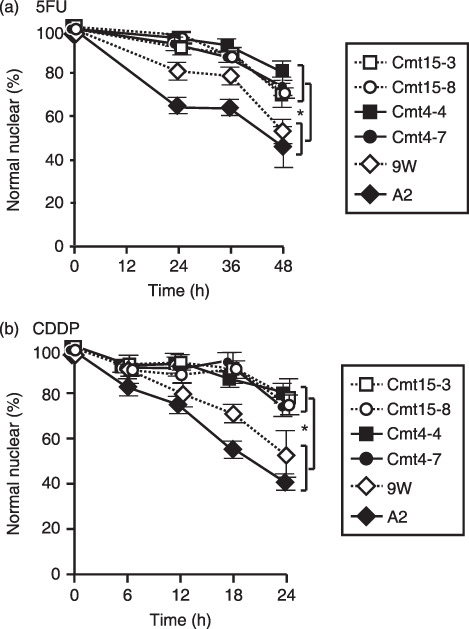
Mutant mitochondrial DNAs (mtDNAs) inhibited nuclear apoptosis induced with 5‐fluorouracil (5FU) and cisplatin (CDDP). Cells were incubated in complete medium containing 5FU or CDDP for the indicated periods. Cells were stained with Hoechst 33342 and propidium iodide (PI) and imaged with a fluoromicroscope. Approximately 400 cells per experiment were examined to obtain the ratio of normal nuclei to total nuclei. Means of five independent experiments are shown with SD (vertical bars). *P < 0.001. (a) 5FU: 10 µg/mL. (b) CDDP: 2 µg/mL.
Taken together, the mtDNA mutations derived from CFPAC‐1 and CAPAN2 contribute to the resistance of mutant cybrids to STS, 5FU, and CDDP by inhibiting apoptosis, according to in vitro experiments.
In vivo resistance of mutant cybrids to anticancer drugs. Next, we addressed whether mutant cybrids transplanted into mice also exhibit chemoresistance to anticancer drugs. Cells A2, 9 W, Cmt15‐3, or Cmt4‐4 (1 × 10⁶ cells in 100 µL saline), were s.c. injected into mice (day 0), and the mice were administered saline (control) or 5FU on days 2, 4, and 6. On day 7, the tumor tissues were removed and fixed to measure the tumor (Fig. 7). When 5FU was not administered, the tumor volume of Cmt15‐3 and Cmt4‐4 increased to almost the same extent (around 10 mm3) as those of A2 and 9 W; 5FU administration clearly reduced the tumor volumes of A2 and 9 W. On the other hand, 5FU administration was less effective at reducing the tumor volumes of Cmt15‐3 and Cmt4‐4. CDDP resistance was also pathohistologically examined by TUNEL staining.( 27 , 28 ) As CDDP exhibited stronger anticancer activity, CDDP was administered once on day 6 after the cells were injected. On day 7, tumor tissues were fixed and stained by the TUNEL method to examine massive cell death (Fig. 8). When CDDP was not administered, the massive death was observed in around 10% of the tumor tissue area, regardless of mutant or wild‐type cybrids. CDDP administration significantly increased the area of massive cell death, regardless of mutant or wild‐type cybrids; however, the massive cell death areas of Cmt15‐3 and Cmt4‐4 were more greatly reduced than those of A2 and 9 W. These results strongly suggested that Cmt15‐3 and Cmt4‐4 are resistant to 5FU and CDDP in vivo as well as in vitro.
Figure 7.
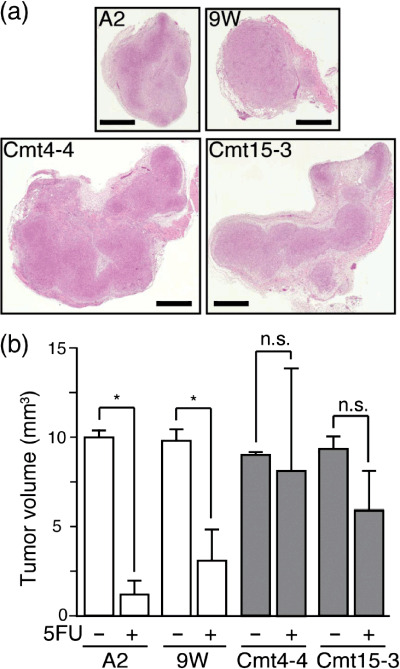
5‐Fluorouracil (5FU) could not decrease the tumor volume of mutant cybrids. On day 0, cells were s.c. injected into nude mice. 5FU (50 mg/kg) was i.p. injected into mice every second day. On day 7, tumor tissue was removed to determine tumor volume, followed by H&E staining. (a) Representative H&E‐stained tumor sections. Bars: 1 mm (b) Tumor volume. Tumor‐bearing nude mice (n= 3 each experimental group) were treated with or without 5FU as described above. On day 7, tumor volumes were measured. Means of tumor volume are shown with SD (vertical bars). *P < 0.05; n.s., not significant.
Figure 8.
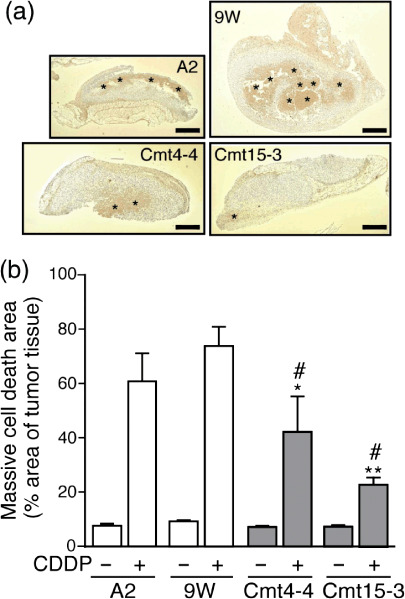
Massive apoptotic death induced cisplatin (CDDP) is reduced in mutant cybrid‐derived tumor. On day 0, cells were s.c. injected into mice. CDDP (10 mg/kg) was i.p. injected into the mice on day 6. On day 7, tumor tissue was removed from the mice to prepare paraffin‐embedded sections. To determine the area of massive apoptosis, TUNEL staining (brown) was performed, followed by hematoxylin counterstaining (purple). (a) Representative stained sections. The TUNEL‐positive area (asterisks) surrounded with growing tumor cells (purple), indicated massive apoptosis. Bars: 1 mm. (b) Massive apoptotic area. Tumor‐bearing nude mice (n= 3 each experimental group) were treated with or without CDDP as described above. Paraffin‐embedded sections with the maximum tumor area (one section/mouse) were used to calculate the areas of tumor tissue and massive apoptosis by NIH IMAGE software. Means of the ratio of massive apoptotic area to tumor tissue area are shown with SD (vertical bars). *P < 0.05, **P < 0.001, versus A2 with CDDP; #P < 0.001, versus 9 W with CDDP.
To exclude the possibility that individual physiological and/or pathological differences among the mice used above may affect chemoresistance, the mixture of the same cell number of Cmt15‐3 and A2 or Cmt4‐4 and 9 W was co‐injected into mice (day 0). 5FU or CDDP was administered every second day. The tumor tissues were removed on day 7 for 5FU and on day 5 for CDDP to prepare total DNA. When 5FU or CDDP was not administered, the ratio of mutant mtDNA was reduced, compared with on day 0, suggesting that wild‐type cybrids grow faster than mutant cybrids in tumor tissue (Fig. 9a). On the other hand, when 5FU or CDDP was administered, the mtDNA contents did not decrease to the same levels as those without drug administration, although there was no significant difference between co‐injections of Cmt4‐4/9 W with or without CDDP treatment (Fig. 9b,c). It was confirmed that the ratio of mtDNA to nuclear DNA in each cybrid used here was unchanged during the experiments, regardless of whether the cell grew in tumor tissue or in vitro culture, by Southern blot analysis (data not shown). These results clearly demonstrate that Cmt15‐3 and Cmt4‐4 are resistant to 5FU and CDDP, and survive anticancer drug administration.
Figure 9.
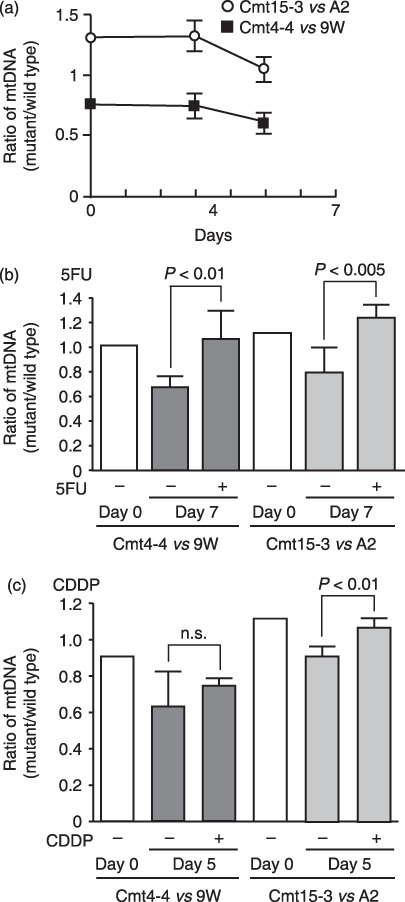
Mutant mitochondrial DNA (mtDNA) content in tumor tissues using mismatch PCR primers. Cmt15‐3 and A2 cells, or Cmt‐4‐4 and 9 W cells, were mixed with the same cell number and s.c. co‐injected into nude mice (n= 3 each experimental group) on day 0. (a) Without anticancer drug treatment, the ratios of mutant mtDNA versus wild type were followed. (b) For 5‐fluorouracil (5FU), 5FU (50 mg/kg) was i.p. administered on days 2, 4, and 6, and tumor tissues were removed on day 7 to prepare total DNA. (c) For cisplatin (CDDP), CDDP (10 mg/kg) was i.p. administered on days 2 and 4, and tumor tissues were removed on day 5 to prepare total DNA. DNA was amplified using a combination of primers, F‐CFPAC and R‐CFPAC, for co‐injection of Cmt15‐3 and A2 cells, or F‐CAPAN and R‐CAPAN for co‐injection of Cmt‐4‐4 and 9 W. After digestion with a restriction enzyme, EcoR V or Pst I, PCR products were subjected to polyacrylamide gel electrophoresis and stained with SYBER Green. The stained gels were imaged with a fluoroimage analyzer. Fluorescent intensity of the stained DNA fragments was quantified with NIH IMAGE software to obtain the content ratio of mutant‐type mtDNA to wild‐type mtDNA. Means of three independent experiments are shown with SD (vertical bars). n.s., not significant.
Discussion
This study presents evidence that mtDNA mutations derived from human tumors contribute to chemoresistance against anticancer drugs in vivo as well as in vitro. It has been reported that various mtDNA mutations frequently occur in human cancer cells,( 1 , 2 , 3 , 4 , 5 , 28 , 29 , 30 , 31 ) which has led many researchers to investigate whether, what, or how mtDNA mutations contribute to tumorigenicity, tumor promotion,( 32 , 33 , 34 , 35 ) and tumor metastasis.( 8 , 12 , 33 ) Various mutations of nuclear DNA also occur in cancer cells. To exclude any contributions of nuclear DNA mutations, we constructed cybrids containing a common HeLa‐derived nucleus and mtDNA of interest to investigate the role of mtDNA.( 6 , 36 )
In the previous study, we showed that two different pathogenic MTATP6 mutations contribute to the promotion of tumors by preventing apoptosis, using the cybrid technique;( 6 ) however, the study had a shortcoming that the mutant mtDNA was derived from patients with mitochondrial encephalopathy. In this study, we used mtDNA derived from two human pancreatic cancer cell lines. There is a discrepancy in cell growth between the previous and present study. The MTATP6 mutant cybrids apparently grow faster than wild types, probably because spontaneous apoptosis of wild‐type cybrids overcomes a proliferation advantage. Conversely, the cybrids with the pancereatc cancer mtDNAs apparently grow more slowly than wild types, probably because the stronger pathogenicity of the pancreatic cancer mtDNAs may directly reflect the cell growth. These findings suggest the chemoresistance influenced by mtDNA does not depend upon the proliferation speed.
The pancreatic cancer cells used in this study had several mutations, which are of unknown significance. T10970C mutation in the ND4 gene (CFPAC‐1) causes an amino acid change W71R, where 71 W is conserved in all mammalian species listed in the mtSNP database (http://mtsnp.tmig.or.jp/mtsnp/index.shtml), including in platypuses, whales, rodents, and humans. Similarly, T8696C in the ATP‐6 gene (CFPAC‐1) also changes Met to Thr at amino acid residue 57, where 57 M is well conserved in the mammalian species listed in the mtSNP database. The other mutations of CFPAC‐1, T9070G (S182A) in the ATP‐6 gene, and A2905G in the 16S rRNA gene, are polymorphisms; the amino acid residue 182S of ATP‐6 is not evolutionally conserved (mtSNP database). For CAPAN‐2, the G6267A mutation in the COI gene is polymorphic, and leads to an amino acid change A122T; however, this amino acid residue 122 A is evolutionally conserved (mtSNP database). Another mutation, G10176A, in the ND3 gene causes an amino acid change G40S and is absolutely conserved in mammalian species (mtSNP database). Therefore, the mitochondrial functions of CFPA‐1 and CAPAN‐2 cells were suggested to be impaired, because evolutionally conserved amino acids are usually expected to be functionally important. Notably, an inhibitor of cytchrome c oxidase, sodium azide, significantly prevented STS‐induced apoptosis (data not shown). Taken together, it is suggested that defects in respiratory chain activity seem to be primarily involved in chemoresistance. Unexpectedly, we could find no significant change in ΔΨm, oxygen consumption, and cell cycle distribution when mutant cybrids were compared with wild‐type cybrids.( 6 ) The small changes caused only growth defects under normal condition in vitro and in vivo.
Mutant cybrids were shown to be resistant to anticancer drugs. Cell death induced by STS, 5FU, and CDDP was characterized based on nuclear morphology, the Sub‐G1 fraction and cyt. c release. The mutant cybrids apparently exhibited potential anti‐apoptotic activity against anticancer drugs. Various mechanisms, including drug uptake, efflux, metabolism, target, and apoptosis,( 36 , 37 , 38 ) have been shown to be involved in acquiring chemoresistance.
mtDNA mutations can alter nuclear gene expressions of apoptosis‐associated proteins.( 39 , 40 , 41 , 42 , 43 , 44 , 45 ) Importantly, it was recently shown that the mitochondrial respiratory chain modulates apoptosis.( 46 , 47 , 48 , 49 , 50 ) As far as we examined, we found no significant difference in ROS production between mutant and wild‐type cybrids (data not shown). It is clear that further studies are required to investigate the mechanisms of how these mtDNA mutations contribute to chemoresistance.
In conclusion, our results demonstrate that mtDNA mutations can confer chemoresistance on cancer cells. It is important to investigate (i) which mutations of mtDNA identified in cancer cells are involved in the acquisition of chemoresistance to which anticancer drugs; and (ii) to what extent mtDNA mutations contributes to chemoresistance. Drug resistance is a major obstacle in cancer chemotherapy. The identification of mutations responsible for chemoresistance would be helpful to predict the drug response of tumors before choosing effective treatment options for each patient.
References
- 1. Polyak K, Li Y, Zhu H et al . Somatic mutations of the mitochondrial genome in human colorectal tumors. Nat genet 1998; 20: 291–3. [DOI] [PubMed] [Google Scholar]
- 2. Carew JS, Huang P. Mitochondrial defects in cancer. Mol Cancer 2002; 1: 1–12. [DOI] [PMC free article] [PubMed] [Google Scholar]
- 3. Chatterjee A, Mambo E, Sidransky D. Mitochondrial DNA mutations in human cancer. Oncogene 2006; 25: 4663–74. [DOI] [PubMed] [Google Scholar]
- 4. Nishikawa M, Nishiguchi S, Shiomi S et al . Somatic mutation of mitochondrial DNA in cancerous and noncancerous liver tissue in individuals with hepatocellular carcinoma. Cancer Res 2001; 61: 1843–5. [PubMed] [Google Scholar]
- 5. Penta JS, Johnson FM, Wachsman JT, Copeland WC. Mitochondrial DNA in human malignancy. Mutat Res 2001; 488: 119–33. [DOI] [PubMed] [Google Scholar]
- 6. Shidara Y, Yamagata K, Kanamori T et al . Positive contribution of pathogenic mutations in the mitochondrial genome to the promotion of cancer by prevention from apoptosis. Cancer Res 2005; 65: 1655–63. [DOI] [PubMed] [Google Scholar]
- 7. Petros JA, Baumann AK, Ruiz‐Pesini E et al . mtDNA mutations increase tumorigenicity in prostate cancer. Proc Natl Acad Sci USA 2005; 102: 719–24. [DOI] [PMC free article] [PubMed] [Google Scholar]
- 8. Ishikawa K, Takenaga K, Akimoto M et al . ROS‐Generating Mitochondrial DNA mutations can regulate tumor cell metastasis. Science 2008; 320: 661–4. [DOI] [PubMed] [Google Scholar]
- 9. Carew JS, Zhou Y, Albitar M, Carew JD, Keating MJ, Huang P. Mitochondrial DNA mutations in primary leukemia cells after chemotherapy: clinical significance and therapeutic implications. Leukemia 2003; 17: 1437–47. [DOI] [PubMed] [Google Scholar]
- 10. Fliss MS, Usadel H, Caballero OL et al . Facile Detection of mitochondrial DNA mutations in tumors and bodily fluids. Science 2000; 287: 2017–9. [DOI] [PubMed] [Google Scholar]
- 11. Ha PK, Tong BC, Westra WH et al . Mitochondrial C‐tract alternation lesions of the head and neck: a marker for progression and clonal proliferation. Clin Cancer Res 2002; 8: 2260–5. [PubMed] [Google Scholar]
- 12. Matsuyama W, Nakagawa M, Wakimoto J, Hirotsu Y, Kawabata M, Osame M. Mitochondrial DNA mutation correlates with stage progression and prognosis in non‐small cell lung cancer. Hum Mutat 2003; 21: 441–3. [DOI] [PubMed] [Google Scholar]
- 13. Dey R, Moraes CT. Lack of oxidative phosphorylation and low mitochondrial membrane potential decrease susceptibility to apoptosis and do not modulate the protective effect of Bcl‐xL in osteosarcoma cells. J Bio Chem 2000; 275: 7087–94. [DOI] [PubMed] [Google Scholar]
- 14. Kumimoto H, Yamane Y, Nishimoto Y et al . Frequent somatic mutations of mitochondrial DNA in esophageal squamous cell carcinoma. Int J Cancer 2004; 108: 228–31. [DOI] [PubMed] [Google Scholar]
- 15. Simonnet H, Alazard N, Pfeiffer K et al . Low mitochondrial respiratory chain content correlates with tumor aggressiveness in renal cell carcinoma. Carcinogenesis 2002; 23: 759–68. [DOI] [PubMed] [Google Scholar]
- 16. King KL, Cidlowski JA. Cell cycle and apoptosis: common pathways to life and death. J Cell Biochem 1995; 58: 175–80. [DOI] [PubMed] [Google Scholar]
- 17. Meikarantz W, Schlegel R. Apoptosis and the cell cycle. J Cell Biochem 1995; 58: 160–74. [DOI] [PubMed] [Google Scholar]
- 18. Hu W, Kavanagh JJ. Anticancer therapy targeting the apoptotic pathway. Lancet Oncol 2003; 4: 721–9. [DOI] [PubMed] [Google Scholar]
- 19. Wang X. The expanding role of mitochondria in apoptosis. Gene Dev 2001; 15: 2922–33. [PubMed] [Google Scholar]
- 20. Qian W, Nishikawa M, Haque AM et al . Mitochondrial density determines the cellular sensitivity to cisplatin‐induced cell death. Am J Physiol Cell Physiol 2005; 289: C1466–C1475. [DOI] [PubMed] [Google Scholar]
- 21. Jones JB, Song JJ, Hempen PM, Parmigiani G, Hruban RH, Kern SE. Detection of mitochondrial DNA mutations in pancreatic cancer offers a ‘mass’‐ive advantage over detection of nuclear DNA mutations. Cancer Res 2001; 61: 1299–304. [PubMed] [Google Scholar]
- 22. Hayashi J, Ohta S, Kikuchi A, Takemitsu M, Goto Y, Konaka I. Introduction of disease‐related mitochondrial DNA deletions into HeLa cells lacking mitochondrial DNA results in mitochondrial dysfunction. Proc Natl Acad Sci USA 1991; 88: 10614–8. [DOI] [PMC free article] [PubMed] [Google Scholar]
- 23. King MP, Attardi G. Human cells lacking mtDNA reputation with exogenous mitochondria by complementation. Science 1989; 246: 500–3. [DOI] [PubMed] [Google Scholar]
- 24. Nakashima‐Kamimura N, Asoh S, Ishibashi Y et al . MIDAS/GPP34, a nuclear gene product, regulates total mitochondrial mass in response to mitochondrial dysfunction. J Cell Sci 2005; 118: 5357–67. [DOI] [PubMed] [Google Scholar]
- 25. Kanamori T, Nishimaki K, Asoh S et al . Truncated product of the bifunctional DLST gene involved in biogenesis of the respiratory chain. EMBO J 2003; 22: 2913–23. [DOI] [PMC free article] [PubMed] [Google Scholar]
- 26. Xue LY, Chiu SM, Oleinick NL. Staurosporine‐induced death of MCF‐7 human breast cancer cells: a distinction between caspase‐3‐dependent steps of apoptosis and the critical lethal lesions. Exp Cell Res 2003; 283: 135–145. [DOI] [PubMed] [Google Scholar]
- 27. Moleur FL, Guillermet C, Lorimier P et al . TUNEL apoptotic cell detection in tissue sections: critical evaluation and improvement. J Histchem Cytochem 1998; 46: 327–34. [DOI] [PubMed] [Google Scholar]
- 28. Wijsman JH, Jonker RR, Keijzer R, Van De Velde CJH, Van Dierendonck JH. A new method to detect apoptosis in paraffin sections: in situ end‐labeling of fragmented DNA. J Histchem Cytochem 1993; 41: 7–12. [DOI] [PubMed] [Google Scholar]
- 29. Copeland WC, Wachsman JT, Johnson FM, Penta JS. Mitochondrial DNA alternations in cancer. Cancer Invest 2002; 20: 557–69. [DOI] [PubMed] [Google Scholar]
- 30. Tamura G, Nishizuka S, Maesawa C et al . Mutations in mitochondrial control region DNA in gastric tumors of Japanese patient. Eur J Cancer 1999; 35: 316–9. [DOI] [PubMed] [Google Scholar]
- 31. Tong BC, Ha PK, Dhir K et al . Mitochondrial DNA Alternations in Thyroid Cancer. J Surg Oncol 2003; 82: 170–3. [DOI] [PubMed] [Google Scholar]
- 32. Miyazono F, Schneider PM, Metzger R et al . Mutations in the mitochondrial DNA D‐Loop region occur frequently in adenocarcinoma in Barrett's esophagus. Oncogene 2002; 21: 3780–3. [DOI] [PubMed] [Google Scholar]
- 33. Moro L, Arbini AA, Marra E, Greco M. Mitochondrial DNA depletion reduces PARP‐1 levels and promotes progression of the neoplastic phenotype in prostate carcinoma. Cell Oncol 2008; 30: 307–22. [DOI] [PMC free article] [PubMed] [Google Scholar]
- 34. Amuthan G, Biswas G, Zhang SY, Klein‐Szanto A, Vijayasarathy C, Avadhani NG. Mitochondrial‐to‐nucleus stress signaling induces phenotypic changes, tumor progression and cell invasion. EMBO J 2001; 8: 1910–20. [DOI] [PMC free article] [PubMed] [Google Scholar]
- 35. Amuthan G, Biswas G, Ananadatheerthavarada HK, Vijayasarathy C, Shephard HM, Avadhani NG. Mitochondrial stress‐induced calcium signaling, phenotypic changes and invasive behavior in human lung carcinoma A549 cells. Oncogene 2002; 21: 7839–49. [DOI] [PubMed] [Google Scholar]
- 36. Moro L, Arbini AA, Yao JL, Di Sant’agnese PA, Marra E, Greco M. Mitochondrial DNA depletion in prostate epithelial cells promotes anoikis resistance and invasion through activation of PI3K/Akt2. Cell Death Differ 2009; 16: 571–83. [DOI] [PubMed] [Google Scholar]
- 37. Ohta S. Contribution of somatic mutations in the mitochondrial genome to the development of cancer and tolerance against anticancer drugs. Oncogene 2006; 25: 4768–76. [DOI] [PubMed] [Google Scholar]
- 38. Morrow CS, Cowan KH. Mechanisms of antineoplastic drug resistance. In: DeVita VT Jr, Hellman S, Rosenberg SA, eds. Cancer: Principles and Practice of Oncology. Philadelphia, PA: J. B. Lippincott, 1993; 340–8. [Google Scholar]
- 39. Pérez‐Tomás R. Multidrug resistance: retrospect and prospects in anti‐cancer drug treatment. Curr Med Chem 2006; 13: 1859–76. [DOI] [PubMed] [Google Scholar]
- 40. De Bruin EC, Medema JP. Apoptosis and non‐apoptotic deaths in cancer development and treatment response. Cancer Treat Rev 2008; 34: 737–49. [DOI] [PubMed] [Google Scholar]
- 41. Singh KK, Russell J, Sigala B, Zhang Y, Williams J, Keshav KF. Mitochondrial DNA determines the cellular response to cancer therapeutic agents. Oncogene 1999; 18: 6641–6. [DOI] [PubMed] [Google Scholar]
- 42. Mott JL, Zhang D, Chang SW, Zassenhaus HP. Mitochondrial DNA mutations cause resistance to opening of the permeability transition pore. Biochim Biophys Acta 2006; 1757: 596–603. [DOI] [PubMed] [Google Scholar]
- 43. Biswas G, Guha M, Avadhani NG. Mitochondria‐to‐nucleus stress signaling in mammalian cells: nature of nuclear gene targets, transcription regulation, and induced resistance to apoptosis. Gene 2005; 354: 132–9. [DOI] [PMC free article] [PubMed] [Google Scholar]
- 44. Zhang D, Mott JL, Chang SW, Stevens M, Mikolajczak P, Zassenhaus HP. Mitochondrial DNA mutations activate programmed cell survival in the mouse heart. Am J Physiol-Heart C 2005; 288: 2476–83. [DOI] [PubMed] [Google Scholar]
- 45. Yen HC, Tang YC, Chen FY, Chen SW, Majima HJ. Enhancement of cisplatin‐induced apoptosis and caspase 3 activation by depletion of mitochondrial DNA in a human osteosarcoma cell line. Ann NY Acad Sci 2005; 1042: 516–22. [DOI] [PubMed] [Google Scholar]
- 46. Abu‐Amero K, Alzahrani AS, Zou M, Shi Y. High frequency of somatic mitochondrial mutations in human thyroid carcinomas and complex 1 respiratory defect in thyroid cancer cell lines. Oncogene 2005; 24: 1455–60. [DOI] [PubMed] [Google Scholar]
- 47. Kwong JQ, Henning MS, Starkov AA, Manfredi G. The mitochondrial respiratory chain is a modulator of apoptosis. J Cell Biol 2007; 179: 1163–77. [DOI] [PMC free article] [PubMed] [Google Scholar]
- 48. Gallardo ME, Moreno‐Loshuertos R, López C et al . m.6267G>A: a recurrent mutation in the human mitochondrial DNA that reduces cytochrome c oxidase activity and is associated with tumors. Hum Mutat 2006; 27: 575–82. [DOI] [PubMed] [Google Scholar]
- 49. Namslauer I, Brzezinski P. A mitochondrial DNA mutation linked to colon cancer results in proton leaks in cytochrome c oxidase. Proc Natl Acad Sci USA 2009; 106: 3402–7. [DOI] [PMC free article] [PubMed] [Google Scholar]
- 50. Joshi B, Li L, Taffe BG et al . Apoptosis induction by a novel anti‐prostate cancer compound, BMD188 (a fatty acid‐containing hydroxamic acid), requires the mitochondrial respiratory chain. Cancer Res 1999; 59: 4343–55. [PubMed] [Google Scholar]