

Abstract
MRGBP (MORF4‐related gene‐binding protein; also known as chromosome 20 open reading frame 20) encodes a subunit of the transformation/transcription domain‐associated protein (TRRAP)/tat‐interacting protein 60 (TIP60)‐containing histone acetyltransferase complex. We previously showed that MRGBP was upregulated in the majority of colorectal tumors, and the enhanced expression was associated with cell proliferation. In this study, we investigated its role in colorectal carcinogenesis and searched for genes regulated by MRGBP. Immunohistochemical staining of 22 adenomas and 47 carcinomas in the colon and rectum showed that high levels of MRGBP expression were observed more frequently in carcinomas (45%) than adenomas (5%), linking its role to malignant properties of colorectal tumors. No clinicopathological factors were associated with the levels MRGBP expression in colorectal cancer. Copy number analysis revealed that gene amplification is involved in the elevated expression. A genome‐wide expression analysis identified a total of 41 genes upregulated by MRGBP. These genes were implicated in biological processes, including DNA replication, minichromosome maintenance, and cell division. Theses results suggest that MRGBP contributes to colorectal carcinogenesis through rendering advantages in cell proliferation and/or division of cancer cells. Our findings might be helpful for the identification of a specific biomarker for colorectal cancer and the development of diagnostic and/or therapeutic approaches. (Cancer Sci 2011; 102: 1486–1492)
In 2009, it was estimated that 146 970 men and women were diagnosed with colorectal cancer in the USA, making it the third most commonly diagnosed cancer.( 1 ) A majority of these estimated cases were colon cancers (72%), with the remaining cancers originating in the rectum.( 2 ) In Japan, colorectal cancer is also the third cause of cancer death, third in men and first in women, and the incidence is increasing. The risk factors of sporadic colorectal cancer include increasing age, colonic polyps, and environmental factors, such as a high‐fat diet.
Recent advances have contributed to the understanding of the molecular basis of colorectal cancer. Fearon and Vogelstein( 3 ) have described the molecular basis for sporadic colon cancer as a multistep model of carcinogenesis. In this model, the accumulation of genetic events, which involves activation of oncogenes, such as K‐ras, and inactivation of tumor suppressor genes, such as tumor protein p53 (TP53) and adenomatous polyposis coli (APC), confers a growth advantage to tumor cells. Eventually, the cumulative effect of these somatic mutations leads to the development and progression of colorectal cancer cells. In addition to these genetic changes, alteration of gene expression is also involved in the carcinogenesis. Epigenetic alterations, such as aberrant DNA methylation and/or histone modification, have been recently shown to participate in some deregulated gene expression. To clarify the molecular mechanisms of colorectal cancer and discover target molecules for therapy, we previously compared expression profiles of colorectal cancers with the corresponding non‐cancerous colon tissues using cDNA microarray. As a result, we reported that genes, including SET and MYND domain containing 3 (SMYD3),( 4 ) ring finger protein 43 (RNF43),( 5 ) LEM domain containing 1 (LEMD1),( 6 ) family with sequence similarity 84, member A (FAM84A),( 7 ) peptidylprolyl isomerase (cyclophilin)‐like 1 (PPIL1),( 8 ) and chromosome 10 open reading frame 3 (C10orf3)( 9 ) were frequently upregulated in colorectal tumors compared with non‐cancerous colonic mucosa.
MORF4‐related gene‐binding protein (MRGBP), with an approved symbol of chromosome 20 open reading frame 20 (C20orf20), was found to bind directly to MRG15 and MRGX proteins that are components of the transformation/transcription domain‐associated protein (TRRAP)/tat‐interacting protein 60 (TIP60) histone acetyltransferase complex.( 10 ) However, until now, the biological function and role of MRGBP had been unknown. In our previous report, we showed that MRGBP expression was elevated in colorectal cancer tissues compared to their corresponding normal mucosa, and that knockdown of its expression by siRNA significantly reduced DNA synthesis, thereby suppressing the proliferation of colorectal cancer cells.( 11 ) These findings suggested that MRGBP is a potential therapeutic target for colorectal cancer.
To understand the role of MRGBP in colorectal carcinogenesis, we examined the expression levels of MRGBP in colorectal adenomas and carcinomas by immunohistochemical staining, and investigated clinicopathological factors associated with elevated MRGBP expression. We further explored genes whose expression was regulated by MRGBP using DNA microarray. These studies have disclosed that enhanced MRGBP expression plays an important role in the development of colorectal cancer.
Materials and Methods
Cell lines and tissue specimens. A human embryonic kidney cell line, HEK293, and colorectal cancer cell lines, HCT116, HCT‐15, SW480, SW620, DLD‐1, Caco‐2, LS174T, and HT‐29, were purchased from the American Type Culture Collection (Manassas, VA, USA). Caco‐2 cells were cultured in Eagle’s minimum essential medium containing 20% fetal bovine serum (FBS; Life Technologies, Carlsbad, CA, USA) and 1% antibiotic/antimycotic solution (Sigma, St Louis, MO, USA). The other cells were grown in appropriate media supplemented with 10% FBS and 1% antibiotic/antimycotic solution. This project was approved by the ethical committee of the Institute of Medical Science, The University of Tokyo, Tokyo, Japan (IMSUT‐IRB, 21‐14‐0806). All colorectal adenoma and carcinoma tissues and corresponding non‐cancerous tissues were obtained with informed consent from the resected specimens of patients who underwent surgery or endoscopy.
Immunohistochemical staining. The expression of MRGBP in colorectal tumors was evaluated by immunohistochemical staining using an anti‐MRGBP antibody, which was purified from the sera of immunizing rabbits with the MRGBP protein, as described previously.( 11 ) The sections were deparaffinized with xylene. Endogenous peroxidase activity was inhibited by treatment with 0.3% H2O2 in methanol. Non‐specific binding was blocked with 3% bovine serum albumin in a humidified chamber for 30 min at room temperature, followed by overnight incubation in anti‐MRGBP antibody (dilution: 1:200) at 4°C. After washing, the tissue–antibody reaction was visualized using the SAB‐PO peroxidase immunostaining system, according to the instructions of the manufacturer (Nichirei, Tokyo, Japan). Hematoxylin was used for nuclear counterstaining. Each stain result was subdivided into three groups, according to the percentage of positive stains in tumor cells (−, <10%; +, 10–50%; ++, >50%).
Quantitative polymerase chain reaction and gene amplification analysis. One microgram of total RNA was reversely transcribed for single‐stranded cDNA using oligo(dT)18 primer with Transcriptor reverse transcriptase (Roche Diagnostics, Indianapolis, IN, USA). Real‐time polymerase chain reaction (PCR) was performed using the LightCycler 480 system (Roche Diagnostics). The probes and primers for MRGBP and hypoxanthine phosphoribosyltransferase1 (HPRT1) are as follows; MRGBP: forward, 5′‐GGAGGAGACAGTGGTGTGG‐3′, reverse, 5′‐CATGTGG‐AAGTGTCGGTTCA‐3′, and probe, Universal ProbeLibrary #39; HPRT1: forward, 5′‐TGACCTTGATTTATTTTGCATA‐CC‐3′, reverse, 5′‐CGAGCAAGACGTTCAGTCCT‐3′, and probe, Universal ProbeLibrary #73. For copy number analysis, genomic DNA were extracted from colorectal cancer cell lines, and real‐time PCR was performed using TaqMan copy number reference assays RNase P and the ABI PRISM 7900ht sequence detection system (Life Technologies). Copy numbers of MRGBP and ribonuclease P RNA component H1 (RPPH1) were analyzed by CopyCaller Software (Life Technologies). The probe and primers for the detection of the MRGBP copy number are as follows: forward, 5′‐GGCGCGCTTTCAAACG‐3′; reverse, 5′‐GCGGGCAAGAAAGAAGTTCC‐3′, and probe, 5′‐TCAG‐GTTTCCTACCTTCCGGCTGCTT‐3′. The relative amplification level of the MRGBP in colorectal cancer cell lines was determined by normalizing the results to those in human embryonic kidney cells, HEK293.
Gene expression profiling of MRGBP knockdown cells. Enhanced green fluorescent protein (EGFP) or MRGBP siRNA (ON‐TARGETplus SMARTpool human MRGBP; Thermo Fisher Scientific, Lafayette, CO, USA) was transfected into SW480 cells (at a concentration of 20 nM) using Lipofectamine RNAiMAX (Life Technologies), and the cells were maintained for 48 h. Target sequences of SMARTpool MRGBP siRNA were 5′‐GAGAAUUUGUAGCGGUUAU‐3′, 5′‐GUGACAUGGAUUAGCGCUA‐3′, 5′‐ACAAAGUCCUGACCGCAAA‐3′, and 5′‐CAG‐GGAAAACCUCGGAUUA‐3′. The knockdown effect on MRGBP was evaluated by western blotting.( 11 ) To exclude off‐target effects of EGFP siRNA, SW480 cells transfected with EGFP siRNA and non‐transfected cells were used as control cells.
After isolation of total RNA from these cells (RNeasy kit, Qiagen, Valencia, CA, USA), gene expression profiles were captured using Human Genome U133 Plus 2.0 Array GeneChip (Affymetrix, Santa Clara, CA, USA), according to the protocol of the manufacturer. Array data were processed, according to Affymetrix MAS5 algorithm implemented in the Affymetrix GeneChip operating software. Commonly upregulated or downregulated genes were identified by the comparison between MRGBP knocked‐down cells and control cells. The differentially‐expressed genes obtained from the microarray analysis were grouped into biological pathways and functions of cellular processes defined by the GO biological process, GO cellular component, GO molecular function, and KEGG pathways using the Fast Assignment and Transference of Information using Gene Ontology program (http://babelomics.org/).( 12 )
To validate microarray results, real‐time PCR was performed using SYBR Green I Master and the LightCycler 480 System. Nucleotide sequences of the primers used are shown in Table S1.
Statistical analysis. To evaluate correlations between MRGBP expression and clinicopathological characteristics, we compared tumors with MRGBP‐negative expression (−) and those with high expression (++). Fisher’s exact test was employed for the analysis, and P < 0.05 was considered statistically significant.
Results
Expression of MRGBP in colorectal adenoma and carcinoma tissues. In our previous study, we examined MRGBP expression in colorectal cancer tissues by quantitative PCR and western blot analyses. We found that MRGBP mRNA expression was elevated in 10 of 15 colorectal cancer tissues, and that MRGBP was accumulated in 10 of 14 colorectal cancer tissues.( 11 ) However, the role of its elevated expression in colorectal carcinogenesis was unclear, because its expression in adenomas had not been studied and the number of cancer tissues examined was limited. In this study, we analyzed MRGBP expression using 22 adenomas and an additional 47 carcinomas of the colon and rectum by immunohistochemical staining (Fig. 1a). We divided the tumors into three groups, (−), (+), and (++), according to the proportion of tumor cells with positive MRGBP‐staining (Fig. 1b). As a result, the 22 adenomas were comprised of 12 tumors with negative expression (−), nine with low expression (+), and one with high expression (++). However, the 47 carcinomas were classified into 15, 11, and 21 tumors with (−), (+), and (++) expression, respectively (Table 1). Of the 47 carcinomas, 32 (68%) were MRGBP‐positive tissues (+ and ++), which was consistent with our previous immunohistochemical staining results showing its elevated expression in 20 of 27 cancer tissues (74%).( 11 ) Although the frequency of MRGBP‐positive tumors between carcinomas (68%) and adenomas (45%) was not statistically different, the frequency of carcinomas with high MRGBP‐expression (45%) was significantly higher than that of adenomas (5%; P = 0.003) (Table 1). Therefore, the accumulation of MRGBP might be implicated in the malignant transformation from adenoma to carcinoma in colorectal carcinogenesis. There were two cases in which the adenoma was obtained for the removal of a coexisting carcinoma in the same patient. In both cases, the expression of MRGBP was low (+) in the adenoma, but high (++) in the carcinoma, corroborating enhanced MRGBP expression after the transformation.
Figure 1.
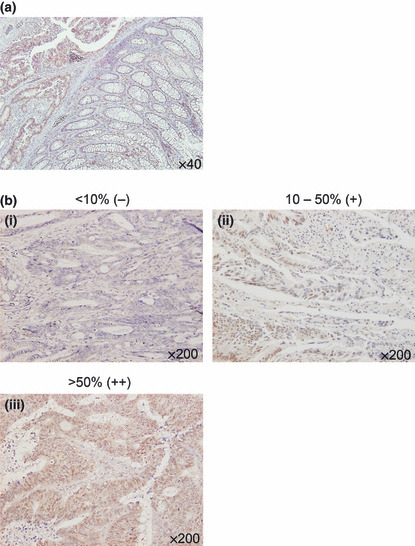
(a) Representative image of immunohistochemical staining of MRGBP in a human colon containing cancer cells and adjacent normal mucosa. Magnification: ×40. (b) Staining frequency of carcinoma cells were classified into three degrees, <10% (−), 10%–50% (+), and >50% (++), of positive staining. Magnification: ×200.
Table 1.
MRGBP expression in colorectal adenomas versus carcinomas by immunohistochemistry
| Total (n = 69) | MRGBP expression | P‐value | |||
|---|---|---|---|---|---|
| − (n = 27) | + (n = 20) | ++ (n = 22) | |||
| Adenoma | 22 | 12 | 9 | 1 | 0.003 |
| Carcinoma | 47 | 15 | 11 | 21 | |
To define the role of MRGBP in colorectal cancer, we explored clinicopathological factors associated with the expression of MRGBP in the 47 carcinomas. We compared the age and sex of the patients, location, size, and histological data of tumors including depth of tumor invasion, lymph node metastasis, venous invasion, and lymphatic vessel invasion between MRGBP‐negative tumors (−) and ‐high tumors (++) (Table 2). Consequently, we found significant difference in invasion between these two groups (P = 0.02); T4 invasion was observed in four of 21 tumors with MRGBP‐high expression, but in nine of 15 tumors with negative expression. However, the decrease of tumors with MRGBP‐high expression in the T4 tumors is inconsistent with its elevated expression in the development of carcinogenesis. Thus, the difference might be due to the limited number of tumors with T4 invasion. Further investigation might be needed to determine the discrepancy. None of the other factors were significantly associated with the expression levels of MRGBP.
Table 2.
Correlations between MRGBP expression and the clinicopathological characteristics of the 47 colon cancer patients
| Total (n = 47) | MRGBP expression | P‐value | |||
|---|---|---|---|---|---|
| − (n = 15) | + (n = 11) | ++ (n = 21) | |||
| Age(years) | |||||
| Mean ± SD | 66.0 ± 10.4 | 66.6 ± 9.7 | 67.4 ± 11.4 | 64.8 ± 10.7 | 1.00 |
| Range | 45–86 | 52–84 | 51–85 | 45–86 | |
| Sex, n (%) | |||||
| Male | 28 (59.6) | 8 (53.3) | 4 (36.4) | 16 (76.2) | 0.18 |
| Female | 19 (40.4) | 7 (46.7) | 7 (63.6) | 5 (23.8) | |
| Location, n (%) | |||||
| Right | 21 (44.7) | 8 (53.3) | 3 (27.3) | 10 (47.6) | 1.00 |
| Left | 26 (55.3) | 7 (46.7) | 8 (72.7) | 11 (52.4) | |
| Size, n (%) | |||||
| <5 | 18 (38.3) | 6 (40.0) | 4 (36.4) | 8 (38.1) | 1.00 |
| 5≤ | 29 (61.7) | 9 (60.0) | 7 (63.6) | 13 (61.9) | |
| Differentiation, n (%) | |||||
| Well | 42 (89.4) | 13 (86.6) | 11 (100.0) | 18 (85.7) | 1.00 |
| Moderate | 3 (6.4) | 1 (6.7) | 0 (0.0) | 2 (9.5) | |
| Poor | 1 (2.1) | 1 (6.7) | 0 (0.0) | 0 (0.0) | |
| Significant | 1 (2.1) | 0 (0.0) | 0 (0.0) | 1 (4.8) | |
| Depth of tumor invasion, n (%) | |||||
| Tis | 1 (2.1) | 0 (0.0) | 0 (0.0) | 1 (4.8) | 0.02 |
| T1 | 1 (2.1) | 0 (0.0) | 0 (0.0) | 1 (4.8) | |
| T2 | 6 (12.8) | 1 (6.7) | 3 (27.3) | 2 (9.5) | |
| T3 | 23 (48.9) | 5 (33.3) | 5 (45.4) | 13 (61.9) | |
| T4 | 16 (34.1) | 9 (60.0) | 3 (27.3) | 4 (19.0) | |
| Lymphatic invasion, n (%) | |||||
| − | 6 (13.0) | 1 (7.1) | 1 (9.1) | 4 (19.0) | 0.63 |
| + | 40 (87.0) | 13 (92.9) | 10 (90.9) | 17 (81.0) | |
| Venous invasion, n (%) | |||||
| − | 12 (26.1) | 2 (14.3) | 4 (36.4) | 6 (28.6) | 0.43 |
| + | 34 (73.9) | 12 (85.7) | 7 (63.6) | 15 (71.4) | |
| Lymph node metastasis, n (%) | |||||
| − | 30 (63.8) | 9 (60.0) | 8 (72.7) | 13 (61.9) | 1.00 |
| + | 17 (36.2) | 6 (40.0) | 3 (27.3) | 8 (38.1) | |
We also compared the prognosis of the patients with colorectal cancer between MRGBP‐negative (−) and ‐high tumors (++). No significant difference was observed in the survival of patients between the two groups (data not shown).
Expression and gene amplification of MRGBP in colorectal cancer cell lines. To address the cause of elevated MRGBP expression in colorectal tumors, we compared its expression in human cancer cell lines and non‐cancerous cell lines. Quantitative PCR demonstrated that all colorectal cancer cell lines tested overexpressed MRGBP by more than twofold, compared to HEK293 cells, a transformed human embryonic kidney cell line (Fig. 2a). Elevated MRGBP protein was also observed in HCT116, HT‐29, SW480, SW620, and Caco‐2 cells (Fig. S1). To clarify the mechanism of elevated MRGBP mRNA expression in colorectal cancer, we carried out a copy number analysis of the MRGBP gene by quantitative PCR using the RPPH1 gene as a control. As a result, we found that the copy number increased more than 1.5‐fold in six of eight colorectal cancer cell lines examined, compared to HEK293 cells. Among the six cell lines, the copy numbers in HT‐29 and SW620 cells increased by 6.5‐ and 4.5‐fold, respectively (Fig. 2b). The increase in copy number was relatively well correlated with the enhanced mRNA expression in the colorectal cancer cells, although some cell lines, such as HCT‐15 and SW480, showed higher mRNA expression than the increase of copy number. These data suggested that amplification of the MRGBP gene plays at least some role in the augmented expression of MRGBP in colorectal cancer cells.
Figure 2.
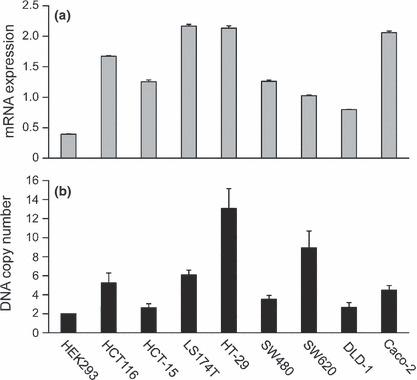
Expression (a) and copy number (b) analyses of MRGBP in eight colorectal cancer cell lines and HEK293 cells. Relative expression was analyzed by real‐time polymerase chain reaction (PCR). Quantity of MRGBP was normalized to hypoxanthine phosphoribosyltransferase1 expression (a). Copy number analysis of the MRGBP gene was performed by real‐time PCR using RNaseP as an endogenous reference (b). Copy number was calculated by dividing the PCR products by those of HEK293 cells, and multiplying by 2.
Gene expression profiling of SW480 cells transfected with MRGBP siRNA. Since MRGBP is a subunit of a transcriptional complex containing HAT activity,( 10 ) we hypothesized that MRGBP might be involved in the transcriptional regulation of genes regulated by the complex. To identify the genes regulated by MRGBP, we performed an expression profile analysis using Affymetrix human GeneChip U133 plus 2.0 representing 47 000 transcripts. SW480 cells were chosen for the microarray analysis because they showed abundant MRGBP expression (Fig. S1), and their growth was markedly suppressed by the knockdown of MRGBP.( 11 ) A decrease in MRGBP expression was confirmed at 48 h after the transfection with MRGBP siRNA (data not shown). We compared global gene expression between SW480 cells treated with the MRGBP siRNA and those with controls (without treatment and with EGFP siRNA treatment) at 48 h. Analysis of the data identified a total of 41 genes that were commonly downregulated by MRGBP siRNA from two separate experiments. Table 3 summarizes a list of the 41 genes (upregulated genes are listed in Table S2). Expectedly, MRGBP (C20orf20) was the most suppressed gene by the siRNA. For the validation of our microarray data, we selected seven genes, including SH3‐domain GRB2‐like 1 (SH3GL1), 5′‐nucleotidase domain containing 4 (NT5DC4), cell division cycle associated 7 (CDCA7), minichromosome maintenance complex component (MCM)2, mastermind‐like 1 (MAML1), chromatin licensing and DNA replication factor 1 (CDT1), and MCM5, among the 41 genes, and carried out a quantitative PCR analysis. Although the depletion of MRGBP had no effect on the expression of NT5DC4, there was a substantial decrease observed in the expression of SH3GL1, CDCA7, MCM2, MAML1, CDT1, and MCM5 in SW480 cells (Fig. 3a). To examine the link between the six genes and MRGBP expression, we assessed their expression in HCT116 cells treated with or without MRGBP siRNA. In agreement with the SW480 data, the expression of SH3GL1, CDCA7, MCM2, MAML1, CDT1, and MCM5 was clearly reduced by the knockdown of MRGBP in HCT116 cells (Fig. 3b). These data indicated high reproducibility of the microarray data.
Table 3.
Genes commonly downregulated in SW480 cells transfected with MRGBP siRNA
| Signal ratio (average)* | Gene symbol | Gene name |
|---|---|---|
| −4.33 | C20orf20 (MRGBP) | Chromosome 20 open reading frame 20 |
| −1.25 | SH3GL1 | SH3‐domain GRB2‐like 1 |
| −1.23 | NT5DC4 | 5′‐nucleotidase domain containing 4 |
| −1.13 | MRPL34 | Mitochondrial ribosomal protein L34 |
| −1.13 | ELAVL1 | ELAV (embryonic lethal, abnormal vision, Drosophila)‐like 1 (Hu antigen R) |
| −1.08 | CDCA7 | Cell division cycle associated 7 |
| −0.95 | MCM2 | Minichromosome maintenance complex component 2 |
| −0.88 | MAML1 | Mastermind‐like 1 (Drosophila) |
| −0.85 | CDT1 | Chromatin licensing and DNA replication factor 1 |
| −0.80 | TIPIN | TIMELESS interacting protein |
| −0.80 | CHMP2B | Chromatin modifying protein 2B |
| −0.80 | UBE2G2 | Ubiquitin‐conjugating enzyme E2G 2 (UBC7 homolog, yeast) |
| −0.78 | POLD1 | Polymerase (DNA directed), delta 1, catalytic subunit 125 kDa |
| −0.75 | LOC93622 | Hypothetical LOC93622 |
| −0.75 | GPATCH4 | G patch domain containing 4 |
| −0.75 | BARD1 | BRCA1 associated RING domain 1 |
| −0.75 | DHFR | Dihydrofolate reductase |
| −0.73 | NSMCE1 | Non‐SMC element 1 homolog (S. cerevisiae) |
| −0.73 | MCM5 | Minichromosome maintenance complex component 5 |
| −0.73 | CDCA5 | Cell division cycle associated 5 |
| −0.73 | TMEM97 | Transmembrane protein 97 |
| −0.73 | DHRS2 | Dehydrogenase/reductase (SDR family) member 2 |
| −0.70 | PPIL5 | Peptidylprolyl isomerase (cyclophilin)‐like 5 |
| −0.70 | MYH10 | Myosin, heavy chain 10, non‐muscle |
| −0.70 | TOMM40 | Translocase of outer mitochondrial membrane 40 homolog (yeast) |
| −0.68 | CSNK2A1 | Casein kinase 2, alpha 1 polypeptide |
| −0.68 | RCC1 | Regulator of chromosome condensation 1 |
| −0.68 | POLR3K | Polymerase (RNA) III (DNA directed) polypeptide K, 12.3 kDa |
| −0.68 | SMARCD1 | SWI/SNF related, matrix associated, actin dependent regulator of chromatin, subfamily d, member 1 |
| −0.68 | NUP93 | Nucleoporin 93 kDa |
| −0.65 | FOXM1 | Forkhead box M1 |
| −0.65 | C20orf7 | Chromosome 20 open reading frame 7 |
| −0.65 | MCM7 | Minichromosome maintenance complex component 7 |
| −0.65 | BYSL | Bystin‐like |
| −0.65 | AMD1 | Adenosylmethionine decarboxylase 1 |
| −0.63 | DCTPP1 | dCTP pyrophosphatase 1 |
| −0.63 | MAD2L1 | MAD2 mitotic arrest deficient‐like 1 (yeast) |
| −0.60 | ACOT7 | Acyl‐CoA thioesterase 7 |
| −0.60 | RFC3 | Replication factor C (activator 1) 3, 38 kDa |
| −0.60 | INTS5 | Integrator complex subunit 5 |
| −0.60 | LMNB2 | Lamin B2 |
| −0.60 | UQCRC2 | Ubiquinol‐cytochrome c reductase core protein II |
Order of genes is from average of signal log ration obtained from four experiments. *Log2 ratio.
Figure 3.
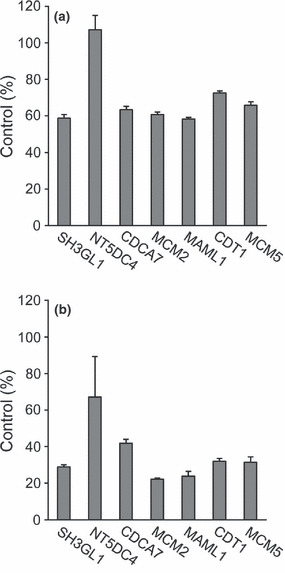
Real‐time polymerase chain reaction (PCR) analysis of seven genes identified by the microarray. Control siRNA (20 nM) or MRGBP siRNA (20 nM) was transfected into (a) SW480 and (b) HCT116 cells. Forty‐eight hours after transfection, total RNA was isolated and the expressions of SH3‐domain GRB2‐like 1 (SH3GL1), 5′‐nucleotidase domain containing 4 (NT5DC4), cell division cycle associated 7 (CDCA7), minichromosome maintenance complex component (MCM)2, mastermind‐like 1 (MAML1), chromatin licensing and DNA replication factor 1 (CDT1), and MCM5 were analyzed by real‐time PCR. GAPDH was used as a normalization control.
The differentially‐expressed genes were further explored in order to understand their biological functions and pathways through a Web‐based program.( 12 ) Significant GO terms in biological process, cellular component, and molecular function categories are shown in Tables 4,. A set of downregulated genes by treatment with MRGBP siRNA was significantly enriched in a number of GO terms associated with DNA replication, cell cycle, and cell division. KEGG pathway analysis also implied that these downstream genes of MRGBP are involved in DNA replication and cell cycle (Tables 4 and S5). These results suggest that MRGBP might play a crucial role in the proliferation of cancer cells through the regulation of its downstream genes.
Table 4.
Functional enrichment analysis of downstream MRGBP genes
| ID | Term | Adjusted P‐value |
|---|---|---|
| GO biological process (15) | ||
| GO:0006261 | DNA‐dependent DNA replication | 5.68E−08 |
| GO:0006270 | DNA‐dependent DNA replication initiation | 7.65E−07 |
| GO:0006260 | DNA replication | 1.37E−04 |
| GO:0051325 | Interphase | 1.16E−03 |
| GO:0000084 | S phase of mitotic cell cycle | 1.76E−03 |
| GO:0033261 | DNA‐dependent DNA replication | 1.76E−03 |
| GO:0015995 | Chlorophyll biosynthetic process | 9.35E−03 |
| GO:0051329 | Interphase of mitotic cell cycle | 1.14E−02 |
| GO:0015979 | Photosynthesis | 1.14E−02 |
| GO:0006974 | Response to DNA damage stimulus | 2.13E−02 |
| GO:0000731 | DNA synthesis involved in DNA repair | 2.13E−02 |
| GO:0051301 | Cell division | 2.67E−02 |
| GO:0000278 | Mitotic cell cycle | 3.08E−02 |
| GO:0007090 | Regulation of S phase of mitotic cell cycle | 3.93E−02 |
| GO:0006268 | DNA unwinding involved in replication | 3.93E−02 |
| GO cellular component (0) | ||
| GO molecular function (1) | ||
| GO:0016851 | Magnesium chelatase activity | 2.95E−02 |
| KEGG (3) | ||
| hsa03030 | DNA replication | 8.37E−07 |
| hsa04110 | Cell cycle | 5.70E−03 |
| hsa03430 | Mismatch repair | 4.91E−02 |
List of downregulated genes by MRGBP knockdown was used for the analysis. GO, gene ontology; KEGG, Kyoto Encyclopedia of Genes and Genomes.
Discussion
In this study, we investigated the expression of MRGBP in 22 adenomas and 47 carcinomas of the colon and rectum by immunohistochemical staining. This result, together with the clinicopathological information analysis, suggests that elevated MRGBP expression might be associated with the transformation from adenoma to carcinoma in colorectal carcinogenesis. This notion is in agreement with our previous data that the depletion of MRGBP resulted in retarded proliferation and reduced DNA synthesis, since the proliferation of cancer cells is generally higher than that of adenoma cells.( 13 ) Consistent with our previous report, enhanced MRGBP expression was observed in approximately 70% of colorectal carcinomas. Although we searched for clinicopathological factor(s) that are associated with its expression, none of the factors were significantly linked to MRGBP expression.
In addition to activation mutations in oncogenes, gene amplification is also involved in human carcinogenesis. HER2/Neu on chromosomal bands 17q11.2‐q12 and N‐Myc on 2p24.3 are well‐known oncogenes that are overexpressed by gene amplification. In this study, we found that the copy number was frequently increased in the colon cancer cell lines examined, and that the levels of MRGBP expression were relatively well correlated to its copy number. Additionally, we analyzed copy number in four MRGBP‐positive and three MRGBP‐negative colorectal carcinoma tissues. Quantitative PCR revealed an approximately fourfold higher copy number in MRGBP‐positive tumors compared with the matched normal tissues (data not shown). However, MRGBP‐negative tumors showed was approximately 2.6‐fold higher compared with the matched normal tissues. Although MRGBP‐negative tumors also showed a smaller increase in copy number, the gain of copy number in the MRGBP‐positive tumors was higher than that in the negative tumors. These data suggest that the amplification of MRGBP plays at least some role in its elevated expression. Recently, genomic analysis using array‐CGH identified an amplified region on chromosomal band 20q in colorectal carcinoma.( 14 ) The expression of seven genes, including C20orf24, AURKA, RNPC1, TH1L, ADRM1, C20orf20 (MRGBP), and TCFL5, located in this region was elevated in carcinomas compared with adenomas. Carvalho et al.’s data are in complete agreement with our results, showing that MRGBP is implicated in the progression of colorectal adenoma to carcinoma, and that gene amplification plays a crucial role in the elevated expression of MRGBP.
The genome‐wide expression analysis identified genes differentially expressed between cells transfected with MRGBP siRNA and control cells (Tables 3). Interestingly, the 41 genes that were downregulated by MRGBP siRNA include a number of genes implicated in DNA replication, such as CDT1, MCM2, MCM5, and MCM7. In line with the list of 41 genes, GO analysis indicated that genes involved in DNA replication and cell cycle were significantly enriched in the set of downregulated genes (Table 4). Although 76 genes were identified as upregulated by MRGBP siRNA (Table S2), they were not enriched in any GO biological processes, functions, or pathways, suggesting that they might be indirect targets of MRGBP. Among the downregulated genes, it has been reported that CDT1 was elevated in human cancers,( 15 ) and that the deregulation of CDT1 induced re‐replication and/or chromosomal damage, leading to chromosomal instability.( 15 , 16 ) Since it has been shown that the overexpression of CDT1 in NIH3T3 conferred transforming ability in vivo,( 17 ) elevated MRGBP expression might transform premalignant colorectal cells through the induction of CDT1. In an earlier report, we revealed that the knockdown of MRGBP induced growth retardation of cancer cells. Since MCM proteins are involved in the replication of DNA, the knockdown of MRGBP might interfere with DNA replication through the downregulation of these replication‐associated proteins. Importantly, MCM proteins are frequently upregulated in human cancers, including colon cancer.( 18 , 19 , 20 , 21 , 22 ) Their elevated expression could be a result of the transcriptional activation of MRGBP and/or a reflection of the increased number of proliferating cells.
In this study, we clarified that the accumulation of MRGBP contributes to the development of colorectal cancer. In addition, we identified downstream genes regulated by MRGBP in cancer cells. Since MRGBP associates with and regulates bromodomain protein, a component of the TRRAP/TIP60 histone acetyltransferase complex,( 11 ) the 41 genes might be regulated through the control of histone modification by the TRRAP/TIP60 complex. We also uncovered here one of the mechanisms underlying the overexpression of MRGBP in colorectal cancer. These data contribute to the understanding of the role of MRGBP in colorectal carcinogenesis, and the development of biomarkers and/or anticancer drugs to colorectal cancer.
Disclosure Statement
The authors have no conflict of interest.
Supporting information
Fig. S1. Expression of MRGBP in colorectal cancer cells.
Table S1. Primer sequences used in real‐time polymerase chain reaction for the validation of microarray data.
Table S2. List of genes commonly upregulated in SW480 cells transfected with MORF4‐related gene binding protein (MRGBP) siRNA.
Table S3. Gene ontology (GO) biological process (downregulated genes).
Table S4. Gene ontology (GO) molecular function (downregulated genes).
Table S5. Kyoto Encyclopedia of Genes and Genomes (KEGG) pathways (downregulated genes).
Supporting info item
Supporting info item
Supporting info item
Supporting info item
Supporting info item
Supporting info item
Acknowledgments
We thank Ms. Seira Hatakeyama (Division of Clinical Genome Research, The University of Tokyo, Tokyo, Japan) for her technical assistance. This work was supported in part by a Grant‐in‐Aid (no. 17015009) for Scientific Research, and the Global COE Program, “Center of education and research for the advanced genome‐based medicine for personalized medicine and the control of worldwide infectious diseases”, from the Ministry of Education, Culture, Sports, Science and Technology, Japan.
References
- 1. Jemal A, Siegel R, Ward E, Hao Y, Xu J, Thun MJ. Cancer statistics, 2009. CA Cancer J Clin 2009; 59: 225–49. [DOI] [PubMed] [Google Scholar]
- 2. Gellad ZF, Provenzale D. Colorectal cancer: national and international perspective on the burden of disease and public health impact. Gastroenterology 2010; 138: 2177–90. [DOI] [PubMed] [Google Scholar]
- 3. Fearon ER, Vogelstein B. A genetic model for colorectal tumorigenesis. Cell 1990; 61: 759–67. [DOI] [PubMed] [Google Scholar]
- 4. Hamamoto R, Furukawa Y, Morita M et al. SMYD3 encodes a histone methyltransferase involved in the proliferation of cancer cells. Nat Cell Biol 2004; 6: 731–40. [DOI] [PubMed] [Google Scholar]
- 5. Yagyu R, Furukawa Y, Lin YM, Shimokawa T, Yamamura T, Nakamura Y. A novel oncoprotein RNF43 functions in an autocrine manner in colorectal cancer. Int J Oncol 2004; 25: 1343–8. [PubMed] [Google Scholar]
- 6. Yuki D, Lin YM, Fujii Y, Nakamura Y, Furukawa Y. Isolation of LEM domain‐containing 1, a novel testis‐specific gene expressed in colorectal cancers. Oncol Rep 2004; 12: 275–80. [PubMed] [Google Scholar]
- 7. Kobayashi T, Masaki T, Sugiyama M, Atomi Y, Furukawa Y, Nakamura Y. A gene encoding a family with sequence similarity 84, member A (FAM84A) enhanced migration of human colon cancer cells. Int J Oncol 2006; 29: 341–7. [PubMed] [Google Scholar]
- 8. Obama K, Kato T, Hasegawa S, Satoh S, Nakamura Y, Furukawa Y. Overexpression of peptidyl‐prolyl isomerase‐like 1 is associated with the growth of colon cancer cells. Clin Cancer Res 2006; 12: 70–6. [DOI] [PubMed] [Google Scholar]
- 9. Sakai M, Shimokawa T, Kobayashi T et al. Elevated expression of C10orf3 (chromosome 10 open reading frame 3) is involved in the growth of human colon tumor. Oncogene 2006; 25: 480–6. [DOI] [PubMed] [Google Scholar]
- 10. Cai Y, Jin J, Tomomori‐Sato C et al. Identification of new subunits of the multiprotein mammalian TRRAP/TIP60‐containing histone acetyltransferase complex. J Biol Chem 2003; 278: 42733–6. [DOI] [PubMed] [Google Scholar]
- 11. Yamaguchi K, Sakai M, Shimokawa T, Yamada Y, Nakamura Y, Furukawa Y. C20orf20 (MRG‐binding protein) as a potential therapeutic target for colorectal cancer. Br J Cancer 2010; 102: 325–31. [DOI] [PMC free article] [PubMed] [Google Scholar]
- 12. Al‐Shahrour F, Minguez P, Tarraga J et al. FatiGO +: a functional profiling tool for genomic data. Integration of functional annotation, regulatory motifs and interaction data with microarray experiments. Nucleic Acids Res 2007; 35: W91–6. [DOI] [PMC free article] [PubMed] [Google Scholar]
- 13. Johnston PG, O’Brien MJ, Dervan PA, Carney DN. Immunohistochemical analysis of cell kinetic parameters in colonic adenocarcinomas, adenomas, and normal mucosa. Hum Pathol 1989; 20: 696–700. [DOI] [PubMed] [Google Scholar]
- 14. Carvalho B, Postma C, Mongera S et al. Multiple putative oncogenes at the chromosome 20q amplicon contribute to colorectal adenoma to carcinoma progression. Gut 2009; 58: 79–89. [DOI] [PubMed] [Google Scholar]
- 15. Tatsumi Y, Sugimoto N, Yugawa T, Narisawa‐Saito M, Kiyono T, Fujita M. Deregulation of Cdt1 induces chromosomal damage without rereplication and leads to chromosomal instability. J Cell Sci 2006; 119: 3128–40. [DOI] [PubMed] [Google Scholar]
- 16. Vaziri C, Saxena S, Jeon Y et al. A p53‐dependent checkpoint pathway prevents rereplication. Mol Cell 2003; 11: 997–1008. [DOI] [PubMed] [Google Scholar]
- 17. Arentson E, Faloon P, Seo J et al. Oncogenic potential of the DNA replication licensing protein CDT1. Oncogene 2002; 21: 1150–8. [DOI] [PubMed] [Google Scholar]
- 18. Davies RJ, Freeman A, Morris LS et al. Analysis of minichromosome maintenance proteins as a novel method for detection of colorectal cancer in stool. Lancet 2002; 359: 1917–19. [DOI] [PubMed] [Google Scholar]
- 19. Ishimi Y, Okayasu I, Kato C et al. Enhanced expression of Mcm proteins in cancer cells derived from uterine cervix. Eur J Biochem 2003; 270: 1089–101. [DOI] [PubMed] [Google Scholar]
- 20. Meng MV, Grossfeld GD, Williams GH et al. Minichromosome maintenance protein 2 expression in prostate: characterization and association with outcome after therapy for cancer. Clin Cancer Res 2001; 7: 2712–18. [PubMed] [Google Scholar]
- 21. Ramnath N, Hernandez FJ, Tan DF et al. MCM2 is an independent predictor of survival in patients with non‐small‐cell lung cancer. J Clin Oncol 2001; 19: 4259–66. [DOI] [PubMed] [Google Scholar]
- 22. Williams GH, Swinn R, Prevost AT et al. Diagnosis of oesophageal cancer by detection of minichromosome maintenance 5 protein in gastric aspirates. Br J Cancer 2004; 91: 714–19. [DOI] [PMC free article] [PubMed] [Google Scholar]
Associated Data
This section collects any data citations, data availability statements, or supplementary materials included in this article.
Supplementary Materials
Fig. S1. Expression of MRGBP in colorectal cancer cells.
Table S1. Primer sequences used in real‐time polymerase chain reaction for the validation of microarray data.
Table S2. List of genes commonly upregulated in SW480 cells transfected with MORF4‐related gene binding protein (MRGBP) siRNA.
Table S3. Gene ontology (GO) biological process (downregulated genes).
Table S4. Gene ontology (GO) molecular function (downregulated genes).
Table S5. Kyoto Encyclopedia of Genes and Genomes (KEGG) pathways (downregulated genes).
Supporting info item
Supporting info item
Supporting info item
Supporting info item
Supporting info item
Supporting info item