

Abstract
Accumulating evidence suggests that cancer stem cells (CSC) play an important role in tumorigenicity. Epithelial cell adhesion molecule (EpCAM) is one of the markers that identifies tumor cells with high tumorigenicity. The expression of EpCAM in liver progenitor cells prompted us to investigate whether CSC could be identified in hepatocellular carcinoma (HCC) cell lines. The sorted EpCAM+ subpopulation from HCC cell lines showed a greater colony formation rate than the sorted EpCAM− subpopulation from the same cell lines, although cell proliferation was comparable between the two subpopulations. The in vivo evaluation of tumorigenicity, using supra‐immunodeficient NOD/scid/γcnull (NOG) mice, revealed that a smaller number of EpCAM+ cells (minimum 100) than EpCAM− cells was necessary for tumor formation. The bifurcated differentiation of EpCAM+ cell clones into both EpCAM+ and EpCAM− cells was obvious both in vitro and in vivo, but EpCAM− clones sustained their phenotype. These clonal analyses suggested that EpCAM+ cells may contain a multipotent cell population. Interestingly, the introduction of exogenous EpCAM into EpCAM+ clones, but not into EpCAM− clones, markedly enhanced their tumor‐forming ability, even though both transfectants expressed a similar level of EpCAM. Therefore, the difference in the tumor‐forming ability between EpCAM+ and EpCAM− cells is probably due to the intrinsic biological differences between them. Collectively, our results suggest that the EpCAM+ population is biologically quite different from the EpCAM− population in HCC cell lines, and preferentially contains a highly tumorigenic cell population with the characteristics of CSC. (Cancer Sci 2010)
Hepatocellular carcinoma (HCC) is the fifth most common cancer worldwide, affecting 1 million individuals annually.( 1 ) Although hepatic arterial infusion chemotherapy and Sorafenib tosylate( 2 ) are frequently used, there is no effective treatment for advanced HCC, and its recurrence is often problematic and even lethal.( 3 , 4 ) Accumulating evidence suggests that tumors consist of various cell subpopulations with different biological properties,( 5 ) even in tumors that arise from a single clone. Among the heterogeneous cell populations, a relatively small fraction of cells with potent growth potential, the so‐called cancer stem cells (CSC) or tumor‐initiating cells (TIC), has emerged as having an important role in tumorigenicity. The presence of CSC with biological properties such as multipotency and self‐renewal, similar to those of normal stem cells, was first reported in leukemia( 6 ) and subsequently in various tumors including breast cancer,( 7 ) brain tumor( 8 , 9 , 10 ) and colon cancer,( 11 ) although the presence of CSC in solid tumors is controversial.( 12 , 13 ) If the multipotency of an identified cell population that shows high tumorigenicity is not clear, the cells have sometimes been termed TIC. However, the TIC population is thought to contain CSC. The CSC are estimated to comprise approximately 0.03–29% of tumor cells,( 13 ) and extensive studies, especially in leukemia, have suggested that they are indispensable for the development, maintenance and recurrence of tumors.( 6 , 14 , 15 ) Based on recent evidence for CSC in various tumors, it is likely that the CSC of HCC also play an important role in tumor formation and recurrence of the disease.( 16 , 17 , 18 , 19 , 20 )
One of the problems in studying CSC is the poor availability of specific surface markers. While CD34, CD38 and CD133 have been useful for specifically defining CSC in some types of leukemia, less‐specific markers, like CD24, CD44 and EpCAM,( 21 ) or combinations of them, have been used for breast cancer( 22 ) and pancreatic cancer.( 23 ) To explore the biology and pathology of CSC, it is necessary to identify better surface markers based on functional screening. However, the limited availability of experimental systems has hampered such functional evaluations. Recent advancements in the development of new supra‐immunodeficient mouse strains, NOD/scid/γcnull (NOG) mice,( 24 , 25 , 26 ) have facilitated the study of CSC, because these mice can accept a graft consisting of a small number of cancer cells (approximately 100), due to the total deficiency of the endogenous host immune system.( 27 , 28 ) This highly sensitive graft system has enabled a more reliable estimate of the frequency of CSC in various tumors.( 29 ) Furthermore, the specificity of putative surface markers for CSC can be tested using these mice, even if separation based on the markers yields only a small number of cells.
In the present study, using NOG mice, we examined the surface molecules known, thus far, to be specific for CSC and to correlate well with the tumor‐forming capacity of grafted cell lines. Although a recent paper demonstrated that the expression of EpCAM might be helpful for enriching TIC in HCC, that study did not examine cells at the clonal level, and did not address whether EpCAM‐mediated signaling is required for the TIC characteristics.( 30 ) We therefore investigated these issues using EpCAM+ and EpCAM− cell clones derived from HCC cell lines, in which the EpCAM gene was overexpressed or knocked down. Clonal analyses further demonstrated a sharp difference between the biology of the EpCAM+ and EpCAM− populations in terms of their colony‐forming ability, migration and in vivo tumorigenicity. Moreover, the overexpression and knockdown of the EpCAM gene in HCC cells showed that EpCAM itself has a partial but significant impact on the tumorigenicity of HCC cells. Therefore, EpCAM expression may be a good marker for obtaining a CSC‐enriched population.
Materials and Methods
Patients. Specimens were obtained during curative operations for primary HCC lesions at Tohoku University Hospital and Sendai Medical Center. Written informed consent was obtained from each patient, and the study was approved by the Ethics Committee of Tohoku University School of Medicine (No. 2008–241) and Sendai Medical Center (No. 21–3).
Cell lines and cell cultures. Human HCC cell lines—Huh7, HepG2, Hep3B, Li‐7( 31 ) and PLC/PRF/5( 32 )—were obtained from the Cell Resource Center for Biomedical Research, Tohoku University. As described previously,( 33 ) these HCC cells were cultured in DMEM (high glucose) with L‐glutamine and phenol red (Wako, Osaka, Japan), supplemented with 10% heat‐inactivated fetal bovine serum (FBS) (Sigma‐Aldrich Japan, Tokyo, Japan), at 37°C in a 5% CO2 atmosphere.
Western blot analysis. Cells were lysed with lysis buffer (1% Triton X, 40 mM Tris‐HCl (pH 7.5), 150 mM NaCl, 2 mM EDTA, 1 mM phenylmethyl sulfonyl fluoride, and 10 μg/mL aprotinin) for 15 min on ice. The total proteins (25 μg) were separated by sodium dodecyl sulphate‐polyacrylamide gel electrophoresis using 5–20% gradient gels and transferred onto polyvinylidene difluoride membranes (Millipore, Billerica, MA, USA). After being blocked with 5% non‐fat milk in Tris‐buffered saline with 0.1% Tween 20, the membranes were probed with the indicated primary antibodies at 4°C. The antibodies used were anti‐human TACSTD antibody (Abnova, Taipei, Taiwan), anti‐human EpICD antibody (Epitomics, Burlingame, CA, USA), and anti‐human alpha tubulin antibody. The primary antibody was detected by horseradish peroxidase‐conjugated secondary antibody (Cell Signaling, Beverly, MA, USA). An enhanced‐chemiluminescence reagent (Thermo Fisher Scientific, Rockford, IL, USA) and VersaDoc 5000 imaging analyzer (BIO‐RAD, Hercules, CA, USA) were used for visualization.
Antibodies and flow‐cytometry analysis. The biotinylated‐anti‐EpCAM antibody was from Gene Tex (Irvine, CA, USA). Phycoerythrin (PE)‐labeled anti‐CD133/2 Ab was purchased from Miltenyi Biotec (Bergisch Gladbach, Germany), and anti‐human CD90 and anti‐human cMet Abs were obtained from R&D Systems (Minneapolis, MN, USA). The FITC‐conjugated anti‐HLA‐ABC Ab used was from eBiosciences (San Diego, CA, USA). The cells were stained with the indicated antibody or isotype‐matched control antibody. When using biotinylated‐antibody for staining, the cells were then incubated with Streptavidin‐PE or Streptavidin‐Allophycocyanin (APC) (BD Biosciences, San Jose, CA, USA).
Flow‐cytometric analysis was performed by FACSCanto II (BD Biosciences), and the collected data were analyzed using FACSDiva software (BD Biosciences).
Proliferation assay. Cell proliferation was determined by the CellTiter 96 AQueous One Solution Cell Proliferation Assay (Promega, Madison, WI, USA), according to the manufacturer’s instructions.
Colony formation assay. A base agarose layer was prepared at the bottom of 24‐well plates by mixing 0.7% soft agar and an equivalent amount of two‐times concentrated medium. The cells were suspended in medium containing 0.35% soft agar and seeded on the base layer at a density of 1000 cells per well. After 3 weeks, the number of colonies was counted under a microscope.
Animal preparation and cell transplantation into NOG mice. Eight‐ to 10‐week‐old NOG mice were purchased from the Central Institute for Experimental Animals (Kawasaki, Japan). The tumor cells were suspended in 200 μL of DMEM/Matrigel (BD Biosciences) (1:1 mixture) and subcutaneously injected into the back of the mice. Tumor formation was monitored from 1 week after inoculation. The size of each tumor was measured with calipers. The tumor volume was calculated using the following formula: tumor volume = 1/2 × length (mm) × width (mm) × height (mm).
Lentiviral gene delivery. For EpCAM expression, EpCAM cDNA was inserted into a lentiviral vector, the pCSII‐EF plasmid.( 34 ) The pCSII‐EF‐EpCAM or control pCSII‐EF‐IRES‐GFP plasmid was transfected into HEK293T cells together with two packaging plasmids, pCAG‐HIVgp and pCMV‐VSV‐G/RSV‐Rev (provided by the RIKEN Bio‐resource Center), using the calcium phosphate method. The supernatants containing the recombinant lentivirus were used for the infection of EpCAM− or EpCAM+ cells. Stable cell lines were isolated by FACSAria as GFP‐positive or EpCAM‐positive cells for the control or experimental group, respectively.
Statistical analysis. Statistical analyses were performed with Mann–Whitney’s U‐test using SPSS Statistics 17.0 (SPSS Japan, Tokyo, Japan). A P‐value of <0.05 was considered significant.
Results
Heterogeneous expression of EpCAM in human HCC cell lines and human primary HCC tissues. To determine the surface molecules that are useful for obtaining a CSC‐enriched fraction from HCC cells, we analyzed the expression patterns of several markers: CD90,( 19 , 35 ) CD133,( 36 , 37 ) EpCAM,( 20 , 30 ) ABCG2( 38 ) and c‐Met.( 39 ) These markers were chosen because they have frequently been used for CSC studies in various kinds of tumors, and some of them are expressed on hepatocyte progenitor cells.( 40 ) The FACS analysis of five different HCC‐derived cell lines (Huh7, HepG2, Hep3B, Li‐7 and PLC/PRF/5) showed various staining patterns (Fig. 1A). Among them, PLC/PRF/5 cells showed a unique bimodal pattern for EpCAM expression. A significant amount of EpCAM was detected in the other cell lines, except for HepG2, although none showed a similar profile to PLC/PRF/5 (Fig. 1A). The expression of EpCAM in these cell lines was confirmed by western blot analysis (Fig. 1B).
Figure 1.

(A) Flow cytometric analysis of various surface molecules in hepatocellular carcinoma (HCC) cell lines. Percentages of the indicated molecule positive cells are shown. A representative result of three independent staining experiments is shown. (B) Western blot analysis of the expression of epithelial cell adhesion molecule (EpCAM) in cell lines. The blotting for EpCAM (upper panel) and tubulin as a loading control (lower panel) are shown. (C) FACS analysis of resected HCC. Eight independent primary tissues were prepared and stained, as described in the Materials and Methods. Percentages of EpCAM‐positive cells are indicated with SEM. A representative result is shown. (D) Immunohistochemical staining of EpCAM in resected HCC. The specimens were stained with an anti‐EpCAM Ab followed by incubation with a peroxidase‐conjugated anti‐mouse Ig Ab. Black arrows indicate cells with high EpCAM expression. well, well‐differentiated HCC; mod, moderately differentiated HCC; poor, poorly differentiated HCC.
An EpCAM‐positive population was also evident in human primary HCC cells by flow cytometry and immunohistochemistry (Fig. 1C,D). Flow cytometric analysis showed that approximately 13% of cells were EpCAM‐positive (Fig. 1C). In the immunohistochemical analysis, each specimen was histopathologically classified into three grades (well‐differentiated HCC, well, n = 2; moderately differentiated HCC, mod, n = 3; poorly differentiated HCC, poor, n = 2). Well‐differentiated HCC showed higher expression by immunohistochemistry, although the stained area and the intensity varied among the samples (Fig. 1D). In contrast, in moderately and poorly differentiated HCC, EpCAM expression gradually decreased (Fig. 1D). The non‐cancer regions did not express EpCAM (Fig. 1D).
Biological differences between EpCAM+ and EpCAM− cells in vitro. Because EpCAM was reported to be a marker of hepatocyte progenitors( 40 , 41 )and because it is reported to be useful as a CSC marker in several cancers,( 23 , 42 ) we examined whether EpCAM could be used to obtain CSC‐enriched populations of HCC cells. We took advantage of the characteristic pattern of EpCAM in PLC/PRF/5 cells, and examined the EpCAM+ and EpCAM− subpopulations isolated from PLC/PRF/5 cells; we used Li‐7 cells as a representative cell line with a mono‐peak of EpCAM expression. Before the analysis, we first excluded the possibility that the two EpCAM+ and EpCAM− populations in the PLC/PRF/5 cells were derived from two different cross‐contaminated cell lines by showing that the HLA alleles had the same haplotype in the sorted EpCAM+ and EpCAM− PLC/PRF/5 cells (data not shown). There was a small but significant difference in the expression of other putative CSC markers (CD133, CD90 and ABCG2) between the sorted EpCAM+ and EpCAM− cells from the PLC/PRF/5 cell line, but there was no significant difference in the expression of HLA class I or c‐Met (Fig. 2). In addition, the sorted EpCAM+ and EpCAM− cells from the PLC/PRF/5 lines had the same capacity for in vitro proliferation (Fig. 3A,B), as well as the similar proliferation capacity between the EpCAM+ and EpCAM− cells from the Li‐7 lines. However, the EpCAM+ PLC/PRF/5 cells showed a higher colony‐forming ability than the EpCAM− PLC/PRF/5 cells (Fig. 3C). The EpCAM− cells showed faster migration toward hepatocyte growth factor (HGF) than the EpCAM+ cells from both cell lines (Fig. 3D).
Figure 2.
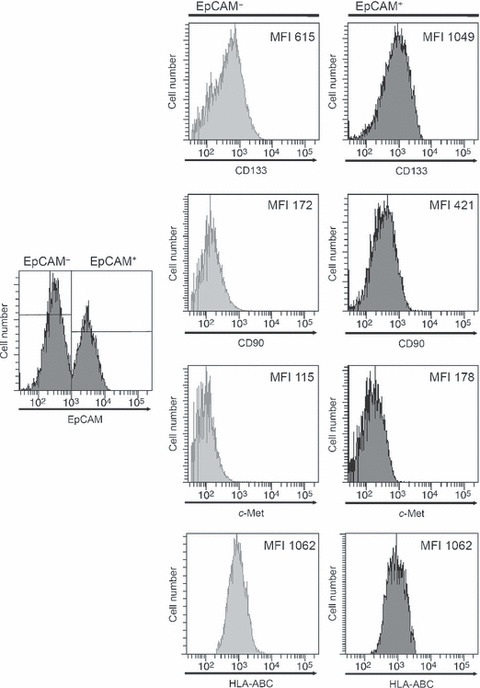
Flow cytometry histograms showing expression of CD133, CD90, c‐Met and human leukocyte antigen (HLA)‐ABC on the EpCAM+ and EpCAM− cell populations from PLC/PRF/5 cells. The numbers in each panel represent the mean fluorescence intensity (MFI) for staining with the indicated antibodies.
Figure 3.

Characterization of the epithelial cell adhesion molecule (EpCAM)+ and EpCAM− cells in vitro. (A) Sorting of the EpCAM+ and EpCAM− subpopulations from PLC/PRF/5 (upper) and Li‐7 (lower) cells. (B) Proliferation was compared between the EpCAM+ and EpCAM− subpopulations of PLC/PRF/5 and Li‐7. (C) The number of colonies formed in soft agar was determined for the EpCAM+ and EpCAM− subpopulations from PLC/PRF/5 and Li‐7. The average of three independent experiments is shown with SD. (D) Result of a migration assay toward hepatocyte growth factor (HGF). The number of cells that migrated from an upper chamber through a membrane filter was counted using a microscope in five fields selected at random. The average of three independent experiments is shown with SD. * represents P < 0.05.
EpCAM+ cells have higher tumorigenicity in NOG mice. We then examined whether EpCAM+ cells showed higher tumorigenicity in vivo than EpCAM− cells. First, NOG mice were inoculated with the sorted EpCAM+ or EpCAM− populations from PLC/PRF/5 or Li‐7, and the tumor growth was monitored. Fewer EpCAM+ cells were needed to form a tumor than EpCAM− cells. In addition, the EpCAM+ cells resulted in an earlier onset of tumors and formed larger tumors than the same number of EpCAM− cells (Fig. 4A,B, 1, 2). These results suggested that EpCAM+ cells have stronger tumorigenicity than EpCAM− cells. The primary tumors established on NOG mice inoculated with EpCAM+ cells (PLC/PRF/5) contained both EpCAM+ and EpCAM− cells, while the tumors from EpCAM− cells sustained the EpCAM− phenotype (Fig. 5A). When FACS‐separated cells from the EpCAM+ PLC/PRF/5‐induced primary tumor were transplanted into fresh recipient NOG mice, the EpCAM+ cells again showed higher tumorigenicity than the EpCAM− cells (Fig. 5B).
Figure 4.
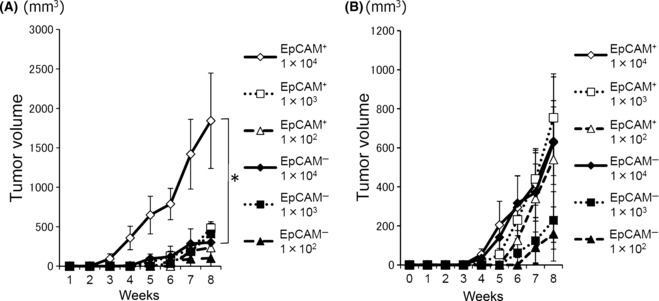
Tumor formation in NOD/scid/γcnull mice. Growth curve of the tumors in NOG mice (A: PLC/PRF/5; B: Li‐7). The indicated number of tumor cells (EpCAM+ and EpCAM− cells) were subcutaneously injected into NOG mice. The development of the tumor was measured for 8 weeks. The tumor volume was calculated and compared between the EpCAM+ and EpCAM− cell groups. The average size of tumors from four or six mice is shown with SEM.
Table 1.
Tumor development in NOD/scid/γcnull (NOG) mice from EpCAM+ and EpCAM− PLC/PRF/5 cells
| Week | |||||||||
|---|---|---|---|---|---|---|---|---|---|
| 1 | 2 | 3 | 4 | 5 | 6 | 7 | 8 | ||
| EpCAM+ | |||||||||
| 1 × 10⁴ | n = 4 | 0/4 | 0/4 | 3/4 | 4/4 | 4/4 | 4/4 | 4/4 | 4/4 |
| 1 × 10³ | n = 6 | 0/6 | 0/6 | 0/6 | 2/6 | 3/6 | 5/6 | 6/6 | 6/6 |
| 1 × 10² | n = 4 | 0/4 | 0/4 | 0/4 | 0/4 | 0/4 | 0/4 | 1/4 | 2/4 |
| EpCAM− | |||||||||
| 1 × 10⁴ | n = 4 | 0/4 | 0/4 | 0/4 | 2/4 | 2/4 | 2/4 | 2/4 | 2/4 |
| 1 × 10³ | n = 6 | 0/6 | 0/6 | 0/6 | 0/6 | 1/6 | 1/6 | 2/6 | 2/6 |
| 1 × 10² | n = 4 | 0/4 | 0/4 | 0/4 | 0/4 | 1/4 | 1/4 | 1/4 | 1/4 |
Epithelial cell adhesion molecule EpCAM.
Table 2.
Tumor development in NOD/scid/γcnull (NOG) mice from EpCAM+ and EpCAM− Li‐7 cells
| Week | |||||||||
|---|---|---|---|---|---|---|---|---|---|
| 1 | 2 | 3 | 4 | 5 | 6 | 7 | 8 | ||
| EpCAM+ | |||||||||
| 1 × 10⁴ | n = 6 | 0/6 | 0/6 | 2/6 | 3/6 | 4/6 | 5/6 | 5/6 | 5/6 |
| 1 × 10³ | n = 6 | 0/6 | 0/6 | 0/6 | 3/6 | 4/6 | 5/6 | 5/6 | 5/6 |
| 1 × 10² | n = 6 | 0/6 | 0/6 | 0/6 | 0/6 | 0/6 | 2/6 | 2/6 | 2/6 |
| EpCAM− | |||||||||
| 1 × 10⁴ | n = 6 | 0/6 | 0/6 | 0/6 | 2/6 | 4/6 | 4/6 | 5/6 | 5/6 |
| 1 × 10³ | n = 6 | 0/6 | 0/6 | 0/6 | 0/6 | 0/6 | 1/6 | 1/6 | 3/6 |
| 1 × 10² | n = 6 | 0/6 | 0/6 | 0/6 | 0/6 | 0/6 | 0/6 | 2/6 | 2/6 |
Epithelial cell adhesion molecule EpCAM.
Figure 5.
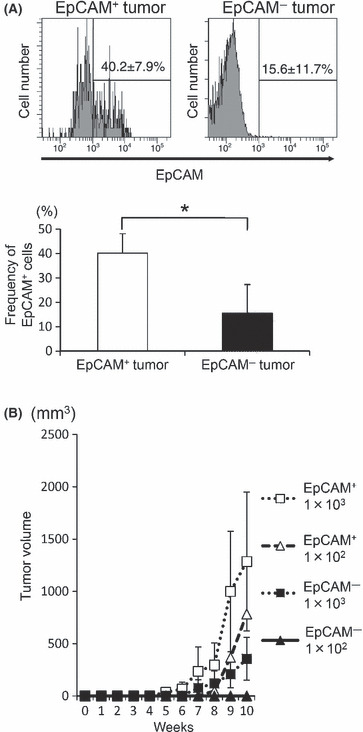
(A) Analysis of tumor cells in the primary tumors established in NOD/scid/γcnull (NOG) mice. A single‐cell suspension was prepared from the tumors in NOG mice that had been inoculated with epithelial cell adhesion molecule (EpCAM)+ or EpCAM− subpopulations of PLC/PRF/5 cells, and stained with an anti‐EpCAM Ab. A representative FACS staining result is shown (upper panel). The average percentage of EpCAM+ cells from the mice in each group is shown (lower panel, n = 4). (B) The secondary graft in NOG mice. The indicated number of EpCAM+ and EpCAM− cells isolated from the EpCAM+ PLC/PRF/5‐induced primary tumor in NOG mice were independently transplanted into fresh recipient NOG mice. The growth of tumors was monitored for 10 weeks. The average tumor size from two and four mice for inoculation of 1 × 10² and 1 × 10³ cells, respectively, is shown. * represents P < 0.05.
Preferential transition from EpCAM+ to EpCAM− cells at the clonal level. As shown in Figure 5A, the EpCAM+ cell population gave rise to both EpCAM+ and EpCAM− cells during tumor formation, while the EpCAM− population produced EpCAM− cells almost exclusively. This result is consistent with a previous study.( 30 ) Considering the CSC hypothesis that the tumor cells show a hierarchy of tumorigenicity, bifurcated differentiation of the EpCAM+ population might suggest that this population contains pluripotent CSC cells. However, neither the results of the above experiment nor those of a previous study( 30 ) could exclude the possibility that the sorted EpCAM+ population was contaminated with a small amount of EpCAM− cells that independently generated an EpCAM− population. To exclude this possibility, we isolated several clones from each population by highly accurate single‐cell sorting. The cloning efficiency was higher for the EpCAM+ cell clones than for the EpCAM− cell clones (Fig. 6A), most likely reflecting their colony‐forming ability. After 2 months in culture, the phenotypes of the EpCAM+ and EpCAM− clones were divided into four groups according to their EpCAM levels: High (≥40%), Bimodal, Intermediate (≥10% and <40%; Fig. 6B), and Low (<10%). None of the clones from the EpCAM+ subpopulation were in the Low category, and more than half showed the High phenotype (Fig. 6B,C). In contrast, five of 30 clones from the EpCAM− fraction became EpCAM+, but the others maintained an EpCAM‐Low phenotype (Fig. 6B,C). The phenotype found at 2 months was stable for at least 6 months. Thus, these clonal analyses demonstrated the preferential transition of EpCAM+ cells into EpCAM− cells, which is a CSC‐like feature.
Figure 6.
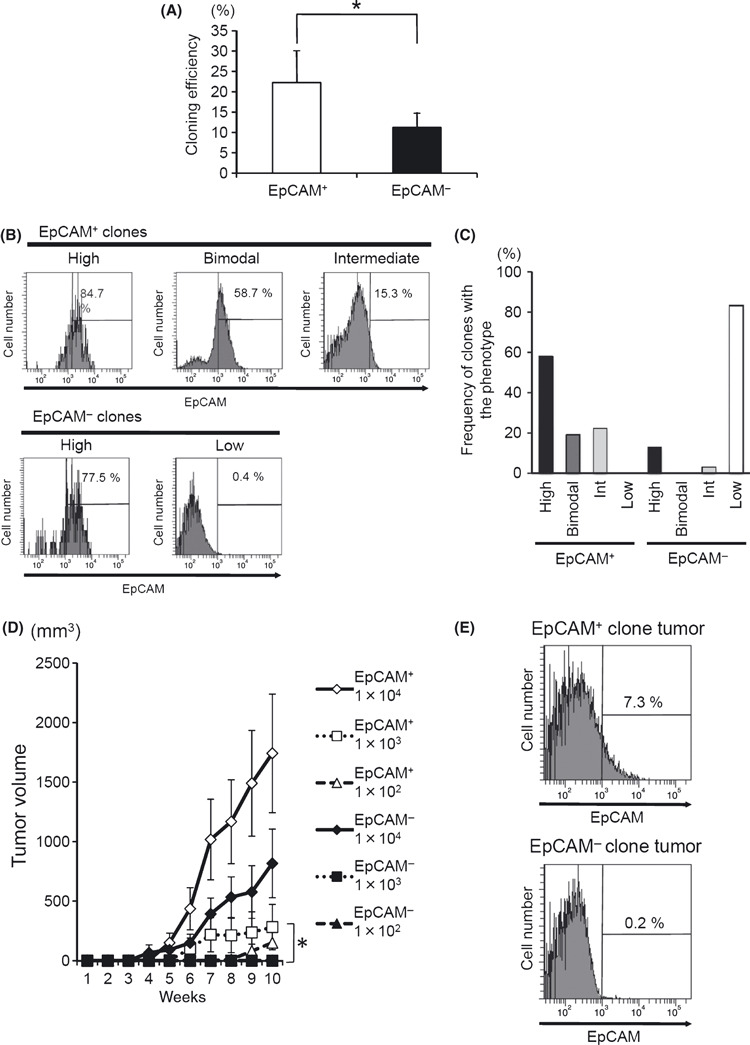
Analysis of cell clones derived from the epithelial cell adhesion molecule (EpCAM)+ and EpCAM− populations of PLC/PRF/5 cells. (A) The efficiency of cloning in each cell population. A total of 480 single cells (96 wells × 5 plates) were sorted from the separated EpCAM+ and EpCAM− cell populations using a FACSAria. The number of wells with visible and vital colonies was counted. The average of three independent experiments is shown with SD. (B) Change in the expression profiles of EpCAM on EpCAM+ and EpCAM− clones after long‐term culture (2 months). After a 2‐month culture, the phenotypes of the clones were classified into four typical different patterns (High, Intermediate [Int], Bimodal and Low) based on the FACS analysis. (C) Thirty‐one clones from EpCAM+ and 30 clones from EpCAM− populations were categorized into the four types described above, and the frequency of clones with each phenotype is shown in the histogram. (D) The tumor formation by PLC/PRF/5 clone cells in NOG mice. Three independent EpCAM+ and three EpCAM− clones from PLC/PRF/5 cells were subcutaneously inoculated into NOG mice in a dose‐dependent fashion. The average tumor size of six mice is shown with SEM. (E) Single‐cell suspensions were prepared from the tumors in NOD/scid/γcnull (NOG) mice inoculated with EpCAM+ or EpCAM− cell clones and stained with the anti‐EpCAM Ab. A representative FACS staining result is shown.
Whether the high tumorigenicity of the EpCAM+ fraction could be attributed to individual clones was also examined. Among the several clones established above, we chose six independent clones (three from the EpCAM+ and three from the EpCAM− populations) that showed the EpCAM‐High and EpCAM‐Low phenotype, respectively (6, 7, data not shown). When these six independent clones were subcutaneously transplanted into NOG mice, visible tumor formation was noted 2 months after the inoculation of 1 × 10³ EpCAM+ clones, while more than 1 × 10⁴ cells were necessary to obtain tumors from the EpCAM− clones (Fig. 6D). As expected, EpCAM+ clones produced both EpCAM+ and EpCAM− cells during tumor formation, while EpCAM− clones produced tumors consisting only of EpCAM− cells (Fig. 6E).
Figure 7.
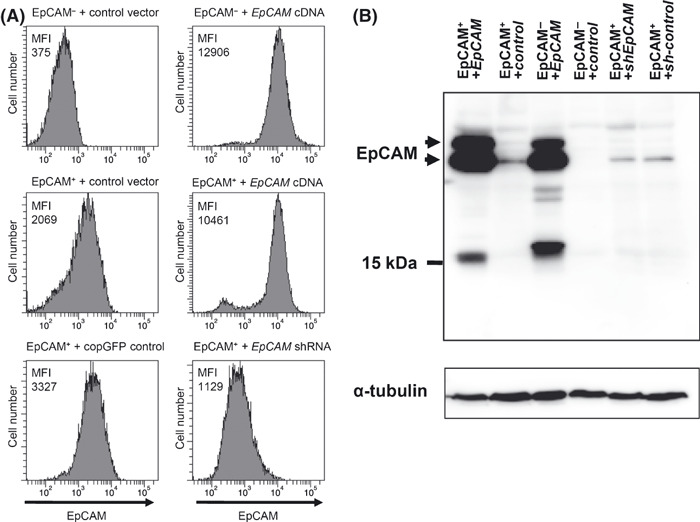
Overexpression and knockdown of epithelial cell adhesion molecule (EpCAM) in cell clones. (A) Surface expression of EpCAM in clones with genetic modifications. Cells were stained with an anti‐EpCAM mAb and subjected to FACS analysis. Upper panel: an EpCAM− clone infected with control (left) or EpCAM‐coding lentivirus (right). Central panel: an EpCAM+ clone infected with control (left) or EpCAM‐coding lentivirus (right). Bottom panel: an EpCAM+ clone infected with control virus (left) or lentivirus expressing a shRNA for EpCAM knockdown (right). Each panel shows the expression of EpCAM. The number shown in each panel represents the mean fluorescent intensity (MFI) of the EpCAM staining. (B) Expression of EpCAM protein in each cell line. Immunoblotting was carried out with an anti‐EpCAM antibody that recognizes the intracellular domain of EpCAM and anti‐α‐tubulin. The bands around 15 kDa are probably non‐specific, because the intracellular domain of EpCAM has a molecular weight of 5 kDa.( 44 ) The data represent at least three independent experiments.
EpCAM overexpression and EpCAM gene silencing have little impact on the in vitro characteristics of the EpCAM+ and EpCAM− cell clones. Since the EpCAM molecule is reported to be involved in the Wnt/β‐catenin signaling pathway 43 , 44 , which regulates the maintenance of stem cells, we investigated whether the EpCAM expressed on PLC/PRF/5 cells plays a role in tumorigenicity. For this purpose, we introduced the EpCAM cDNA into EpCAM+ and EpCAM− clones. We also knocked down the expression of EpCAM in EpCAM+ cell clones by RNA‐interference (Fig. 7). When we compared the transfectants (i.e. EpCAM‐introduced vs GFP‐introduced cells, and EpCAM‐knocked down cells vs control cells) from the same parental cell clone, there was no significant difference in their in vitro proliferation (Fig. 8A). In addition, the forced expression of EpCAM in EpCAM+ and EpCAM− clones did not affect their colony‐forming ability or migration when compared with the corresponding control cells (Fig. 8B,C), even though the expression level of EpCAM between these cells was comparable (Fig. 7). However, the knockdown of EpCAM expression in the EpCAM+ cells slightly decreased their colony‐forming ability (Fig. 8B).
Figure 8.
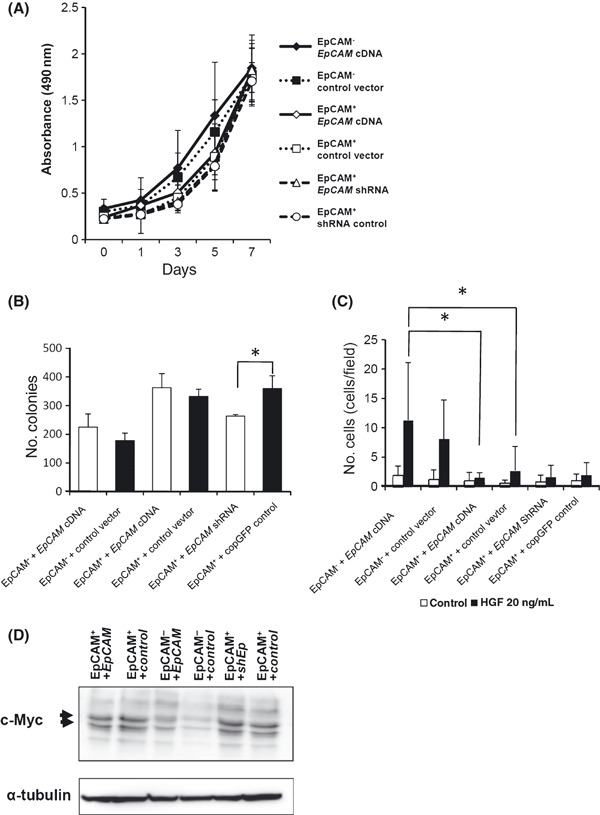
Overexpression and knockdown of epithelial cell adhesion molecule (EpCAM) in cell clones and their characterization in vitro. (A) The proliferation of each clone was compared, as described in Materials and Methods. (B) The number of colonies formed in soft agar was counted as described in Figure 3C. The average of three independent experiments is shown with SD. (C) The migration activity of each cell clone was compared, as described in Figure 3D. The average of three independent experiments is shown with SD. (D) c‐Myc expression in each clone was examined by immunoblotting. Cell lysates were prepared from the indicated cell clones and subjected to immunoblotting using an anti‐c‐Myc antibody. The data represent at least two independent experiments. * represents P < 0.05.
Since signals through EpCAM were recently reported to induce c‐Myc expression in a cell line,( 44 ) we examined whether the forced expression of EpCAM affected the expression level of c‐Myc in EpCAM+ and EpCAM− clones. Interestingly, even the marked increase in EpCAM expression seen in the EpCAM transfectants upregulated the c‐Myc very little, if at all (i.e. compare lanes 1 and 2 in 7, 8). Similarly, EpCAM knockdown appeared to be ineffective for downregulating c‐Myc expression (Fig. 8D). Therefore, the EpCAM expression level alone did not noticeably affect the downstream signals elicited through EpCAM.
Forced expression of EpCAM in EpCAM+ cells but not EpCAM− cells enhances tumorigenicity. We then inoculated NOG mice with these six clones to examine the extent to which EpCAM is essential for tumorigenesis. In contrast to the in vitro results, the introduction of EpCAM cDNA into an EpCAM+ clone augmented the tumor formation (Fig. 9A), but the knockdown of EpCAM in EpCAM+ cells did not significantly reduce the tumor size (Fig. 9C). In contrast, EpCAM− cells that were turned into EpCAMhigh cells by cDNA delivery showed a marginal increase in tumor formation (Fig. 9B). In addition, the size of tumors arising from the EpCAM‐transfected EpCAM− cells was markedly smaller than that of tumors from the EpCAM‐transfected EpCAM+ cells (Fig. 9A,B), even though the amount of EpCAM was equivalent between these two populations (Fig. 9A).
Figure 9.
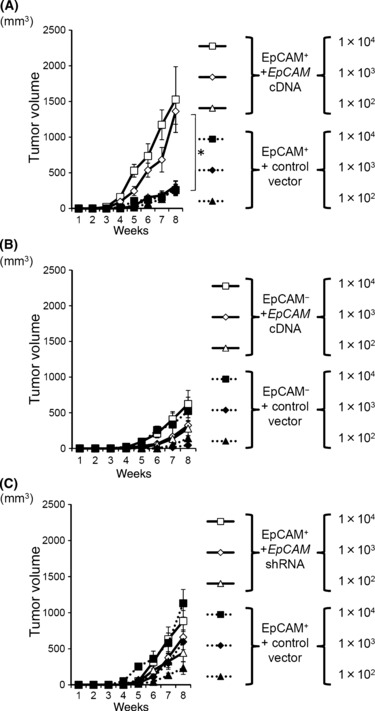
Tumor formation in NOD/scid/γcnull (NOG) mice by epithelial cell adhesion molecule (EpCAM)+ and EpCAM− clones with genetic modifications. (A,B) Effect of introduced EpCAM cDNA on tumor‐forming ability. The NOG mice were inoculated with EpCAM+ (A) or EpCAM− clones (B) transfected with EpCAM cDNA or the control vector. The average tumor size from four mice is shown with SEM. (C) Effect of EpCAM knockdown in EpCAM+ cell clones on their tumor‐forming ability. The indicated number of EpCAM+ clones transfected with shRNA construct or the control were transplanted into NOG mice. The average tumor size from eight mice is shown with SEM. * represents P < 0.05.
Discussion
In the present study, using a single‐cell‐sorting technique and a highly sensitive in vivo assay, we have demonstrated that there is a subpopulation with higher tumorigenicity in HCC cell lines, and that the expression of EpCAM is useful for obtaining a CSC‐enriched population.
We first compared the biological properties between EpCAM+ and EpCAM− subpopulations in two HCC cell lines, PLC/PRF/5 and Li7. Although primary HCC tissues consisted of both EpCAM+ and EpCAM− cells (Fig. 1C,D), the HCC cell lines, except for the PLC/PRF/5 cells, showed a mono‐peak expression of EpCAM (Fig. 1A). This unique feature of the PLC/PRF/5 HCC cell line enabled us to reveal strikingly different biological characteristics between the EpCAM+ and EpCAM− subpopulations. To further elucidate the differences between the two populations in primary HCC, we separately transplanted the EpCAM+ and EpCAM− cells of a primary cancer derived from eight patients with HCC into immunodeficient mice. However, these cells failed to form tumors, even in NOG mice (data not shown). The transplantation methods need to be improved.
Our analysis demonstrated the unidirectional transition of EpCAM+ cells into EpCAM− cells at the clonal level both in vivo and in vitro. There are at least three possible explanations for the phenotypic loss of EpCAM in the EpCAM+ clones. The first is that it represents a transient change in cellular status, such as the epithelial‐mesenchymal transition (EMT). To address this possibility, we examined the expression of vimentin, a marker of mesenchymal cells, but detected neither a decrease of vimentin in EpCAM+ cells nor an increase in EpCAM− cells by western blot analysis (data not shown). Thus, the involvement of EMT in the loss of EpCAM protein in our clones seems unlikely. The second possibility is the simple shedding or sequestering of molecules from the cell surface. However, RT‐PCR analysis detected only a trace amount of the mRNA for EpCAM in the EpCAM− clones (data not shown), suggesting that the protein level of the EpCAM was controlled at the transcriptional level. Therefore, we believe that the regulation of EpCAM by post‐translational modification is not involved. The third possibility is cell differentiation. Although this possibility and the first one are not always mutually exclusive, considering that the change from EpCAM+ into EpCAM− cells was irreversible, if not complete, as revealed by tracing the EpCAM+ and EpCAM− clones for more than 6 months, we favor the possibility of cell differentiation. This possibility is further supported by the differences in biological and pathological properties between the EpCAM+ and EpCAM− cell clones, revealed in several in our in vitro analyses.
Although EpCAM+ and EpCAM− cells derived from the HCC cell lines showed similar in vitro proliferative capacity, the colony forming ability was higher for the EpCAM+ cells than for the EpCAM− cells. Several previous observations with HCC cell lines have shown that the tumor‐forming ability correlates more with the colony‐forming capacity than with the in vitro proliferative ability.( 37 , 45 , 46 ) Therefore, EpCAM might have a preferential role in tumorigenicity associated with the colony‐forming ability rather than proliferation or survival, at least in HCC cell lines.
Gire et al. 44 recently reported that signals through EpCAM induce Wnt/β‐Catenin activation, which can lead to tumorigenesis under certain conditions. This paper also demonstrated that the intracellular domain of EpCAM (EpICD), which is produced by cleavage upon activation of EpCAM, functions as a transcriptional factor to promote cell proliferation by inducing cell activation molecules, such as c‐myc.( 44 ) However, western blot analysis of the cell lysate, even from the EpCAM‐transfected PLC/PRF/5 HCC cell lines, failed to detect EpICD (Fig. 7B). Although we found smaller bands around 15 kDa, specifically in the EpCAM‐overexpressing cells (Fig. 7B), the bands are probably non‐specific, because EpICD has a molecular weight of 5 kDa.( 44 ) We further examined the immunohistochemical analysis to detect the nuclear localization of EpICD, which is suggested to be an activation state for EpICD. However, the immunostaining failed to detect the EpCAM molecule in the nuclei of any cell clones from the PLC/PRF/5 cell lines (data not shown). Although we did not examine the protein expression of TNF‐α converting enzyme (TACE) and presenillin‐2, both of which are required for the EpCAM cleavage to produce EpICD,( 44 ) in the PLC/PRF/5 HCC cells, the cell line might lack the machinery in which EpICD is produced. Nevertheless, the forced expression of EpCAM in EpCAM+ cells markedly enhanced their in vivo tumor‐forming ability (Fig. 9A), suggesting the EpCAM function in tumorigenicity. Therefore, EpCAM‐associated tumorigenicity in PLC/PRF/5 cells might be mediated by EpICD‐independent signaling.
The exogenous expression of EpCAM in EpCAM− cell clones did not change their in vitro biological characteristics, such as colony formation and migration, and failed to increase their tumorigenicity. In contrast, the forced expression of EpCAM in EpCAM+ cells markedly enhanced their in vivo tumor‐forming ability (Fig. 9A). Therefore, the EpCAM− subpopulation may lack part of the machinery that is required for EpCAM‐dependent tumorigenesis, while the EpCAM+ population might intrinsically have this tumorigenic machinery, in which EpCAM/Wnt/β‐Catenin may be involved. This notion is supported by two observations: first, the EpCAM knockdown in EpCAM+ cells reduced their colony‐forming ability (Fig. 7C), which suggests an important role for EpCAM in the EpCAM+ cells; and second, regardless of the exogenous expression of EpCAM, EpCAM+ clones still had higher expression of c‐Myc, than the EpCAM‐overexpressing EpCAM− clones (Fig. 8D). Therefore, the biological difference, particularly the difference in tumorigenicity, between the EpCAM+ and EpCAM− populations might be due to the involvement of different signaling pathways, perhaps including signals downstream of EpCAM, rather than to the cell‐surface expression of EpCAM itself (or the lack of it).
Taken together, our results showed that EpCAM is a good marker for obtaining cell populations enriched for high tumorigenicity, which is the critical biological property of CSC and TIC, in HCC cell lines. A comparison of the gene‐expression profiles between EpCAM+ cells and EpCAM− cells that are transfected with EpCAM cDNA will be useful for identifying the genes responsible for the properties of CSC. Finally, increased understanding of CSC biology will facilitate the development of effective cancer therapies targeting CSC.
Disclosure Statement
The authors have no conflict of interest.
Acknowledgments
This work was supported in part by a grant‐in‐aid for scientific research on priority areas from the Ministry of Education, Culture, Sports, Science and Technology of Japan and a grant‐in‐aid for scientific research on priority areas from the Japan Society for the Promotion of Science.
References
- 1. Lau WY, Lai EC. Hepatocellular carcinoma: current management and recent advances. Hepatobiliary Pancreat Dis Int 2008; 7: 237–57. [PubMed] [Google Scholar]
- 2. Hotte SJ, Hirte HW. BAY 43‐9006: early clinical data in patients with advanced solid malignancies. Curr Pharm Des 2002; 8: 2249–53. [DOI] [PubMed] [Google Scholar]
- 3. Kane RC, Farrell AT, Madabushi R et al. Sorafenib for the treatment of unresectable hepatocellular carcinoma. Oncologist 2009; 14: 95–100. [DOI] [PubMed] [Google Scholar]
- 4. El‐Serag HB, Marrero JA, Rudolph L, Reddy KR. Diagnosis and treatment of hepatocellular carcinoma. Gastroenterology 2008; 134: 1752–63. [DOI] [PubMed] [Google Scholar]
- 5. Hanahan D, Weinberg RA. The hallmarks of cancer. Cell 2000; 100: 57–70. [DOI] [PubMed] [Google Scholar]
- 6. Bonnet D, Dick JE. Human acute myeloid leukemia is organized as a hierarchy that originates from a primitive hematopoietic cell. Nat Med 1997; 3: 730–7. [DOI] [PubMed] [Google Scholar]
- 7. Al‐Hajj M, Wicha MS, Benito‐Hernandez A, Morrison SJ, Clarke MF. Prospective identification of tumorigenic breast cancer cells. Proc Natl Acad Sci U S A 2003; 100: 3983–8. [DOI] [PMC free article] [PubMed] [Google Scholar]
- 8. Singh SK, Clarke ID, Terasaki M et al. Identification of a cancer stem cell in human brain tumors. Cancer Res 2003; 63: 5821–8. [PubMed] [Google Scholar]
- 9. Singh SK, Clarke ID, Hide T, Dirks PB. Cancer stem cells in nervous system tumors. Oncogene 2004; 23: 7267–73. [DOI] [PubMed] [Google Scholar]
- 10. Singh SK, Hawkins C, Clarke ID et al. Identification of human brain tumour initiating cells. Nature 2004; 432: 396–401. [DOI] [PubMed] [Google Scholar]
- 11. O’Brien CA, Pollett A, Gallinger S, Dick JE. A human colon cancer cell capable of initiating tumour growth in immunodeficient mice. Nature 2007; 445: 106–10. [DOI] [PubMed] [Google Scholar]
- 12. Al‐Hajj M, Clarke MF. Self‐renewal and solid tumor stem cells. Oncogene 2004; 23: 7274–82. [DOI] [PubMed] [Google Scholar]
- 13. Visvader JE, Lindeman GJ. Cancer stem cells in solid tumours: accumulating evidence and unresolved questions. Nat Rev Cancer 2008; 8: 755–68. [DOI] [PubMed] [Google Scholar]
- 14. Guan Y, Gerhard B, Hogge DE. Detection, isolation, and stimulation of quiescent primitive leukemic progenitor cells from patients with acute myeloid leukemia (AML). Blood 2003; 101: 3142–9. [DOI] [PubMed] [Google Scholar]
- 15. Guzman ML, Swiderski CF, Howard DS et al. Preferential induction of apoptosis for primary human leukemic stem cells. Proc Natl Acad Sci U S A 2002; 99: 16220–5. [DOI] [PMC free article] [PubMed] [Google Scholar]
- 16. Chiba T, Kita K, Zheng YW et al. Side population purified from hepatocellular carcinoma cells harbors cancer stem cell‐like properties. Hepatology 2006; 44: 240–51. [DOI] [PubMed] [Google Scholar]
- 17. Lee JS, Heo J, Libbrecht L et al. A novel prognostic subtype of human hepatocellular carcinoma derived from hepatic progenitor cells. Nat Med 2006; 12: 410–16. [DOI] [PubMed] [Google Scholar]
- 18. Ma S, Chan KW, Hu L et al. Identification and characterization of tumorigenic liver cancer stem/progenitor cells. Gastroenterology 2007; 132: 2542–56. [DOI] [PubMed] [Google Scholar]
- 19. Yang ZF, Ho DW, Ng MN et al. Significance of CD90+ cancer stem cells in human liver cancer. Cancer Cell 2008; 13: 153–66. [DOI] [PubMed] [Google Scholar]
- 20. Yamashita T, Forgues M, Wang W et al. EpCAM and alpha‐fetoprotein expression defines novel prognostic subtypes of hepatocellular carcinoma. Cancer Res 2008; 68: 1451–61. [DOI] [PubMed] [Google Scholar]
- 21. Balzar M, Winter MJ, De Boer CJ, Litvinov SV. The biology of the 17‐1A antigen (Ep‐CAM). J Mol Med 1999; 77: 699–712. [DOI] [PubMed] [Google Scholar]
- 22. Osta WA, Chen Y, Mikhitarian K et al. EpCAM is overexpressed in breast cancer and is a potential target for breast cancer gene therapy. Cancer Res 2004; 64: 5818–24. [DOI] [PubMed] [Google Scholar]
- 23. Li C, Heidt DG, Dalerba P et al. Identification of pancreatic cancer stem cells. Cancer Res 2007; 67: 1030–7. [DOI] [PubMed] [Google Scholar]
- 24. Watanabe Y, Takahashi T, Okajima A et al. The analysis of the functions of human B and T cells in humanized NOD/shi‐scid/gammac(null) (NOG) mice (hu‐HSC NOG mice). Int Immunol 2009; 21: 843–58. [DOI] [PubMed] [Google Scholar]
- 25. Ito M, Hiramatsu H, Kobayashi K et al. NOD/SCID/gamma(c)(null) mouse: an excellent recipient mouse model for engraftment of human cells. Blood 2002; 100: 3175–82. [DOI] [PubMed] [Google Scholar]
- 26. Ishikawa F, Yasukawa M, Lyons B et al. Development of functional human blood and immune systems in NOD/SCID/IL2 receptor {gamma} chain(null) mice. Blood 2005; 106: 1565–73. [DOI] [PMC free article] [PubMed] [Google Scholar]
- 27. Machida K, Suemizu H, Kawai K et al. Higher susceptibility of NOG mice to xenotransplanted tumors. J Toxicol Sci 2009; 34: 123–7. [DOI] [PubMed] [Google Scholar]
- 28. Quintana E, Shackleton M, Sabel MS, Fullen DR, Johnson TM, Morrison SJ. Efficient tumour formation by single human melanoma cells. Nature 2008; 456: 593–8. [DOI] [PMC free article] [PubMed] [Google Scholar]
- 29. Yamazaki H, Nishida H, Iwata S, Dang NH, Morimoto C. CD90 and CD110 correlate with cancer stem cell potentials in human T‐acute lymphoblastic leukemia cells. Biochem Biophys Res Commun 2009; 383: 172–7. [DOI] [PubMed] [Google Scholar]
- 30. Yamashita T, Ji J, Budhu A et al. EpCAM‐positive hepatocellular carcinoma cells are tumor‐initiating cells with stem/progenitor cell features. Gastroenterology 2009; 136: 1012–24. [DOI] [PMC free article] [PubMed] [Google Scholar]
- 31. Hirohashi S, Shimosato Y, Kameya T et al. Production of alpha‐fetoprotein and normal serum proteins by xenotransplanted human hepatomas in relation to their growth and morphology. Cancer Res 1979; 39: 1819–28. [PubMed] [Google Scholar]
- 32. Alexander J, Bey E, Whitcutt JM, Gear JH. Adaptation of cells derived from human malignant tumours to growth in vitro . S Afr J Med Sci 1976; 41: 89–98. [PubMed] [Google Scholar]
- 33. Kogure T, Ueno Y, Iwasaki T, Shimosegawa T. The efficacy of the combination therapy of 5‐fluorouracil, cisplatin and leucovorin for hepatocellular carcinoma and its predictable factors. Cancer Chemother Pharmacol 2004; 53: 296–304. [DOI] [PubMed] [Google Scholar]
- 34. Zhou J, Yu Z, Zhao S et al. Lentivirus‐Based DsRed‐2‐Transfected Pancreatic Cancer Cells for Deep In Vivo Imaging of Metastatic Disease. J Surg Res 2009; 157: 63–70. [DOI] [PubMed] [Google Scholar]
- 35. Yang ZF, Ngai P, Ho DW et al. Identification of local and circulating cancer stem cells in human liver cancer. Hepatology 2008; 47: 919–28. [DOI] [PubMed] [Google Scholar]
- 36. Yin S, Li J, Hu C et al. CD133 positive hepatocellular carcinoma cells possess high capacity for tumorigenicity. Int J Cancer 2007; 120: 1444–50. [DOI] [PubMed] [Google Scholar]
- 37. Ma S, Lee TK, Zheng BJ, Chan KW, Guan XY. CD133+ HCC cancer stem cells confer chemoresistance by preferential expression of the Akt/PKB survival pathway. Oncogene 2008; 27: 1749–58. [DOI] [PubMed] [Google Scholar]
- 38. Zen Y, Fujii T, Yoshikawa S et al. Histological and culture studies with respect to ABCG2 expression support the existence of a cancer cell hierarchy in human hepatocellular carcinoma. Am J Pathol 2007; 170: 1750–62. [DOI] [PMC free article] [PubMed] [Google Scholar]
- 39. Chiba T, Zheng YW, Kita K et al. Enhanced self‐renewal capability in hepatic stem/progenitor cells drives cancer initiation. Gastroenterology 2007; 133: 937–50. [DOI] [PubMed] [Google Scholar]
- 40. Schmelzer E, Zhang L, Bruce A et al. Human hepatic stem cells from fetal and postnatal donors. J Exp Med 2007; 204: 1973–87. [DOI] [PMC free article] [PubMed] [Google Scholar]
- 41. Rao MS, Khan AA, Parveen N, Habeeb MA, Habibullah CM, Pande G. Characterization of hepatic progenitors from human fetal liver during second trimester. World J Gastroenterol 2008; 14: 5730–7. [DOI] [PMC free article] [PubMed] [Google Scholar]
- 42. Fillmore CM, Kuperwasser C. Human breast cancer cell lines contain stem‐like cells that self‐renew, give rise to phenotypically diverse progeny and survive chemotherapy. Breast Cancer Res 2008; 10: R25. [DOI] [PMC free article] [PubMed] [Google Scholar]
- 43. Yamashita T, Budhu A, Forgues M, Wang XW. Activation of hepatic stem cell marker EpCAM by Wnt‐beta‐catenin signaling in hepatocellular carcinoma. Cancer Res 2007; 67: 10831–9. [DOI] [PubMed] [Google Scholar]
- 44. Maetzel D, Denzel S, Mack B et al. Nuclear signalling by tumour‐associated antigen EpCAM. Nat Cell Biol 2009; 11: 162–71. [DOI] [PubMed] [Google Scholar]
- 45. Yoo BK, Emdad L, Su ZZ et al. Astrocyte elevated gene‐1 regulates hepatocellular carcinoma development and progression. J Clin Invest 2009; 119: 465–77. [DOI] [PMC free article] [PubMed] [Google Scholar]
- 46. Tirino V, Desiderio V, D’Aquino R et al. Detection and characterization of CD133+ cancer stem cells in human solid tumours. PLoS ONE 2008; 3: e3469. [DOI] [PMC free article] [PubMed] [Google Scholar]