

Abstract
Kallikrein‐related peptidases, a subgroup of the serine protease enzyme family, are considered important prognostic biomarkers in cancer. In the present study, we sought to determine the prognostic value of kallikrein‐related peptidase 6 (KLK6) in ovarian cancer using a novel method of compartmentalized in situ protein analysis. A tissue array composed of 150 advanced stage ovarian cancers, uniformly treated with surgical debulking followed by platinum‐paclitaxel combination chemotherapy, was constructed. For evaluation of KLK6 protein expression, we used an immunofluorescence‐based method of automated in situ quantitative measurement of protein analysis (AQUA). Mean follow‐up time of the cohort was 34.35 months. One hundred and thirty‐five of 150 cases had sufficient tissue for AQUA analysis. In univariate survival analysis, low tumor KLK6 expression was associated with better outcome for overall survival over 3 years (P = 0.019). There was no association between tumor KLK6 expression and progression‐free survival (P = 0.128). In multivariate survival analysis, adjusting for well‐characterized prognostic variables, low tumor KLK6 expression level was one of the most significant predictor variable for overall survival (95% confidence interval, 1.19–3.50; P = 0.009). High tumor KLK6 protein expression is associated with inferior patient outcome in ovarian cancer. KLK6 may represent a promising disease biomarker and therapeutic target in ovarian cancer. (Cancer Sci 2008; 99: 2224–2229)
Ovarian cancer is mainly a disease of postmenopausal women and is more lethal than all other gynecological malignancies combined. In early stage disease (stage I, II) 5‐year survival is 85%, while in advanced stage disease (stage III, IV) 5‐year survival is only 20%.( 1 ) Unfortunately, no effective strategy exists for screening of the general population for ovarian cancer and the disease is usually diagnosed at advanced stage.
The clinicopathological parameters do not accurately classify patients in terms of prognosis. CA125 is the only well validated ovarian cancer marker. Approximately 80% of patients with advanced ovarian cancer will have an elevated CA125. However, CA125 is reliable only in monitoring response to treatment or disease recurrence and not as a diagnostic or prognostic marker.( 2 ) Therefore, considerable interest lies in identifying molecular prognostic indicators in order to guide treatment decisions.
Kallikrein‐related peptidases are a subgroup of the serine protease enzyme family which contains 15 members.( 3 ) The human kallikrein gene locus is localized on chromosome 19q13.4.( 4 ) Kallikrein‐related peptidases are expressed in several human tissues, mainly the hormone‐producing or hormone‐dependent ones such as breast, ovary, prostate and testis. In cancer cell lines all kallikreins are under sex steroid hormone regulation.( 5 , 6 , 7 ) The involvement of serine proteases in cascade pathways such as digestion, coagulation, fibrinolysis and apoptosis is well documented and there are hypothetical models implicating multiple kallikrein overexpression during progression of ovarian cancer into a more aggressive phenotype.( 8 ) Kallikrein‐related peptidases promote degradation of the extracellular matrix, thus facilitating invasion and metastasis.( 9 ) It seems that multiple members of the human kallikrein gene family are deregulated in ovarian cancer.( 10 , 11 ) It is possible that some of these proteases have applications as disease biomarkers and therapeutic targets.
In the present study, we sought to determine whether kallikrein‐related peptidase 6 (KLK6) protein level is associated with clinical outcome in a large cohort of uniformly treated patients with advanced epithelial ovarian cancer using a novel in situ quantitative method of protein expression.
Materials and Methods
Patient population. Inclusion criteria were primary epithelial ovarian cancer patients (International Federation of Gynecology and Obstetrics [FIGO] stages III and IV) who underwent surgical resection in the Department of Gynecology of Alexandra University Hospital in Athens between 1996 and 2003 and treated postoperatively with carboplatin and paclitaxel chemotherapy. In all cases, an effort was made for optimal surgical cytoreduction and adequate staging, which included at least: total abdominal hysterectomy (TAH) with bilateral salpingo‐oophorectomy (BSO); inspection and palpation of all peritoneal surfaces and retroperitoneal area; and biopsies of suspect lesions for metastases, infracolic omentectomy and peritoneal washings. Grading was performed by evaluation of tumor architecture, the amount of solid neoplastic areas, nucleus‐cytoplasm ratio and nuclear pleomorphism. The tumors were subdivided into three groups according to these criteria: well‐differentiated (G1); moderately differentiated (G2); and poorly differentiated (G3). Institutional ethical approval from Alexandra University Hospital and patient consent for using the samples was obtained.
Chemotherapy was instituted 2–3 weeks after surgery. All patients received platinum‐paclitaxel chemotherapy. Gynecological examination, CA‐125 assay, and radiological investigations, if necessary, were performed monthly for the clinical assessment of response, which was recorded according to World Health Organization criteria.( 12 ) Follow‐up examinations were performed every month.
Tissue microarray construction. A tissue microarray consisting of tumors from each patient in the cohort was constructed at the Yale University Tissue Microarray Facility. Following institutional review board approval, the tissue microarray was constructed as previously described, including 150 cases.( 13 ) Tissue cores 0.6 mm in size were obtained from paraffin‐embedded formalin‐fixed tissue blocks from the Alexandra University Hospital Department of Pathology archives. Hematoxylin–eosin stained slides from all blocks were first reviewed by a pathologist to select representative areas of invasive tumor to be cored. The cores were placed on the recipient microarray block using a Tissue Microarrayer (Beecher Instrument, Silver Spring, MD, USA). All tumors were represented with twofold redundancy. Previous studies have demonstrated that the use of tissue microarrays containing one to two histospots provides a sufficiently representative sample for analysis by immunohistochemistry. Addition of a duplicate histospot, while not necessary, does provide marginally improved reliability.( 13 ) The tissue microarray was then cut to yield 5‐µm sections and placed on glass slides using an adhesive tape transfer system (Instrumedics, Hackensack, NJ, USA) with ultraviolet cross‐linking.
Quantitative immunofluorescence‐based method. Tissue microarray slides were deparaffinized and stained as previously described.( 14 ) In brief, slides were deparaffinized with xylene followed by ethanol. Following rehydration in dH20, antigen retrieval was accomplished by pressure cooking in 0.1 mol/L citrate buffer (pH 6.0). Endogenous peroxidase activity was blocked by incubating in 0.3% hydrogen peroxide in methanol for 30 min. Non‐specific antibody binding was then blocked with 0.3% bovine serum albumin (BSA) for 30 min at room temperature. Primary rabbit polyclonal antibody to KLK6 was used at 1:50 dilution in 0.3% BSA/Tris‐buffered saline. This antibody has been validated in previous studies using immunohistochemistry, western blotting, and neoplastic tissue.( 15 , 16 , 17 ) Following these steps, slides were incubated with primary antibody at 4°C overnight. Subsequently, slides were incubated with goat antirabbit secondary antibody conjugated to a horseradish peroxidase‐decorated dextran polymer backbone (Envision; DAKO, Carpinteria, CA, USA) for 1 h at room temperature. Tumor cells were identified by use of anticytokeratin antibody cocktail (mouse antipancytokeratin antibody z0622; DAKO) with subsequent goat antimouse antibody conjugated to Alexa546 fluourophore (A11035; Molecular Probes, Eugene, OR, USA). We added 4,6‐diamino‐2‐phenylindole (DAPI) to visualize nuclei. Target (kallikrein‐related peptidase 6) molecules were visualized with a fluorescent chromogen (Cy‐5‐tyramide; Perkin Elmer, Wellesley, MA, USA). Cy‐5 (red) was used because its emission peak is well outside the green‐orange spectrum of tissue autofluorescence. Slides were mounted with a polyvinyl alcohol‐containing aqueous mounting media with antifade reagent (n‐propyl gallate, Acros Organics, Vernon Hills, IL, USA) (Fig. 1).
Figure 1.
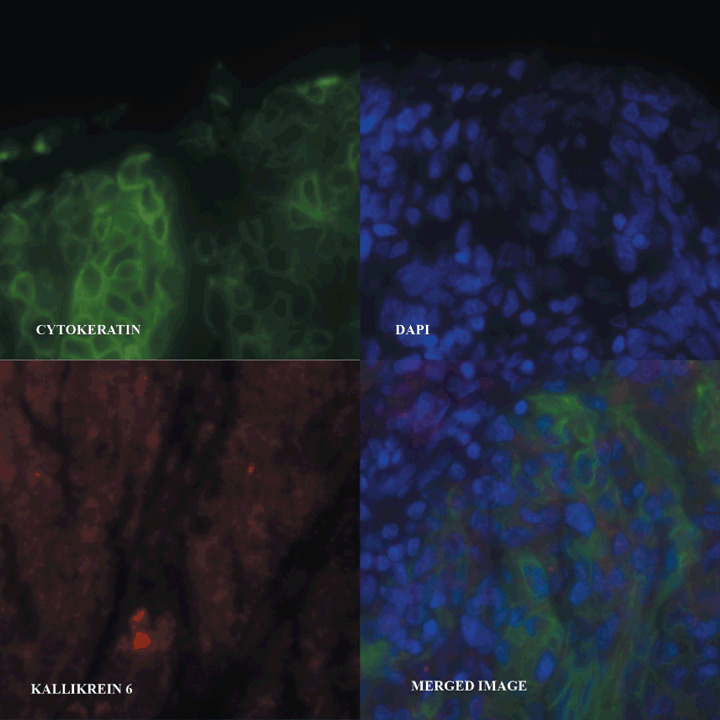
Protein expression of kallikrein‐related peptidase 6 (KLK6) was determined using automated quantitative analysis (AQUA) analysis based on immunofluorescence. Digital images of each tumor spot were captured using Cy3 anticytokeratin antibody to generate a tumor mask. 4,6‐Diamidino‐2‐phelynindole (DAPI) was used to visualize nuclei and Cy5 was used to visualize KLK6. The individual images are related to adjacent areas of the original tissue section and only the bottom right image is a three‐color merged image.
Automated image acquisition and analysis. Automated image acquisition and analysis using automated quantitative analysis (AQUA) has been described previously.( 18 , 19 ) In brief, monochromatic, high‐resolution (1024 × 1024 pixels; 0.5 µm) images were obtained of each histospot. We distinguished areas of tumor from stromal elements by creating a mask from the cytokeratin signal. The cytokeratin signal was used to define cytoplasm and the array was DAPI counterstained to visualize the nuclear compartment. Overlapping pixels (to a 99% confidence interval [CI]) were excluded from both compartments. The KLK6 signal (AQUA score) was scored on a normalized scale of 1–255 expressed as pixel intensity divided by the target area. AQUA scores for duplicate tissue cores were averaged to obtain a mean AQUA score for each tumor.
Statistical analysis. Histospots containing less than 10% tumor as assessed by mask area (automated), were excluded from further analysis. AQUA scores represent expression of a target protein on a continuous scale from 1 to 255. It is often useful to categorize continuous variable in order to stratify patients into high versus low categories. Several methods exist to determine a cut‐off point, including biological determination, splitting at the median and determination of the cut‐off point which maximizes effect difference between groups. If the latter method (the so‐called ‘optimal P‐value’ approach) is used, a dramatic inflation of type I error rates can result.( 20 ) A recently developed program, X‐Tile, allows determination of an optimal cut‐off point while correcting for the use of minimum P‐value statistics.( 21 ) As the AQUA technology is new, there are no established cut‐off point available for quantitative KLK6 expression. Therefore, for categorization of KLK6 expression levels, the X‐tile program was used to generate an optimal cut‐off point. This approach has been successfully applied to AQUA data analysis.( 21 ) Two methods of statistical correction for the use of minimal P‐value approach were utilized. First, the X‐Tile program output includes calculation of a Monte Carlo P‐value for the optimal cut‐off point generated. Cut‐off points that yield Monte Carlo P < 0.05 are considered robust and unlikely to represent type I error. Second, the Miller–Siegmund minimal P‐value correction referenced by Altman et al. was utilized.( 19 ) This approach is accepted in the statistical published work, but relatively unknown in the medical/biological research community. Briefly, when making multiple comparisons to find the minimum P‐value using the log–rank test, the false high rate (i.e. the percentage of times a marker that has no true prognostic value will be found to have a P < 0.05) can approach 40%. Altman's statistical adjustment generates a minimum P‐value corrected to yield a true false‐high rate of 5%. The corrected P‐value (Pcor) is calculated as follows:
Pcor = phi (zeta) (zeta – [1/zeta]) log (e) ([1‐epsilon] < 2 > /epsilon < 2 > ) + 4 phi (zeta)/zeta
where phi indicates the probability density function, Pmin is the minimum p‐value generated by evaluating multiple cut‐off points, zeta is the (1‐Pmin/2)‐quantile of the standard normal distribution, and epsilon denotes the proportion of values excluded from consideration as an optimal cut‐off point. Our calculations were performed using an epsilon of 0.10. Progression‐free survival and overall survival were subsequently assessed by Kaplan–Meier analysis with log–rank for determining statistical significance, and only the P‐corrected was reported. This approach has been successfully applied to AQUA data analysis.( 22 ) All survival analysis was performed at 3‐year cut‐offs. Confidence intervals were assessed by univariate and multivariate Cox proportional hazards models. Overall survival was defined as time from day of surgery to death from any cause. Progression‐free survival was defined as time from day of surgery to either death from any cause or disease progression (assessed by CA125 increase and/or imaging studies). Performance status was dichotomized into ‘0’ versus all others, histological type into serous versus all others and clinical response into complete response versus all others. Although several cut‐off values of residual volume tumor have been proposed, it has been reported that gradual gradations of residual disease can affect ovarian cancer prognosis. Our patient population was divided into two groups according to the extent of residual disease at first surgery: less than or equal to 1 cm and greater than 1 cm. Comparisons of KLK6 expression with FIGO stage and grade was made by Mantel–Haenszel χ2‐test. Comparisons of KLK6 expression with performance status, histology, clinical response and residual disease were made by Fisher's exact test. Comparison of KLK6 expression status with age was made using Pearson's correlation. All calculations and analyses were performed with Statview version 5.0 (S.A.S. Institute).
Results
Clinical and pathological variable analysis. One hundred and fifty patients were included in the study. Mean follow‐up time (range) for the entire cohort was 34.35 months (range, 1–91.7). There were 117 (77.5%) FIGO stage III and 33 (22.5%) stage IV. One hundred and three (61%) patients had tumors of serous histology. Initial histological grade was 14 well‐differentiated (9%), 49 moderately differentiated (33%) and 87 poorly differentiated (58%). Following initial surgical debulking, residual disease by size was distributed as follows: 26 (17.33%) with less than 1 cm and 124 (82.66%) with more than 1 cm. For clinical response to initial therapy, complete response (CR) was recorded in 56 (37.3%) patients, and partial response (PR) or stable disease/no response (SD/NR) in 94 (62.7%) patients. Demographic and clinicopathological variables for the cohort are summarized in Table 1.
Table 1.
Demographic, clinical and histomorphological data
| Variable | n | n (with AQUA data) | KLK6 low expressors | KLK6 high expressors | P |
|---|---|---|---|---|---|
| Age | |||||
| ≤60 | 72 | 67 | 61 | 6 | 0.206 |
| >60 | 78 | 68 | 57 | 11 | |
| Differentiation | |||||
| Poor | 86 | 80 | 73 | 7 | |
| Moderate | 49 | 42 | 33 | 9 | 0.1 |
| Well | 14 | 13 | 12 | 1 | |
| Initial histology | |||||
| Serous | 103 | 94 | 80 | 14 | 0.222 |
| All others | 47 | 41 | 38 | 3 | |
| FIGO stage | |||||
| III | 117 | 105 | 92 | 13 | 0.541 |
| IV | 33 | 30 | 26 | 4 | |
| Residual disease | |||||
| ≤1 cm | 26 | 25 | 24 | 1 | 0.155 |
| >1 cm | 124 | 111 | 95 | 16 | |
| Clinical response to chemotherapy | |||||
| CR | 56 | 49 | 41 | 8 | 0.323 |
| All others | 94 | 86 | 77 | 9 | |
| Performance status | |||||
| No impairment | 103 | 92 | 82 | 10 | |
| All others | 47 | 43 | 36 | 7 | 0.377 |
AQUA, automated quantitative analysis; CR, complete response; FIGO, International Federation of Gynecology and Obstetrics; KLK6, kallikrein‐related peptidase 6.
Quantitative immunofluorescence‐based method for KLK6 protein expression and generation of optimal cut‐off point by X‐Tile analysis. Of 150 patients included in this study, 135 (90%) had sufficient tissue for analysis of KLK6 protein expression by AQUA. Tissues deemed insufficient had less than 10% tumor mask within the histospot, as represented on the tissue microarrays. Normalized AQUA scores were represented on a 1–255 scale and KLK6 expression followed a skewed distribution as expected for a cancer tissue biomarker with a range of AQUA scores of 0–70 (Fig. 2). Using the X‐Tile program, an optimal cut‐off point for tumor KLK6 expression was determined at 44.3 AQUA units, with a Monte Carlo P‐value of 0.022 as determined by X‐Tile. Monte Carlo P‐values less than 0.05 indicate robust and valid cut‐off point selection. Patients with tumor KLK6 protein expression less than or equal to 44.3 were classified as KLK6 low (n = 118), and patients with tumor KLK6 protein expression greater than 44.3 were classified as KLK6 high (n = 17). The mean score for the KLK6 high tumors is 54.3 with a standard deviation of 7.6; the mean score for KLK6 low tumors is 19.9 with a standard deviation of 10.9.
Figure 2.
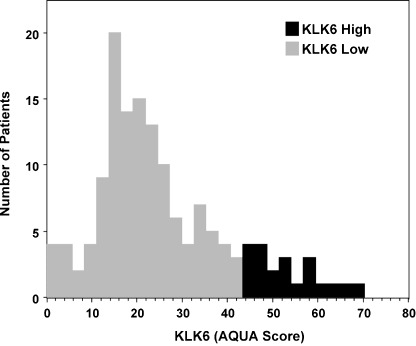
Expression of kallikrein‐related peptidase 6 (KLK6) shows a normal distribution with a right‐sided tail and a range of automated quantitative analysis (AQUA) scores from 0–70. The mean score for the KLK6 high tumors is 54.3 with a standard deviation of 7.6; the mean for KLK6 low tumors is 19.9 with a standard deviation of 10.9.
Association of KLK6 expression and clinicopathological variables. There was no association between tumor KLK6 protein expression and clinicopathological variables including age, differentiation, histological type, histological grade, FIGO stage, residual disease, clinical response to chemotherapy and performance status (Table 1).
Univariate survival analysis. Tumor AQUA expression levels of KLK6 were examined for association with 3‐year overall survival (OS) and progression‐free survival (PFS) using Kaplan–Meier survival analysis with log–rank for determining significance. Continuous univariate analysis of KLK6 reveals its significance (P = 0.020). As use of an optimized cut‐off point can result in increased type I error (false positive), the Miller–Siegmund (MS) correction method was applied to all Kaplan–Meier analyses. Kaplan–Meier survival curves generated for tumor KLK6 protein expression, high versus low expression, are given in Fig. 3. Low tumor KLK6 expression was associated with better outcome for overall survival (P = 0.019). There was no association between tumor KLK6 expression and PFS (P = 0.128) (Table 2).
Figure 3.
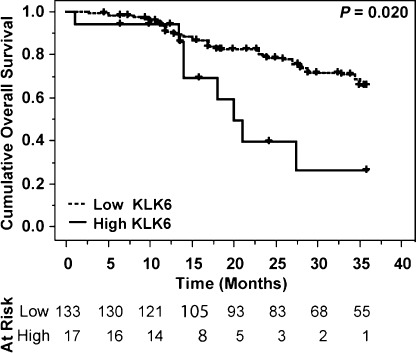
Kaplan–Meier survival analysis for overall survival by kallikrein‐related peptidase 6 expression levels as determined by automated quantitative analysis (AQUA) quantitative analysis. Patients with low kallikrein‐related peptidase 6 (KLK6) expression had improved 3‐year overall survival (Miller–Siegmund P‐value = 0.019, Cox continuous univariate analysis P‐value = 0.020). There are 17 patients in the high category (with eight events), and 133 in the low category (with 38 events). Censor times are denoted with ticks.
Table 2.
Univariate 3‐year survival analysis (Kaplan–Meier log–rank)
| KLK6 expression class (tumor mask) | Median survival (months) | Relative risk (95% confidence interval) | P cor * |
|---|---|---|---|
| Progression‐free survival | |||
| KLK6 low | 17.0 | 0.59 (0.30–1.16) | 0.128 |
| KLK6 high | 12.0 | ||
| Overall survival | |||
| KLK6 low | 28.9 | 0.36 (0.16–0.78) | 0.019 |
| KLK6 high | 17.4 | ||
P‐value corrected using the Miller–Siegmund method. KLK6, kallikrein‐related peptidase 6.
Multivariable survival analysis. Using the Cox proportional hazards model, we performed multivariable analysis to assess the predictive value of tumor KLK6 expression. Tumor KLK6 expression by AQUA was analyzed for overall survival. We also included the following well‐recognized prognostic variables in the regression model: age; FIGO stage; differentiation grade; residual disease; response to chemotherapy; and initial histology. Low tumor KLK6 level (95% CI, 1.19–3.50; P = 0.009) along with FIGO stage (95% CI, 1.08–2.54; P = 0.021) were significant predictor variables of overall survival. To the contrary, histology, differentiation grade, clinical response to chemotherapy and residual disease were not significant predictor variables of overall survival. Results of multivariable survival analyses are summarized in Table 3.
Table 3.
Multivariate 3‐year survival analysis by Cox regression
| Variable | n | Hazard ratio (95% confidence interval) | P |
|---|---|---|---|
| Histology | |||
| Serous | 103 | 1.13 (0.77–1.66) | 0.520 |
| All others | 47 | 1.00 | |
| FIGO stage | |||
| IV | 33 | 1.65 (1.08–2.54) | 0.021 |
| III | 117 | 1.00 | |
| Grade | |||
| Poor | 86 | 0.88 (0.63–1.25) | 0.500 |
| All others | 63 | 1.00 | |
| Clinical response to chemotherapy | |||
| All others | 94 | 1.36 (0.94–1.98) | 0.103 |
| Complete response | 56 | 1.00 | |
| Residual disease | |||
| >1 cm | 124 | 1.20 (0.76–1.91) | 0.671 |
| ≤1 cm | 26 | 1.00 | |
| KLK6 (in tumor mask) | |||
| High | 17 | 2.04 (1.19–3.50) | 0.009 |
| Low | 133 | 1.00 | |
P‐value corrected using the Miller–Siegmund method. FIGO, International Federation of Gynecology and Obstetrics; KLK6, kallikrein‐related peptidase 6.
Discussion
Ovarian cancer remains the most lethal disease among all gynecological malignancies. Traditional clinicopathological parameters do not accurately classify patients in relation to prognosis. The discovery of new biomarkers that are suitable for early disease diagnosis and prognosis may ultimately lead to improved patient management and outcomes. In the present study, we sought to determine the prognostic value of quantitatively assessed KLK6 protein expression in advanced ovarian cancer. KLK6 has been shown to be regulated by hormones and may represent a downstream molecule by which a hormone‐related neoplasm such as ovarian cancer initiate and progress through degradation of the extracellular matrix.( 23 )
In ovarian cancer cells, KLK6 overexpression increases their invasive potential. In our previous work, stable co‐transfection of OV‐MZ‐6 ovarian cancer cells with plasmids expressing KLK4, KLK5, KLK6 and KLK7 showed significantly increased invasive behavior in an in vitro Matrigel invasion assay (P < 0.01; Mann–Whitney U‐test). Simultaneous expression of KLK4, KLK5, KLK6 and KLK7 in cancer cells inoculated into the peritoneum of nude mice resulted in a remarkable 92% mean increase in tumor burden compared to the vector‐control cell line.( 24 ) Measurement of serum KLK6 level in serum of 97 apparently healthy women, 141 women with benign abdominal diseases and 146 women with histologically proven primary ovarian carcinoma showed that KLK6 elevation was limited to ovarian cancer patients whereas normal subjects and patients with benign diseases had normal KLK6 levels. Preoperative serum KLK6 concentration was a powerful predictor of progression‐free and overall survival in both univariate and multivariate analyses. KLK6 level was higher in patients with late stage, higher grade disease and in patients with serous histotype, meanwhile patients with high concentration of serum KLK6 were refractory to chemotherapy and destined to relapse and die.( 25 )
Our study is the first to examine KLK6 protein expression in advanced ovarian carcinoma using a novel quantitative in situ method of protein analysis (AQUA). Our goal was to quantitatively assess expression of KLK6 on a cohort of ovarian cancer specimens in an objective, automated fashion and to evaluate the association between KLK6 expression and clinical outcome. We utilized a novel quantitative in situ method of protein analysis which allows measurements of protein expression within subcellular compartments that results in a number directly proportional to the number of molecules expressed per unit area. Thus, we avoid biases introduced from the arbitrary cut‐off points used in conventional immunohistochemistry studies while at the same time preserving spatial and morphological information that techniques such as western blotting lose. We demonstrated KLK6 expression to be a robust predictor of overall survival in our cohort of patients with advanced ovarian cancer. In multivariable analysis, KLK6 protein expression status retained its prognostic significance for overall survival with FIGO stage factor that significantly influence survival. For PFS, our findings are not on the contrary with previous studies, which noted a correlation between preoperative serum levels and both progression‐free survival PFS and OS.( 25 ) In our study, there was a difference for PFS but this was not statistically significant to reveal KLK6 as an unfavorable factor. In the present study, we included only advanced‐stage ovarian cancer. The different technology combined with the different patient population probably account for these findings. Studies with a large number of patients and extended follow ups will be required to ascertain the prognostic value of KLK6 for PFS.
Kallikrein‐related peptidase 6 plays an adverse role in prognosis of patients with ovarian cancer. The possibilities that KLK6 may be suitable candidate as a disease and prognosis biomarker or therapeutic target merit further investigation.
Acknowledgments
This study was funded by the Yale School of Medicine Institutional startup funds (A.P.).
References
- 1. Jemal A, Siegel R, Ward E et al . American Cancer Society . Cancer statistics, 2008. CA Cancer J Clin 2008; 54: 71–96. [DOI] [PubMed] [Google Scholar]
- 2. Meyer T, Rustin GJ. Role of tumour markers in monitoring epithelial ovarian cancer. Br J Cancer 2000; 82: 1535–8. [DOI] [PMC free article] [PubMed] [Google Scholar]
- 3. Paliouras M, Diamandis EP. The kallikrein world: an update on the human tissue kallikreins. Biol Chem 2006; 387: 643–52. [DOI] [PubMed] [Google Scholar]
- 4. Yousef GM, Chang A, Scorilas A et al . Genomic organization of the human kallikrein gene family on chromosome 19q13.3–q13.4. Biochem Biophys Res Commun 2000; 276: 125–33. [DOI] [PubMed] [Google Scholar]
- 5. Paliouras M, Diamandis EP. Coordinated steroid hormone‐dependent and independent expression of multiple kallikreins in breast cancer cell lines. Breast Cancer Res Treat 2006; 102: 7–18. [DOI] [PubMed] [Google Scholar]
- 6. Shaw JL, Diamandis EP. Distribution of 15 human kallikreins in tissues and biological fluids. Clin Chem 2007; 53 (8): 1423–32. [DOI] [PubMed] [Google Scholar]
- 7. Talieri M, Diamandis EP, Gourgiotis D et al . Expression analysis of the human kallikrein 7 (KLK7) in breast tumors: a new potential biomarker for prognosis of breast carcinoma. Thromb Haemost 2004; 91 (1): 180–6. [DOI] [PubMed] [Google Scholar]
- 8. Diamandis EP, Yousef GM. Human Tissue Kallikreins: a family of new cancer biomarkers. Clin Chem 2002; 48: 1198–205. [PubMed] [Google Scholar]
- 9. Woodhouse EC, Chuaqui RF, Liotta LA. General mechanisms of metastasis. Cancer 1997; 80: 1529–37. [DOI] [PubMed] [Google Scholar]
- 10. Yousef GM, Polymeris ME, Yacoub GM et al . Parallel overexpression of seven kallikrein genes in ovarian cancer. Cancer Res 2003; 63: 2223–7. [PubMed] [Google Scholar]
- 11. Psyrri A, Kountourakis P, Scorilas A. Human tissue kallikrein 7, a novel biomarker for advanced ovarian carcinoma using a novel in situ quantitative method of protein expression. Ann Oncol 2008; 19 (7): 1271–7. [DOI] [PubMed] [Google Scholar]
- 12. World Health Organization . WHO Handbook for Reporting Results of Cancer Treatment16–21 GW: Geneva, 1979; 16–21.
- 13. Rimm DL, Camp RL, Charette LA et al . Tissue microarray: a new technology for amplification of tissue resources. Cancer J 2001; 7: 24–31. [PubMed] [Google Scholar]
- 14. Psyrri A, Kountourakis P, Yu Z et al . Analysis of p53 protein expression levels on ovarian cancer tissue microarray using automated quantitative analysis (AQUA) elucidates prognostic patient subsets. Ann Oncol 2007; 18 (4): 709–15. [DOI] [PubMed] [Google Scholar]
- 15. Hoffman BR, Katsaros D, Scorilas A et al . Immunofluorometric quantitation and histochemical localisation of kallikrein 6 protein in ovarian cancer tissue: a new independent unfavourable prognostic biomarker. Br J Cancer 2002; 87 (7): 763–71. [DOI] [PMC free article] [PubMed] [Google Scholar]
- 16. Komatsu N, Saijoh K, Toyama T et al . Multiple tissue kallikrein mRNA and protein expression in normal skin and skin diseases. Br J Dermatol 2005; 153 (2): 274–81. [DOI] [PubMed] [Google Scholar]
- 17. Diamandis EP, Yousef GM, Soosaipillai AR et al . Human kallikrein 6 (zyme/protease M/neurosin): a new serum biomarker of ovarian carcinoma. Clin Biochem 2000; 33: 79–83. [DOI] [PubMed] [Google Scholar]
- 18. Psyrri A, Kassar M, Yu Z et al . Effect of epidermal growth factor receptor expression level on survival in patients with epithelial ovarian cancer. Clin Cancer Res 2005; 11: 8637–43. [DOI] [PubMed] [Google Scholar]
- 19. Camp RL, Chung GG, Rimm DL. Automated subcellular localization and quantification of protein expression in tissue microarrays. Nat Med 2002; 8 (11): 1323–7. [DOI] [PubMed] [Google Scholar]
- 20. Altman DG, Lausen B, Sauerbrei W et al . Dangers of using ‘optimal’ cutpoints in the evaluation of prognostic factors. J Natl Cancer Inst 1994; 86 (11): 829–35. [DOI] [PubMed] [Google Scholar]
- 21. Camp RL, Dolled‐Filhart M, Rimm DL. X‐tile: a new bio‐informatics tool for biomarker assessment and outcome‐based cut‐point optimization. Clin Cancer Res 2004; 10 (21): 7252–9. [DOI] [PubMed] [Google Scholar]
- 22. Yu Z, Weinberger PM, Provost E et al . beta‐Catenin functions mainly as an adhesion molecule in patients with squamous cell cancer of the head and neck. Clin Cancer Res 2005; 11 (7): 2471–7. [DOI] [PubMed] [Google Scholar]
- 23. Yousef GM, Luo LY, Scherer SW et al . Molecular characterization of zyme/protease M/neurosin (PRSS9), a hormonally regulated kallikrein‐like serine protease. Genomics 1999; 62 (2): 251–9. [DOI] [PubMed] [Google Scholar]
- 24. Prezas P, Arlt MJ, Viktorov P et al . Overexpression of the human tissue kallikrein genes KLK4, 5, 6, and 7 increases the malignant phenotype of ovarian cancer cells. Biol Chem 2006; 387: 807–11. [DOI] [PubMed] [Google Scholar]
- 25. Diamandis EP, Scorilas A, Fracchioli S et al . Kallikrein 6 (KLK6): a new potential serum biomarker for diagnosis and prognosis of ovarian carcinoma. J Clin Oncol 2003; 21 (6): 1035–43. [DOI] [PubMed] [Google Scholar]