

Abstract
STK15 (Aurora A/BTAK) is an oncogenic serine/threonine kinase that plays a role in centrosome separation and in the formation of the mitotic bipolar spindle. It is highly expressed and constitutively activated in various human tumors including hepatocellular carcinoma (HCC). To investigate its possibility as a molecular target for future therapies directed against hepatocellular carcinoma, we constructed a tissue‐specific RNA interference (RNAi) system mediated by hypoxia‐inducible (HI) enhancer/α‐fetoprotein (AFP) promoter and employed it to downregulate exogenous reporters (LUC and EGFP) and endogenous STK15 gene expression and analyzed the phenotypical changes in HCC cells. Results showed that the expression of exogenous reporters (LUC and EGFP) was specifically downregulated in hepatoma cells but not in non‐hepatoma cells. Moreover, the specific downregulation of STK15 expression in hepatocellular carcinoma cells (HepG2) significantly inhibited in vitro cellular proliferation and in vivo tumorigenicity. Furthermore, we also found that the downregulation of STK15 expression led to cell arrest in the G2/M phase and finally apoptosis induction of HepG2 cells. Thus, the HI enhancer/AFP promoter‐mediated RNAi targeting STK15 may be a potential therapeutic strategy for the treatment of hepatocellular carcinoma with tumor specificity and high efficacy. (Cancer Sci 2008; 99: 2209–2217)
Hepatocellular carcinoma (HCC) is one of the most prevalent tumor types with an extremely poor prognosis and increasing mortality rates in recent years because of its aggressive invasion, resistance to chemotherapy and lack of specific symptoms.( 1 , 2 ) In spite of improvements in diagnosis and clinical treatment methods, HCC still remains an aggressive malignant tumor with high mortality rates causing 662 000 deaths worldwide/year.( 3 ) HCC has been reported to be closely associated with hepatitis B and hepatitis C infections, cirrhosis of any etiology and aflatoxin B1 exposure, but the molecular mechanism for the carcinogenesis of HCC is still poorly understood.( 4 ) Thus, an understanding of the molecular mechanisms involved in HCC formation and progression should be helpful in developing more effective treatments for HCC.
STK15, which encodes a centrosome‐associated kinase, belongs to the Aurora/Ipl1p family of cell cycle‐regulating serine/threonine kinases and is localized at interphase and mitotic centrosomes and at the spindle poles where it regulates proper chromosome segregation and cytokinesis.( 5 , 6 ) It has been found to be overexpressed in many types of human malignancies, such as breast cancer, head and neck squamous cell carcinoma, pancreatic cancer and esophageal carcinoma.( 7 , 8 , 9 , 10 ) Additionally, Jeng et al. showed that STK15 is also highly expressed in HCC and the upregulation of STK15 expression may have important pathogenetic and prognostic significance in HCC.( 11 ) The overexpression of STK15 might lead to a lower level of genetic instability via abnormal centrosome duplication and the generation of aneuploidy, which makes this molecule an attractive target for anticancer therapy.( 12 )
Gene therapy has been a promising but also difficult approach. In recent years, a variety of novel gene therapy modalities for malignant tumors have been explored extensively, such as suicide genes, immunosuppressors, anti‐angiogenic genes, tumor‐suppressor genes and so on.( 13 , 14 , 15 , 16 ) RNA interference (RNAi), as a novel therapeutic agent, has been proposed as a potential treatment approach for cancers. Specific gene silencing can be achieved in a variety of cell systems using chemically synthesized small interfering RNA (siRNA) or DNA vector‐based short hairpin RNA (shRNA).( 17 , 18 ) Most commonly used promoters to drive shRNA expression are Pol III promoters (U6, H1‐RNA and transfer RNA).( 19 , 20 , 21 ) However, the use of these promoters to drive shRNA expression in vivo would silence a given gene in all cell types, and thus may destroy not only tumor cells but also non‐tumor cells. Thus, one possible solution to this problem is to use tumor‐specific promoter in RNAi therapy. Recently, some tumor‐specific promoters (SP‐C) to drive the shRNA system have been employed, such as human telomerase reverse transcriptase (hTERT) promoter, survivin promoter and vascular endothelial growth factor (VEGF) promoter.( 22 , 23 , 24 ) Meanwhile, some tissue‐specific promoters including α‐fetoprotein (AFP) and carcinoembryonic antigen (CEA) promoter have been used as gene therapy tools,( 25 , 26 ) but whether these promoters can be used to specifically and efficiently drive shRNA expression only to the target tumor tissues has not been reported until now.
In the present study, we attempted to develop a tissue‐specific RNAi system directly under the transcriptional control of hypoxia‐inducible (HI) enhancer/AFP promoter and investigate the possibility of this system silencing the expression of exogenous reporter genes (Firefly luciferase [LUC] and enhanced fluorescent protein [EGFP]) in hepatoma cells but not in non‐hepatoma cells. Moreover, we have designed and exogenously delivered a DNA vector‐based shRNA targeted STK15 gene to hepatocellular carcinoma cell (HepG2) and selected stably transfected HepG2‐s cells. Using the stable transfectants, we explored the effects of STK15 downregulation on hepatocellular carcinoma proliferation both in vitro and in vivo. Moreover, we also detected the effects of STK15/shRNA on hepatoma cell apoptosis and analyzed the possible mechanism of apoptosis induction. The final aim of all experimental data is to provide evidences of the potential use of HI enhancer/AFP promoter‐driven RNAi targeting STK15 as adjuvant therapy for the treatment of HCC.
Materials and Methods
Cell lines and cell culture. The AFP‐positive human hepatoma cell line (HepG2), AFP‐negative human hepatoma cell line (SMMC‐7721) and normal human liver cell line (L‐02) were cultured in RPMI‐1640 medium (Invitrogen, Grand Island, NY, USA) supplemented with 10% fetal bovine serum, 2 mM L‐glutamine. Hypoxia (1% O2) was induced by placing cells in a 1% O2‐5% CO2 and 94% N2 incubator for 24 h at 37°C.
Plasmids construction. To construct a HI enhancer/AFP promoter‐driven shRNA vector (pSil‐HI/AFPp‐shRNA), the HI/AFP promoter gene (GenBank no. M16110) was amplified from our previously obtained plasmid (pGL3‐HI enhancer/AFP promoter) by polymerase chain reaction (PCR). Then, the PCR product was inserted into the EcoRI and BamHI site of pSilencer2.1‐U6 neo vector (Ambion, Austin, TX, USA) to replace the U6 promoter. shRNA targeting LUC, EGFP, STK15 gene (GenBank no. NM_003600) and a non‐specific control shRNA (NS) were designed and chemically synthesized (BioAsia Bioengineering, Shanghai, China) and then annealed to form double‐stranded cDNA fragments that were inserted between the BamHI and HindIII sites of linearized pSil‐HI/AFPp‐shRNA downstream of HI/AFP promoter according to the manufacturer's instructions (Fig. 1A). The recombinant plasmids were named pSil‐HI/AFPp‐LUC/shRNA, pSil‐HI/AFPp‐EGFP/shRNA, pSil‐HI/AFPp‐STK15/shRNA and pSil‐HI/AFPp‐Control/shRNA, respectively. To facilitate the analysis of RNAi efficacy, the luciferase gene (or EGFP gene) was amplified from pGL3 vector (or pEGFP‐C1 vector) and was separately inserted into pSil‐HI/AFPp‐LUC/shRNA (or pSil‐HI/AFPp‐EGFP/shRNA) and pSil‐HI/AFPp‐Control/shRNA vector between NruI and BclI retriction sites to replace the neomycin gene (Fig. 1B). The recombinant vectors were confirmed by the digestion analysis of restriction endonuclease and all inserted sequences were verified by DNA sequencing.
Figure 1.
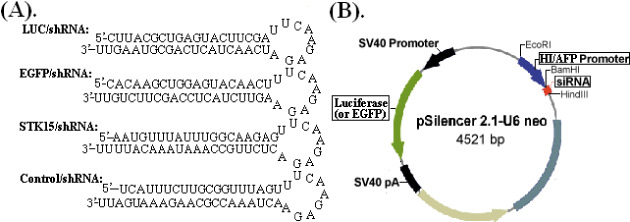
(A) Predicted structure of small hairpin RNA and (B) schematic diagram of the recombinant pSilencer2.1‐U6neo vector. The U6 promoter was replaced by the hypoxia‐inducible (HI) enhancer/α‐fetoprotein (AFP) promoter and shRNA encoding template was inserted between HindIII and BamHI enzyme sites downstream of HI/AFP promoter. EGFP, enhanced green fluorescent protein; siRNA, small interfering RNA.
Transfection of plasmids. Two human HCC cell lines – HepG2, SMMC‐7721 and normal human liver cell line (L‐02) – were grown in RPMI‐1640 supplemented with 1% glutamine, 100 mg/mL streptomycin, 100 U/mL penicillin and 10% fetal bovine serum in a humidified atmosphere containing 5% CO2 at 37°C. The cell transfection was performed in opti‐MEM with the transfection reagent LipofectAMINE PLUS (Invitrogen, Carlsbad, CA, USA) following the manufacturer's protocols.
Selection of stable transfectants. According to the above methods, HepG2 cells were transfected with different vectors (pSil‐HI/AFPp‐STK15/shRNA, pSil‐HI/AFPp‐Control/shRNA and empty vector pSil‐U6 neo), respectively. After 6 h of transfection, the cells were incubated with the fresh medium under either the normoxic or hypoxic (1% O2) condition for a further 48 h. Then, the cells were selected for neomycin resistance in the medium containing 600 µg/mL G418 for 2 weeks. Individual colonies were isolated and later maintained with 100 µg/mL G418. HepG2 cell line stably transfected with pSil‐HI/AFPp‐STK15/shRNA vector was named HepG2‐s. HepG2 cell lines stably transfected with pSil‐HI/AFPp‐Control/shRNA or pSil‐U6 neo vector were named HepG2‐NS or HepG2‐U6neo, respectively.
Luciferase reporter gene assay. HepG2, SMMC‐7721 and L‐02 cell lines were transfected in six‐well culture plates with 4.0 µg/well Firefly luciferase‐expressing vectors (pSil‐HI/AFPp‐LUC/shRNA‐sv40p‐luciferase and pSil‐HI/AFPp‐Control/shRNA‐sv40p‐luciferase), and Renilla luciferase‐expressing vector (pRL‐sv40) was used as transfection controls. After 6 h of transfection, the cells were incubated with the fresh medium under either the normoxic or hypoxic (1% O2) condition for a further 48 h. The luciferase activity was measured with a Dual‐Luciferase Assay Kit (Promega, Madison, WI, USA). The relative luciferase activity was calculated as the ratio of Firefly luciferase activity to Renilla luciferase activity.
Enhanced fluorescent protein reporter gene assay. HepG2, SMMC‐7721 and L‐02 cell lines were transfected in six‐well culture plates with 4.0 µg/well pSil‐HI/AFPp‐EGFP/shRNA‐sv40pEGFP and pSil‐HI/AFPp‐Control/shRNA‐sv40p‐EGFP, respectively. After 6 h of transfection, the cells were incubated with the fresh medium under either the normoxic or hypoxic (1% O2) condition for a further 48 h. Then, the cells were photographed by using a fluorescence microscope and then harvested. Half of the cells were used to extract total RNA for reverse transcription (RT)‐PCR, the rest were used to determine the levels of EGFP fluorescence by fluorescence‐activated cell sorting (FACSCalibur, BD, San Jose, CA, USA).
RT‐PCR analysis. Total RNA was isolated from the cultured cells by Trizol Reagent (Gibco‐BRL, Grand Island, NY, USA) according to the manufacturer's instructions. RNA of 2 µL (1 mg/mL) was used to synthesize cDNA and the cDNA was added to a final volume of 20 µL, 0.5 µL of each primer. PCR was performed with standard methods. The primers used for LUC, EGFP and STK15 amplification were as follows: EGFP, 5′‐TGCCACCTACGGCAAGCTGA‐3′ forward and 5′‐TCGATGTTGTGGCGGATCTT‐3′ reverse; and STK15 5′‐TGGCCAGGCTCAGCGGG‐3′ forward and 5′‐GTTCTCTGCTCATCAA‐3′ reverse. As the housekeeping gene, the primers used for β‐actin amplification were as follows: 5′‐AGCAACCGGGAGCTGGTGG‐3′ forward and 5′‐CATTTCCGACTGAAGAGTG‐3′ reverse. Thirty‐five cycles were used for both pairs of primers, and each cycle was performed at 94°C for 30 s, 60°C for 30 s and 72°C for 90 s. The PCR products were separated on 1.5% agarose gel and the density of each mRNA was detected and normalized to that of β‐actin mRNA.
Western blot analysis. The untransfected or stably transfected HepG2 cells were harvested, washed twice with cold phosphate‐buffered saline (PBS) and lyzed in buffer (150 mM NaCl, 50 mM Tris–HCl, 2 mM ethylenediaminetetraacetic acid, 1% NP‐40, pH 7.4). Equal amounts of protein (30 mg/lane) from supernatants or cells were electrophoresed under non‐reducing conditions on 10% acrylamide gels. After sodium dodecylsulfate polyacrylamide gel electrophoresis, proteins were transferred to a polyvinylidene difluoride membrane (Bio‐Rad, Richmond, CA, USA). To block non‐specific binding, the membrane was incubated for 2 h in Tris‐buffered saline with 0.1% Tween‐20 [T‐TBS] containing 5% non‐fat skim milk for 2 h. Then, the membrane was incubated overnight at 4°C with anti‐STK15 antibody (1:400; Alpha Diagnostic International, San Antonio, TX, USA) and antisurvivin, anti‐XIAP, anti‐Livin, anticIAP1, antic‐IAP2, anti‐Bcl‐2, anti‐Bcl‐xl, anti‐Bax, anti‐Bad, anti‐PUMA and anti‐actin (Santa Cruz Biotechnology, Santa Cruz, CA, USA) in PBS containing 0.1% Tween‐20 followed by incubation with horseradish peroxidase‐conjugated antimouse IgG (Sigma, CA, USA) for 1.5 h. Then the membrane was washed several times with PBS containing 0.2% Tween‐20. As an internal control, the same membrane was hybridized to anti‐actin antibody (1:500; Alpha Diagnostic International) as a control for loading an equal amount of protein among each sample followed by incubation with horseradish peroxidase‐conjugated antimouse immunoglobulin (Ig)M (Sigma) as above. For loading control, the membranes were stripped and probed with monoclonal antibodies for β‐actin, as per standard protocol.
Cell proliferation assay. Cell growth was assessed by 3‐(4,5‐dimethyl‐2‐thiazolyl)‐2, 5‐diphenyl‐2H‐tetrazolium bromide (MTT) assay. A total of 5.0 × 10³ untransfected or stably transfected cells (HepG2, HepG2‐U6neo, HepG2‐NS or HepG2‐s) in 100 µL of the medium were plated in 96‐well plates. The cells were incubated under hypoxia (1% O2) for 6 h every day. Every 24 h up to 7 days, three wells were selected from each group of cells for MTT (50 mg/well) assay. Then, the cells were incubated at 37°C for 4 h, the reaction was stopped by the addition of 150 mL/well of dimethylsulfoxide. After a 10‐min incubation, absorbance was measured at 490 nm using a microplate reader. The protracted cell growth curve and the results of the inhibitory rates of cell growth were applied to absorbance (A) at 490 nm as follows: inhibitory rate = (1‐HepG2‐s A/HepG2 A) × 100%.
Colony formation assay. Approximately a total of 7.0 × 10² untransfected HepG2 or stably transfected cells (HepG2‐U6neo, HepG2‐NS and HepG2‐s) were plated in 10‐cm culture dishes, respectively. The cells were incubated under hypoxia (1% O2) for 24 h every 2 days. After 18 days, cells were fixed with methanol and stained with 0.1% crystal violet. Visible colonies were manually counted.
Cell cycle analysis. Approximately 1.0 × 10⁵ cells of each group were seeded into a six‐well culture plate. Then, cells were harvested after incubation for 48 h, fixed in 70% alcohol. The fixed cells stained with propidium iodide (PI). The analysis of cell cycle distribution was performed by FAC‐Scan Flow Cytometer (Becton Dickinson, San Jose, CA, USA) and analyzed by CellQuest software package (BD Bioscience, San Jose, CA). Each experiment was performed in triplicate.
Terminal deoxynucleotidyl transferase‐mediated deoxyuridine 5‐triphosphate nick end labeling assay. The untransfected or stably transfected HepG2 cells were washed, collected and dropped on slides using cytospin. Then, the cells were incubated with the fresh medium under either the normoxic or hypoxic (1% O2) condition for a further 24 h. Apoptotic of cells were detected by terminal deoxynucleotidyl transferase (TdT)‐mediated deoxyuridine 5‐triphosphate (dUTP)‐biotin nick end labeling (TUNEL) stain, using an In Situ Cell Death Detection Kit, Fluorescein (Keygen Biotech, Nanjing, China) following the manufacturer's specifications. In brief, fixed cells were permeabilized using a mixture containing 0.1% sodium citrate and 0.1% TritonX100 and incubated with TUNEL reaction mixture containing terminal deoxynucleotidyl transferase and fluorescein‐dUTP at 37°C for 60 min. While at least 500 cells were counted by light microscopy, apoptotic cells were identified and all experiments were performed in triplicate. The negative control was set up with no TdT enzyme added in the staining process.
Analysis of caspase‐3 activity. The activity of caspase‐3 was determined using the caspase‐3 (CPP32) protease assay kit (PharMingen, San Diego, CA, USA) according to the manufacturer's instructions. In brief, approximately 2.0 × 10⁶ cells were lyzed and resuspended in 100 µL of reaction buffer containing a fluorogenic caspase‐3 (CPP32) substrate, Ac‐DEVD‐AMC. Reactions were incubated at 37°C for 2 h and samples were assayed at excitation wavelength of 360 nm and emission wavelength of 460 nm, in the FL600 Microplate Fluorescence Reader (Bio‐Tek Instruments, Winooski, VT, USA). Western blot analysis was also used to detect the variation of caspase‐3 in the above cells.
In vivo tumorigenicity assay. Animal experiments in this study were done in compliance with the Fourth Military Medical University of Medicine institutional guidelines. Five‐week‐old female nude mice were obtained from Animal Center of Fourth Military Medicine University (Xi’an, China) and housed in laminar flow cabinets under specific pathogen‐free conditions. The untransfected or stably transfected cells (HepG2, HepG2‐U6 neo, HepG2‐NS and HepG2‐s) were injected into the flanks of mice in a total volume of 100 µL (1.0 × 10⁷ cells). The tumor‐bearing mice were killed 35 days after inoculation and tumor growth from days 0–35 after inoculation was monitored and tumor diameters were measured with a caliper. Tumor volume was calculated according to the formula: V = 0.4 × largest diameter × smallest diameter.( 2 ) All mice were killed and s.c tumors were resected and fixed in 10% PBS. We measured the primary tumors and performed western blot analysis of STK15 protein expression. Survival tests were performed using groups of mice (10/group) treated as above and monitored daily until all the mice died.
Statistical analysis. All experiments were performed in triplicate. All statistical analyses were performed by using SPSS ver. 11.0 (SPSS Software, Chicago, IL, USA). Comparisons among all groups were performed with the one‐way anova test and Student's t‐test by Newman–Keuls method. Differences were considered significant at P < 0.05.
Results
Construction of hypoxia‐inducible enhancer/AFP‐driven shRNA expressing vectors from pSilencer2.1‐U6 neo. Four different recombinant vectors were successfully constructed, which were named pSil‐HI/AFPp‐LUC/shRNA, pSil‐HI/AFPp‐EGFP/shRNA, pSil‐HI/AFPp‐STK15/shRNA and pSil‐HI/AFPp‐Control/shRNA, respectively. All vectors were confirmed to be correct by DNA sequencing (data not shown).
Effect of shRNA on exogenous reporter gene (LUC or EGFP) expression. First, we detected the effect of HI/AFP promoter‐driven LUC/shRNA on the Firefly luciferase gene expression. To facilitate the analysis of HI/AFP promoter‐driven shRNA efficacy, we constructed the pSil‐HI/AFPp‐LUC/shRNA‐sv40p‐luciferase (pSil‐shLUC, Fig. 2A) and pSil‐HI/AFPp‐Control/shRNA‐sv40p‐luciferase (pSil‐LUC) vectors. Cells were transfected with the Firefly luciferase‐expressing vectors (pSil‐shLUC or pSil‐LUC) and the Renilla luciferase‐expressing vector pRL‐sv40. Forty‐eight hours later after transfection, the luciferase activity was determined by a Dual‐Luciferase Assay Kit. The relative luciferase activity was defined as the ratio of Firefly luciferase activity to Renilla luciferase activity. The mean pSil‐shLUC/pSil‐LUC ratios were 0.237 ± 0.047 and 0.302 ± 0.062 in HepG2 and SMMC‐7721 hepatoma cell lines, respectively (P < 0.05, Fig. 2B). Meanwhile, the mean pSil‐shLUC/pSil‐LUC ratio was 0.912 ± 0.0563 in L‐02 cell line.
Figure 2.
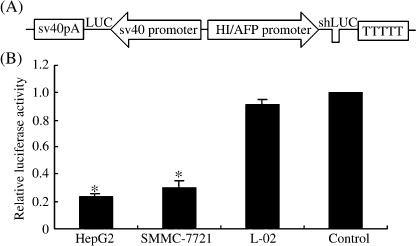
Inhibiting luciferase expression by LUC/short hairpin RNA. (A) Schematic diagram of pSil‐HI/AFPp‐LUC/shRNA‐sv40p‐luciferase (pSil‐shLUC) recombinant vector. (B) LUC/shRNA efficacy in two hepatoma cell lines (HepG2 and SMMC‐7721) and normal liver cell line (L‐02) transfected with pSil‐shLUC and pSil‐LUC, respectively, and the Renilla luciferase‐expressing vector pRL‐sv40 served as a transfection control. The relative luciferase activity was defined as the ratio of pSil‐LUC activity to pRL‐sv40 activity. Each group contained six wells and experiments were repeated in triplicate, *P < 0.05. AFP, α‐fetoprotein; HI, hypoxia‐inducible.
Next, we explored the inhibitory effects of HI/AFP promoter‐driven EGFP/shRNA on the expression of the EGFP gene. Then, we constructed pSil‐HI/AFPp‐EGFP/shRNA‐sv40p‐EGFP (pSil‐shEGFP, Fig. 3A) and pSil‐HI/AFPp‐Control/shRNA‐sv40p‐EGFP (pSil‐EGFP) vectors. As shown in Fig. 3(B), the level of EGFP mRNA expression was determined by RT‐PCR. We observed that compared with controls, the levels of EGFP mRNA expression were decreased in HepG2 and SMMC‐7721 cells transfected with pSil‐shEGFP (P < 0.05), but there was no significant difference in L‐02 cells (P > 0.05). The inhibitory effects of EGFP/shRNA on EGFP protein expression were evaluated by fluorescence microscopy and FACS. The relative level of EGFP fluorescence showed no significant change in normal L‐02 cells (P > 0.05), but obviously reduced in HepG2 and SMMC‐7721 cells transfected with pSil‐shEGFP as determined by direct visualization under a fluorescence microscope (Fig. 3C) and FACS analysis (P < 0.05; Fig. 3D).
Figure 3.
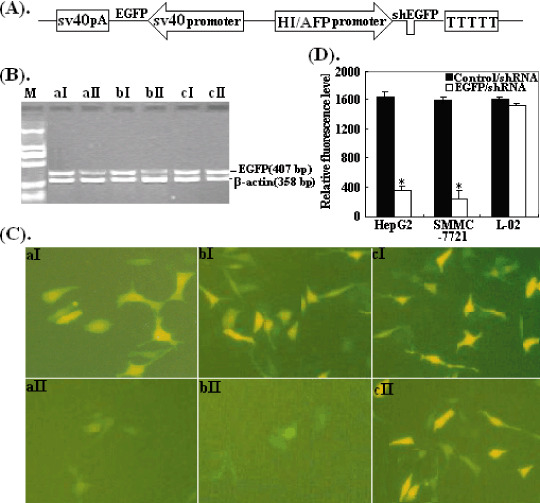
Inhibiting enhanced green fluorescent protein (EGFP) expression by EGFP/short hairpin RNA. (A) Schematic diagram of pSil‐HI/AFPp‐EGFP/shRNA‐sv40p‐EGFP (pSil‐shEGFP) recombinant vector. (B) Reverse transcription polymerase chain reaction analysis of EGFP mRNA expression. HepG2, SMMC‐7721 and L‐02 cells were transfected with pSil‐shEGFP and pSEGFP, respectively. Lanes: a, HepG2; b, SMMC‐7721; c, L‐02; I, cells transfected with pSil‐EGFP; II, cells transfected with pSil‐shEGFP. (C) The levels of EGFP expression detected by fluorescence microscopy (original magnification ×200). Cells were photographed 48 h later after transfection. The cells and cell transfection panel are the same as (B). (D) The relative EGFP fluorescence levels detected by fluorescent‐activated cell sorting, *P < 0.05.
Inhibitory effect of the STK15 mRNA expression by RT‐PCR analysis. To verify whether the STK15 gene was silencing by pSil‐HI/AFPp‐shRNA construct expressing shRNA, we determined the levels of STK15 mRNA expression in cells (HepG2, HepG2‐U6neo, HepG2‐NS and HepG2‐s) by real‐time RT‐PCR. Using specific primers for STK15, and β‐actin in cells (HepG2, HepG2‐U6neo and HepG2‐NS), there was no reduction in the levels of STK15 mRNA expression (P > 0.05); whereas the levels of STK15 mRNA expression in HepG2‐s cells were significantly decreased by 46.7% (P < 0.05; Fig. 4A).
Figure 4.
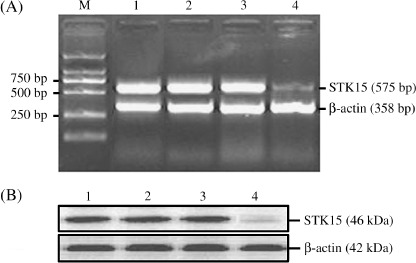
Downregulation of STK15 gene expression in hepatocellular carcinoma cells by short hairpin RNA. (A) The levels of STK15 mRNA expression detected by semiquantitative reverse transcription polymerase chain reaction (RT‐PCR). The products of PCR were separated on a 1.5% agarose gel. Densitometric analysis was performed using the Labworks Image Acquisition and the inhibitory rate of STK15 mRNA expression in HepG2‐s was 46.7%. (B) The levels of STK15 protein expression detected by western blotting. Membranes were probed with antibodies for targeted protein, and expression levels were normalized for loading by probing for β‐actin. Densitometric analysis was performed using the Labworks Image Acquisition and the inhibitory rate of STK15 protein expression in HepG2‐s was 54.3%. Lanes: M, DL2000 marker; 1, HepG2; 2, HepG2‐U6neo; 3, HepG2‐NS; 4, HepG2‐s.
Inhibitory effect of the expression of STK15 protein by western blot analysis. The levels of STK15 protein expression were determined in cell lysates by western blotting, and β‐actin protein levels were also determined in the same blot to serve as loading control. Compared with that in the untranfected HepG2 cells, the levels of STK15 protein expression in the HepG2 cells was significantly decreased by 54.3% (P < 0.05), but the HepG2‐CMVneo and HepG2‐NS cells showed no obvious changes (P > 0.05; Fig. 4B).
Inhibition of in vitro cell proliferation by STK15/shRNA. To evaluate the phenotypical changes, we first investigated STK15‐shRNA on the proliferation of HepG2 cells in vitro. Cellular proliferation was monitored by MTT assay daily for 7 days. The cell growth curve indicated that the proliferation of HepG2‐s cell was significantly inhibited in a time‐dependent manner and the highest inhibitory rate was 40.2 ± 2.5% on day 7 (P < 0.01) but there were no obvious differences among HepG2, HepG2‐U6neo and HepG2‐NS cells (P > 0.05; Fig. 5A). In colony formation assay, as shown in Fig. 5(B), the number of stable colonies developed from HepG2‐s cells was approximately 112 (P < 0.05), which was significantly reduced compared with that of colonies developed from untransfected HepG2, HepG2‐U6neo and HepG2‐NS cells (492, 464, 475). These data showed that STK15‐shRNA could significantly inhibit HCC cell proliferation in vitro.
Figure 5.
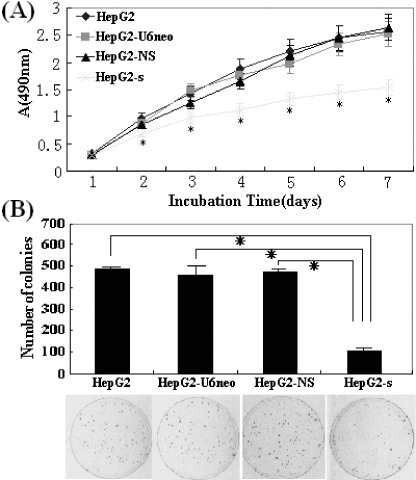
Cell proliferation determined by 3‐(4,5‐dimethyl‐2‐thiazolyl)‐2, 5‐diphenyl‐2H‐tetrazolium bromide (MTT) and colony formation assays. (A) The protracted cell growth curve and the results of the inhibitory rates of cell growth were applied to absorbance at 490 nm. The proliferation of HepG2‐s cells was significantly suppressed in a time‐dependent manner, and the highest inhibition rate was 40.2 ± 2.5% (*P < 0.01) on day 7. (B) The HepG2‐s cells showed much less colonies than HepG2‐CMVneo, HepG2‐NS and untransfected HepG2 cells. These experiments were repeated three times, *P < 0.05.
Effect of STK15/shRNA on the cell cycle of HepG2 cells. To explore the mechanisms underlying the shRNA‐mediated growth inhibition, we performed cell cycle analysis to evaluate the effect of STK15/shRNA on the cell cycle of HepG2 cells by flow cytometry and each assay was performed thrice. The mean values of triplicate experiments are shown in Fig. 6. Compared with that in HepG2, HepG2‐U6neo and HepG2‐NS cells, there were great changes in HepG2‐s cells. The percentage of G2/M phase cells was significantly increased (24.4 ± 1.2%; P < 0.05), and no significant change in S‐phase cells, while the percentage of G0/G1 phase cells was significantly reduced (56.7 ± 2.8%; P < 0.05) and an apoptosis peak (AP) could be seen before the G1 phase. Obviously, cell cycle analysis showed an obvious G2/M arrest pattern in STK15‐downregulated HepG2 cells, which also suggested that the growth inhibition by STK15/shRNA might be due to perturbed cell cycle.
Figure 6.
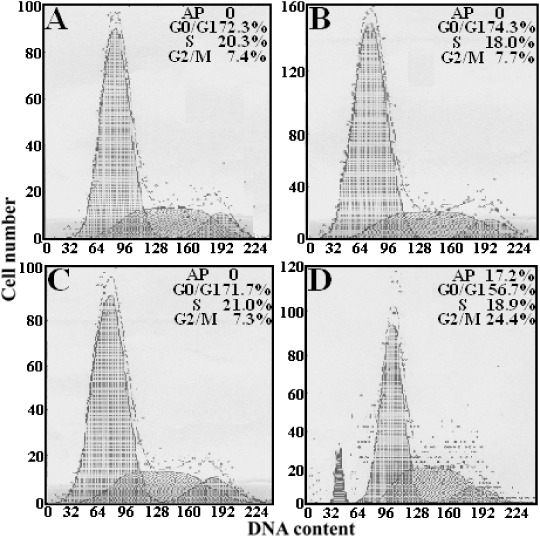
HepG2‐s cells were arrested in the G2/M phase (24.4 ± 1.2%; P < 0.05), declined notably in the G0/G1 phase (56.7 ± 2.8%; P < 0.05), and an apoptosis peak could be observed before the G1 phase. (A) HepG2; (B) HepG2‐U6neo; (C) HepG2‐NS; (D) HepG2‐s.
Induction of apoptosis by STK15/shRNA. To determine whether the growth inhibition by STK15‐shRNA was induced by cell apoptosis, we performed TUNEL assay to measure the levels of apoptosis in HepG2 cells. As shown in Fig. 7, there were no significant differences in the percentage of apoptotic cells between HepG2, HepG2‐U6neo and HepG2‐NS cells (P > 0.05). However, the percentage of apoptotic cells in HepG2‐s cells (20.3 ± 0.8%) was much higher than that of HepG2 cells (P < 0.01), HepG2‐U6neo cells (P < 0.01) and HepG2‐NS cells (P < 0.01). Thus, RNAi targeting STK15 was confirmed significantly to induce apoptosis of HepG2 cells.
Figure 7.
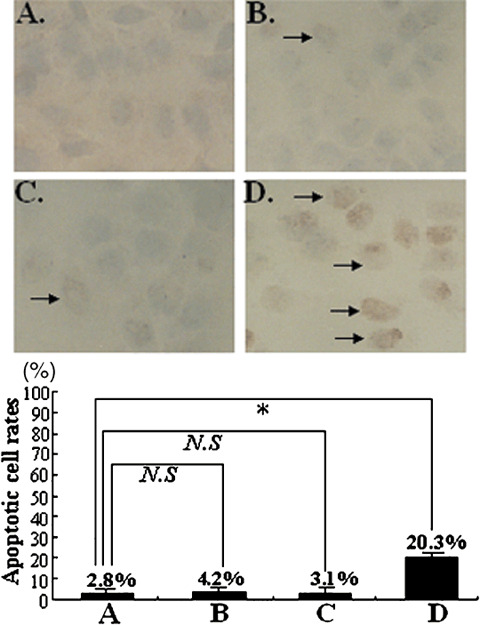
Detection of apoptosis by TUNEL assay. The strongest apoptotic signals appeared in HepG2‐s cells and the percentage of apoptotic cells was 20.3 ± 0.8%. It can be found that the apoptosis rate of STK15‐downregulated HepG2 cells was significantly higher than the control. Results represent the mean ± standard error. *P < 0.05, N.S. not significantly different, when compared to untransfected cells.
Analysis of the possible activation of apoptotic pathways. To explore the possible mechanism of STK15/shRNA‐induced apoptosis, the involvement of caspase‐3 was first detected. Western blot analysis was performed to detect the expression of cleaved caspase‐3 and the activity of caspase‐3 in untransfected or stably transfected HepG2 cells was also determined. The activity of caspase‐3 was significantly enhanced by approximately 186% in HepG2‐s cells (Fig. 8A) and the activation of caspase‐3 was observed (Fig. 8B). This indicated that the cell death of HepG2 cells induced by STK15/shRNA might be a caspase‐dependent process. Next, we performed western blotting to determine if the expression of the anti‐apoptotic proteins (survivin, XIAP, Livin, c‐IAP1, c‐IAP2, Bcl‐2 and Bcl‐xl) and the pro‐apoptotic proteins (Bax, Bad and PUMA) showed changes in HepG2‐s cells. Results showed that the inhibitors of the apoptosis protein (IAP) family showed no changes but the Bcl‐2 protein family showed significant changes in HepG2‐s cells as compared with controls. The levels of Bcl‐2 and Bcl‐xl protein expression were reduced, but the levels of Bax, Bad and PUMA protein expression were increased in HepG2‐s cells (Fig. 8C). Thus, we concluded that the Bcl‐2 family proteins were involved in the apoptosis induced by STK15/shRNA, but the exact mechanism needed to be further elucidated.
Figure 8.
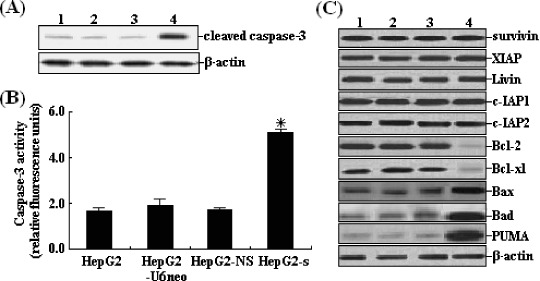
Effects of STK15/short hairpin RNA on the activation of apoptotic pathways. (A) Western blotting of untransfected and stably transfected HepG2 cells. Total protein (60 mg) from cell lysates was loaded per lane and blotted with anticleaved caspase‐3 antibodies. Equal loading was confirmed by showing equal β‐actin levels. (B) Caspase‐3 activity of HepG2‐s cells increased by approximately 186%, *P < 0.05. (C) Western blotting of untransfected and stably transfected HepG2 cells. Total protein (60 mg) from cell lysates was loaded per lane and blotted with antibodies against surviving, XIAP, Livin, c‐IAP1, c‐IAP2, Bcl‐2, Bcl‐xl, Bax, Bad and PUMA. Equal loading was confirmed by showing equal β‐actin levels. Lanes: 1, HepG2; 2, HepG2‐U6neo; 3, HepG2‐NS; 4, HepG2‐s.
Inhibition of in vivo proliferation of HepG2 cells by STK15/shRNA. To explore the effect of STK15/shRNA on the tumor growth in vivo, the aliquot of 1.0 × 10⁷ cells (HepG2, HepG2‐U6neo, HepG2‐NS or HepG2‐s) was s.c. injected into eight athymic nude mice, respectively. In order to confirm STK15 downregulation by shRNA treatment, tumor homogenates were subjected to western blot analysis of STK15 protein expression. The average levels of STK15 protein expression in tumors developed from HepG2‐s cells was 46.7 ± 3.5% lower than those in tumors developed from the control cells (Fig. 9A). At 35 days after inoculation, we monitored tumor volume (TV). The average TV of the xenografts formed from HepG2‐s cells at 35 days was significantly smaller than that of the xenografts formed from the control cells (P < 0.05; Fig. 9B,C). The survival time of the mice was shown in Fig. 9(D). STK15‐shRNA significantly prolonged the lifespan of mice bearing HepG2 tumor cells (P = 0.00265). All these data suggested that RNAi‐mediated downregulation of STK15 expression exerted a strong growth‐inhibitory effect on HCC cells in vivo.
Figure 9.
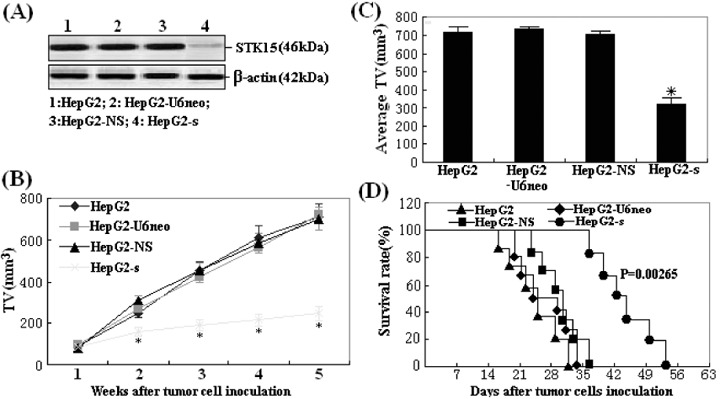
Effect of STK15‐short hairpin RNA on tumorigenicity. (A) Protein samples extracted from HepG2 tumors (n = 8) were analyzed using western blot analysis of STK15 protein expression. β‐Actin was included as a loading control. Lanes: 1, HepG2; 2, HepG2‐U6neo; 3, HepG2‐NS; 4, HepG2‐s. (B) Tumor proliferation curve showed a significant growth tendency in mice injected with HepG2, HepG2‐U6neo, HepG2‐NS and HepG2‐s cells, while the tumor proliferation in mice injected with HepG2‐s cells was significantly inhibited. (C) Average tumor size at day 35 after the inoculation of stable transfectants, *P < 0.05. (D) Survival analysis of mice inoculated with above four kinds of HepG2 cells. Survival curves were made by the Kaplan–Meier's method, and statistical differences were evaluated by using the log–rank test. The differences between HepG2‐s group and other three control groups were statistically significant (P = 0.00265).
Discussion
Hepatocellular carcinoma is cancer that arises from hepatocytes, the major cell type of the liver. It is either the number one or number two cause of cancer death around the world, especially prevalent in parts of Asia and Africa.( 27 , 28 ) People with HCC are usually treated with surgery, radiation or adjuvant chemotherapy. Hepatocellular carcinoma is curable by surgery only if the tumor is small. For large tumors or cancer that has spread beyond the liver, chemotherapy, ligating or embolization of the hepatic artery, alcohol injection into the tumor or radiation may relieve symptoms, but these treatments cannot produce a curative effect for their limitations.( 29 , 30 ) Therefore, it is important to exploit a novel strategy to effectively suppress tumor proliferation and avoid the side‐effects of chemotherapeutic agents.
Targeted gene therapies have been considered to be a promising strategy to realize this goal. As an innovative new technology tool, RNA interference has developed rapidly in recent years, which has been applied in downregulating the expression of related genes in order to achieve gene therapy of leukemia, AIDS and virus hepatitis.( 31 , 32 , 33 ) Although RNAi showed many virtues, there are still some difficulties in the clinical use of siRNA. For example, the targeted gene silence needs to be solved. Most commonly used promoters to drive siRNA expression are Pol III promoters, which direct high levels of siRNA expression but do not possess cell or tissue specificity.( 34 ) Thus, the use of these promoters to drive shRNA expression in vivo would silence a given gene in all cell types, and thus produce an undesirable effect in non‐target cells. Utilization of a tissue‐specific promoter that is predominantly active in tumor cells but not in normal cells would be an ideal strategy for restricting therapeutic gene expression in tumor tissues and decreasing the probability of off‐target silencing and cellular toxicity. Many tumors often re‐express fetal or embryonic genes, and AFP gene expression is reactivated in HCC cells.( 35 ) Because elevated levels of AFP have been observed in approximately 70% of HCC, using an AFP transcriptional sequence to achieve HCC‐specific gene expression is an ideal way. Some researches have shown that an AFP promoter employed to drive therapeutic genes could achieve a HCC‐targeted gene therapeutic effect.( 36 , 37 ) However, there have been few reports about using AFP promoter to drive shRNA in the antitumor study.
Traditionally, AFP promoter‐mediated gene therapy only realizes the targeted gene expression in high‐AFP‐producing hepatoma cells. Moreover, the transcriptional activity of this promoter is usually so weak that the therapeutic results of AFP promoter‐driven gene therapy are unsatisfactory. Thus, hepatoma‐specific enhancement of AFP promoter activity may be needed to induce enough cytotoxicity in low‐AFP‐producing hepatoma cells. Tumor cells grow faster than the endothelial cells that consist of the blood vessels, which produce growth settings with lower oxygen tension and nutrient deprivation. It has been proved that hypoxia is a powerful modulator of gene expression and an important mediator of these responses is the interaction of a transcriptional complex termed HIF‐1 with its cognate DNA recognition site, HRE.( 38 ) Thus, it is thought that VEGF hypoxia‐inducible enhancer linked to the AFP promoter could specifically result in enhancement of transgene expression in hypoxic hepatoma cells in vitro and in solid tumor xenografts consisting of low‐AFP‐producing hepatoma cells, which has been proved by Ido et al.( 39 , 40 ) In the present study, to investigate the possibility of the VEGF‐HI/AFP promoter used to drive shRNA expression vector and silence gene expression in hepatoma cells but not non‐hepatoma cells, we constructed the HI/AFP promoter‐driven shRNA vector in the form of a small hairpin structure. Results showed that HI/AFPp‐driven shRNA significantly downregulate the expression of the exogenous reporter genes by 60–80% in high‐AFP‐producing hepatoma cell line (HepG2) and low‐AFP‐producing hepatoma cell line (SMMC‐7721) but not in normal liver cell line (L‐02) which was normal human liver cells without endogenous AFP expression. This indicated that HI/AFP promoter‐driven shRNA can downregulate targeted gene expression with hepatoma specificity and high efficacy.
Next, we investigated whether HI/AFP promoter‐driven shRNA could exert effects on the endogenous gene STK15 expression. STK15 (also named Aurora‐A/BTAK/ARK1) is a centrosome‐associated protein, which belongs to serine/threonine kinase family and has been implicated in regulating centrosome function, spindle assembly, spindle maintenance, chromosome segregation and cytokinesis.( 41 ) The overexpression of STK15 might induce chromosomal aberration and genomic instability, which leads to malignant transformation.( 42 ) Moreover, overexpression of the STK15 gene has been correlated with cancer susceptibility and poor prognosis in several human malignant tumors. STK15 has been found to be upregulated in HCC cells and tissues, and plays an important role in the development and progression of HCC.( 11 ) Thus, the knockdown of STK15 has been demonstrated to be an effective molecular target therapy in the treatment of a variety of cancers, such as pancreatic cancer, gastric cancer and esophageal squamous cell carcinoma (ESCC).( 43 , 44 , 45 ) Inhibition of STK15 expression by small‐molecule inhibitors, antisense oligodeoxynucleotides (AS‐ODN) or siRNA can impair tumor cell growth, induce apoptosis, sensitize cells to apoptosis‐inducing agents, and increase cell sensitivity to chemotherapy and radiotherapy.( 46 , 47 , 48 , 49 ) In the present study, we constructed recombinant pSil‐HI/AFPp‐STK15/shRNA and successfully selected HepG2 cells stably expressing STK15/shRNA. We observed that the levels of STK15 mRNA and protein expression in the HCC cell (HepG2) was significantly downregulated by specific‐shRNA based on DNA vector. Results showed that the downregulation of STK15 expression led to HCC cell growth suppression both in vitro and in vivo. Moreover, we also observed that STK15 downregulation could induce cell arrest in the G2/M phase of cell cycle and lead to final apoptosis induction of HepG2 cells. To elucidate the possibly apoptotic pathways induced by STK15 downregulation, the activity of caspase‐3 and the upstream pathway leading to caspase‐3 activation was detected. We found that the activity of caspase‐3 was significantly enhanced in HepG2‐s cells than that in other control cells. Moreover, STK15/shRNA treatment led to increased levels of pro‐apoptotic proteins (Bax, Bad and PUMA) and a decrease in anti‐apoptotic proteins (Bcl‐2 and Bcl‐xl), but the levels of the IAP (survivin, XIAP, Livin, c‐IAP1 and c‐IAP2) showed no obvious changes. These results indicate that Bcl‐2 family proteins, members of the intrinsic apoptotic pathway, are involved in the apoptosis induced by the downregulation of STK15. All these results have perhaps laid a foundation for further tumor therapeutic investigation.
Taken together, the hypoxia‐inducible enhancer/α‐fetoprotein promoter‐driven RNA interference system could effectively and specifically silence gene expression in high‐AFP‐producing or low‐AFP‐producing hepatoma cells but not in non‐hepatoma cells. Our study also indicated that knockdown of STK15 via this tissue‐specific system could suppress in vitro proliferation, lead to cell arrest in G2/M phase, induce apoptosis and reduce tumorigenicity in HCC cells. This system might be a potential strategy for gene therapy of HCC.
Acknowledgments
The authors wish to be grateful to every one of the Department of Clinical Laboratory for their sincere help and technical support.
References
- 1. Farazi PA, DePinho RA. Hepatocellular carcinoma pathogenesis: from genes to environment, Nat Rev Cancer 2006; 6: 674–7. [DOI] [PubMed] [Google Scholar]
- 2. El‐Serag HB, Mason AC. Rising incidence of hepatocellular carcinoma in the United States. N Engl J Med 1999; 340: 745–50. [DOI] [PubMed] [Google Scholar]
- 3. Parkin DM, Bray F, Ferlay J et al . Global cancer statistics 2002. CA Cancer J Clin 2005; 55: 74–108. [DOI] [PubMed] [Google Scholar]
- 4. Davila JA, Morgan RO, Shaib Y et al . Hepatitis C infection and the increasing incidence of hepatocellular carcinoma: a population‐based study. Gastroenterology 2004; 127: 1372–80. [DOI] [PubMed] [Google Scholar]
- 5. Zhou H, Kuang J, Zhong L et al . Tumour amplified kinase STK15/BTAK induces centrosome amplification, aneuploidy and transformation. Nat Genet 1998; 20: 189–93. [DOI] [PubMed] [Google Scholar]
- 6. Carmena M, Earnshaw WC. The cellular geography of aurora kinases. Nat Rev Mol Cell Biol 2003; 4: 842–54. [DOI] [PubMed] [Google Scholar]
- 7. Royce ME, Xia W, Sahin AA et al . STK15/Aurora‐A expression in primary breast tumors is correlated with nuclear grade but not with prognosis. Cancer 2004; 100: 12–9. [DOI] [PubMed] [Google Scholar]
- 8. Reiter R, Gais P, Jütting U et al . Aurora kinase A messenger RNA overexpression is correlated with tumor progression and shortened survival in head and neck squamous cell carcinoma. Clin Cancer Res 2006; 12: 5136–41. [DOI] [PubMed] [Google Scholar]
- 9. Li D, Zhu J, Firozi PF et al . Overexpression of oncogenic STK15/BTAK/Aurora A kinase in human pancreatic cancer. Clin Cancer Res 2003; 9: 991–7. [PubMed] [Google Scholar]
- 10. Yang SB, Zhou XB, Zhu HX et al . Amplification and overexpression of Aurora‐A in esophageal squamous cell carcinoma. Oncol Rep 2007; 17: 1083–8. [PubMed] [Google Scholar]
- 11. Jeng YM, Peng SY, Lin CY et al . Overexpression and amplification of Aurora‐A in hepatocellular carcinoma. Clin Cancer Res 2004; 10: 2065–71. [DOI] [PubMed] [Google Scholar]
- 12. Bolanos‐Garcia VM. Aurora kinases. Int J Biochem Cell Biol 2005; 37: 1572–7. [DOI] [PubMed] [Google Scholar]
- 13. Fumoto S, Nishi J, Nakamura J et al . Gene therapy for gastric diseases. Curr Gene Ther 2008; 8: 187–200. [DOI] [PubMed] [Google Scholar]
- 14. Oger J. Immunosuppression: promises and failures. J Neurol Sci 2007; 259: 74–8. [DOI] [PubMed] [Google Scholar]
- 15. Shim JS, Park HM, Lee J et al . Global and focused transcriptional profiling of small molecule aminopeptidase N inhibitor reveals its mechanism of angiogenesis inhibition. Biochem Biophys Res Commun 2008; 371: 99–103. [DOI] [PubMed] [Google Scholar]
- 16. Gunduz M, Gunduz E, Rivera RS et al . The inhibitor of growth (ING) gene family: potential role in cancer therapy. Curr Cancer Drug Targets 2008; 8: 275–84. [DOI] [PubMed] [Google Scholar]
- 17. Sui G, Soohoo C, Affar el B et al . A DNA vector‐based RNAi technology to suppress gene expression in mammalian cells. Proc Natl Acad Sci USA 2002; 99: 5515–20. [DOI] [PMC free article] [PubMed] [Google Scholar]
- 18. Brummelkamp TR, Bernards R, Agami R. A system for stable expression of short interfering RNAs in mammalian cells. Science 2000; 296: 550–3. [DOI] [PubMed] [Google Scholar]
- 19. Kwak YD, Koike H, Sugaya K. RNA interference with small hairpin RNAs transcribed from a human U6 promoter‐driven DNA vector. Pharmacol Sci 2003; 93: 214–7. [DOI] [PubMed] [Google Scholar]
- 20. Myslinski E, Amé JC, Krol A et al . An unusually compact external promoter for RNA polymerase III transcription of the human H1RNA gene. Nucleic Acids Res 2001; 29: 2502–9. [DOI] [PMC free article] [PubMed] [Google Scholar]
- 21. Scherer LJ, Frank R, Rossi JJ. Optimization and characterization of tRNA‐shRNA expression constructs. Nucl Acids Res 2007; 35: 2620–8. [DOI] [PMC free article] [PubMed] [Google Scholar]
- 22. Huang SL, Wu Y, Yu H et al . Inhibition of Bcl‐2 expression by a novel tumor‐specific RNA interference system increases chemosensitivity to 5‐fluorouracil in Hela cells. Acta Pharmacologica Sinica 2006; 27: 242–8. [DOI] [PubMed] [Google Scholar]
- 23. Chen JS, Liu JC, Shen L et al . Cancer‐specific activation of the survivin promoter and its potential use in gene therapy. Cancer Gene Ther 2004; 11: 740–7. [DOI] [PubMed] [Google Scholar]
- 24. Kang YA, Shin HC, Yoo JY et al . Novel cancer antiangiotherapy using the VEGF promoter‐targeted artificial zinc‐finger protein and oncolytic adenovirus. Mol Ther 2008; 16: 1033–40. [DOI] [PubMed] [Google Scholar]
- 25. Willhauck MJ, Sharif Samani BR, Klutz K et al . Alpha‐fetoprotein promoter‐targeted sodium iodide symporter gene therapy of hepatocellular carcinoma. Gene Ther 2008; 15: 214–23. [DOI] [PubMed] [Google Scholar]
- 26. Liu T, Zhang G, Chen YH et al . Tissue specific expression of suicide genes delivered by nanoparticles inhibits gastric carcinoma growth. Cancer Biol Ther 2006; 5: 1683–90. [DOI] [PubMed] [Google Scholar]
- 27. Orito E, Mizokami M. Differences of HBV genotypes and hepatocellular carcinoma in Asian countries. Hepatol Res 2007; 37: S33–5. [DOI] [PubMed] [Google Scholar]
- 28. Hainaut P, Boyle P. Curbing the liver cancer epidemic in Africa. Lancet 2008; 371: 367–8. [DOI] [PubMed] [Google Scholar]
- 29. Llovet JM, Bruix J. Novel advancements in the management of hepatocellular carcinoma in 2008. J Hepatol 2008; 48: S20–37. [DOI] [PubMed] [Google Scholar]
- 30. El‐Serag HB, Marrero JA, Rudolph L et al . Diagnosis and treatment of hepatocellular carcinoma. Gastroenterology 2008; 134: 1752–63. [DOI] [PubMed] [Google Scholar]
- 31. Wilda M, Fuchs U, Borkhardt A. Killing of leukemic cells with a BCR/ABL fusion gene by RNA interference (RNAi). Oncogene 2002; 21: 5716–24. [DOI] [PubMed] [Google Scholar]
- 32. Jacque JM, Triques K, Stevenson M. Modulation of HIV‐1 replication by RNA interference. Nature 2002; 418: 435–8. [DOI] [PMC free article] [PubMed] [Google Scholar]
- 33. Shlomai A, Shaul Y. Inhibition of hepatitis B virus expression replication by RNA interference. Hepatology 2003; 37: 764–70. [DOI] [PubMed] [Google Scholar]
- 34. Walchli S, Sioud M. Vector‐based delivery of siRNAs: in vitro and in vivo challenges. Front Biosci 2008; 13: 3488–93. [DOI] [PubMed] [Google Scholar]
- 35. Ali M, Sahib MK. Developmental changes in the expression of alpha‐fetoprotein and albumin genes in rat liver: correlation of rates of synthesis of the two proteins in the hepatocytes, their hepatic contents and serum levels during development. Indian J Biochem Biophys 1983; 20: 218–21. [PubMed] [Google Scholar]
- 36. Lu SY, Sui YF, Li ZS et al . Construction of a regulable gene therapy vector targeting for hepatocellular carcinoma. World J Gastroenterol 2003; 9: 688–91. [DOI] [PMC free article] [PubMed] [Google Scholar]
- 37. Pin RH, Reinblatt M, Fong Y. Utilizing alpha‐fetoprotein expression to enhance oncolytic viral therapy in hepatocellular carcinoma. Ann Surg 2004; 240: 659–65; discussion 665–6. [DOI] [PMC free article] [PubMed] [Google Scholar]
- 38. Wang GL, Jiang BH, Rue EA et al . Hypoxia‐inducible factor 1 is a basic‐helix‐loop‐helix‐PAS heterodimer regulated by cellular O2 tension. Proc Natl Acad Sci USA 1995; 92: 5510–14. [DOI] [PMC free article] [PubMed] [Google Scholar]
- 39. Ido A, Uto H, Moriuchi A et al . Gene therapy targeting for hepatocellular carcinoma: selective and enhanced suicide gene expression regulated by a hypoxia‐inducible enhancer linked to a human alpha‐fetoprotein promoter. Cancer Res 2001; 61: 3016–21. [PubMed] [Google Scholar]
- 40. Mazure NM, Chauvet C, Bois‐Joyeux B et al . Repression of alpha‐fetoprotein gene expression under hypoxic conditions in human hepatoma cells: characterization of a negative hypoxia response element that mediates opposite effects of hypoxia inducible factor‐1 and c‐Myc. Cancer Res 2002; 62: 1158–65. [PubMed] [Google Scholar]
- 41. Adams RR, Carmena M, Earnshaw WC. Chromosomal passengers and the (aurora) ABCs of mitosis. Trends Cell Biol 2001; 11: 49–54. [DOI] [PubMed] [Google Scholar]
- 42. Tong T, Zhong Y, Kong J et al . Overexpression of Aurora‐A contributes to malignant development of human esophageal squamous cell carcinoma. Clin Cancer Res 2004; 10: 7304–10. [DOI] [PubMed] [Google Scholar]
- 43. Hata T, Furukawa T, Sunamura M et al . RNA interference targeting aurora kinase a suppresses tumor growth and enhances the taxane chemosensitivity in human pancreatic cancer cells. Cancer Res 2005; 65: 2899–905. [DOI] [PubMed] [Google Scholar]
- 44. Tanaka E, Hashimoto Y, Ito T et al . The suppression of aurora‐A/STK15/BTAK expression enhances chemosensitivity to docetaxel in human esophageal squamous cell carcinoma. Clin Cancer Res 2007; 13: 1331–40. [DOI] [PubMed] [Google Scholar]
- 45. Lan B, Liu BY, Chen XH et al . Inhibition of serine/threonine kinase 15 gene expression induces apoptosis of gastric cancer cells. Zhonghua Wei Chang Wai Ke Za Zhi 2006; 9: 417–20. [PubMed] [Google Scholar]
- 46. Keen N, Taylor S. Aurora‐kinase inhibitors as anticancer agents. Nat Rev Cancer 2004; 4: 927–36. [DOI] [PubMed] [Google Scholar]
- 47. Meng R, Wu G, Cheng J et al . The effect of antisense oligodeoxynucleotides targeting Aurora A kinase on cell proliferation and chemosensitivity to paclitaxel in human lung cancer cell line A549. Chinese-German J Clin Oncol 2007; 6: 258–63. [Google Scholar]
- 48. Du J, Hannon GJ. Suppression of p160ROCK bypasses cell cycle arrest after Aurora‐A/STK15 depletion. Proc Natl Acad Sci USA 2004; 101: 8975–80. [DOI] [PMC free article] [PubMed] [Google Scholar]
- 49. Tao Y, Zhang P, Frascogna V et al . Enhancement of radiation response by inhibition of Aurora‐A kinase using siRNA or a selective Aurora kinase inhibitor PHA680632 in p53‐deficient cancer cells. Br J Cancer 2007; 97: 1664–72. [DOI] [PMC free article] [PubMed] [Google Scholar]