

Abstract
This study aimed to analyze expression of S100A10, annexin II and B‐FABP genes in renal cell carcinoma (RCC) and their potential value as tumor markers. Furthermore, any correlation between the gene expression and prognostic indicators of RCC was analyzed. Expression of each gene was estimated by RT‐PCR in the non‐neoplastic (normal) and tumorous parts of resected kidney samples. Also, each antigen was immunostained in RCC and normal kidney tissues. Expression of the S100A10 gene averaged 2.5‐fold higher in the tumor than that in the normal tissues (n = 47), after standardization against that of β‐actin. However, expression of annexin II, a natural ligand of S100A10, was only 1.64‐fold higher. In the tissue sections of RCC, S100A10 and annexin II were immunostained in membranes. In the normal renal epithelia, however, both antigens were stained in the Bowman's capsule and the tubules from Henle's loop through the collecting duct system, but not in the proximal tubules, from where most RCC are derived. In contrast, expression of the B‐FABP gene was 20‐fold higher in the tumor. No B‐FABP was immunohistochemically detected in normal kidney sections, but it was stained in the cytoplasm of RCC tissue sections. S100A10 and B‐FABP genes were overexpressed regardless of nuclear grade and stage of RCC. Immunopositivity in RCC tissues (n = 13) was 100% for S100A10 and annexin II, and 70% for B‐FABP; however, no clear relationship was observed in either antigen with nuclear grade and stage. It was found that all three performed well as RCC markers. B‐FABP was most specific to RCC, as it was expressed little in normal kidney tissues. (Cancer Sci 2007; 98: 77–82)
We have previously described the overexpression of S100A10 in renal cell carcinoma (RCC) cells compared with the normal human kidney cDNA library.( 1 ) Such overexpression has been confirmed in RCC and non‐neoplastic (normal) tissues in surgically resected kidneys (n = 7).( 1 , 2 ) S100A10 is a member of the S100 family of proteins that are small acidic calcium‐binding proteins with two helix‐loop‐helix EF‐hand motifs. Twenty human S100 family members are expressed in a cell‐ and tissue‐specific manner, and are responsible for a variety of cellular processes including cell proliferation and differentiation.( 3 , 4 ) Sixteen of their genes (designated S100A1–S100A16) are clustered on the chromosome 1q21 region, where a number of chromosomal abnormalities occur with neoplasias.( 4 ) S100A10 forms a heterotetramer with annexin II (S100A10)2 (annexin II)2, and the complex localizes in the extracellular membrane of various cancer cells.( 5 , 6 , 7 )
In the present study, we estimated the gene expression of S100A10 and annexin II by reverse transcription‐polymerase chain reaction (RT‐PCR) in a larger number of surgically resected RCC samples (n = 47) after standardization for the expression of β‐actin in each sample. Then we immunohistochemically investigated the expression of S100A10 and annexin II in RCC and normal kidney tissues (n = 13). The extracellular S100A10/annexin II complex functions as a receptor for plasminogen and regulates the stimulation of plasminogen activator‐dependent plasminogen activation and plasmin formation on cancer cells. These processes are thought to be correlated with tumor invasiveness, metastasis and angiogenesis.( 8 ) Therefore, we examined any correlation between expression of S100A10 and annexin II and prognostic predicators of RCC. As prognostic markers, we chose nuclear grade and stage. Unfavorable prognosis in RCC is frequently associated with high nuclear grades.( 9 , 10 ) Also, the TNM staging system allows good separation of prognostic groups of RCC patients.( 9 , 11 )
We have systematically examined transcriptional expression of eight fatty acid binding protein (FABP) family members found in human tissues. It was noticed that the brain‐type FABP (B‐FABP) gene is overexpressed in RCC samples.( 12 ) In the present study, we evaluated B‐FABP expression as an RCC marker as well as S100A10 and annexin II, after which we immunohistochemically investigated the expression of B‐FABP in RCC and normal kidneys. Furthermore, any correlation between B‐FABP and prognostic indicators was also examined.
Materials and Methods
RCC samples for RT‐PCR. Kidneys were surgically resected at Hamamatsu University Hospital and stored at −80°C. Informed consent for the use of the samples was obtained from each patient. The current study was approved by the Ethical Committee of Hamamatsu University School of Medicine and University of Shizuoka.
The samples were divided into three types: clear cell (n = 44), papillary (n = 2) and chromophobe (n = 1), based on the Union Internationale Contre Le Cancer (UICC) and the American Joint Committee on Cancer (AJCC) workshop on RCC.( 13 ) Nuclear grading was determined by comparing the nuclear size of the epithelial cells of normal proximal tubules as follows: G1 (n = 9), smaller than the nuclear size of the tubular epithelium; G2 (n = 31), equal to the nuclear size of the tubular epithelium; G3 (n = 7), larger than the nuclear size of the tubular epithelium and occasionally displaying unusual characteristics.( 14 ) Each RCC was classified by the predominant nuclear grade exhibited. The stage was determined according to the UICC TNM classification.( 15 )
RT‐PCR for S100A10, annexin II and B‐FABP. Total RNA was isolated from surgically resected tissues using Trizol solution (Invitrogen, Tokyo, Japan). First‐strand cDNA was synthesized in a volume of 20 µL containing 2 µg total RNA, SuperScript III kit (Invitrogen) and oligo(dT)20 primer. PCR amplification was performed for each gene using the indicated primers. The PCR protocol was at 95°C for 5 min followed by 30 cycles of 95°C for 30 s, X°C for 30 s and 72°C for 30 s in a GeneAmp PCR system 2700 (Applied Biosystems, Tokyo, Japan). The PCR product was analyzed on 3% agarose, as described previously.( 1 )
Primers used for the PCR‐amplification were as follows: for S100A10 (NM_002966), forward: CTTCAACGGACCACACCAAA, reverse: GCCCACTTTGCCATCTCTAC, and X = 62; for Annexin II (BC068065), forward: CAGCCTTATCTGGCCACCTG, reverse: CCAGCGTCATAGAGAGATCCCG, and X = 58; and for B‐FABP (NM_001446), forward: GTGGGAAATGTGACCAAACC, reverse: CTCATAGTGGCGAACAGCAA and X = 62. The primers for β‐actin were as previously reported.( 1 )
Immunohistochemistry. We retrieved 13 conventional clear cell RCC from surgical files at Shizuoka General Hospital. All of the RCC were limited to the kidney, without node and distant metastasis. Three were G1, eight were G2 and two were G3. In terms of pT category,( 15 ) eight were pT1a, two were pT1b and three were pT2; inevitably, the stage grouping was ten Stage I cases and three Stage II cases.
Immunohistochemical study was performed on 10% formalin‐fixed, paraffin‐embedded tissues derived from the RCC and non‐neoplastic parts of each resected kidney. Serial sections from each representative tissue block were deparaffinized and dehydrated. For S100A10 and annexin II staining, the sections were subjected to heat antigen retrieval in a 10 mM sodium citrate buffer (pH 6.0) for 15 min at 100°C. No antigen retrieval was performed for B‐FABP staining. Endogenous peroxidase was blocked with 0.3% hydrogen peroxide in methanol for 15 min. Then mouse antihuman S100A10 monoclonal antibody (mAb S100A10), mouse antihuman annexin II monoclonal antibody (mAb annexin II, BD Bioscience, Tokyo, Japan) or goat antihuman B‐FABP polyclonal antibody (Santa Cruz Biotechnology, Santa Cruz, CA, USA) was applied to the sections at a dilution ratio of 1/200, 1/100 and 1/50, respectively, and incubated for 30 min at room temperature. In these labeled antigens, S100A10 and annexin II were detected with a ChemMate EnVision (Dako, Carpinteria CA, USA), and B‐FABP was detected with a LSAB Kit/HRP (Dako). Reaction products were visualized with 3,3′‐diaminobenzidine. These sections were finally counterstained with Mayer's hematoxylin and mounted.
For the examination of the immunospecificity of mAb S100A10 and anti‐B‐FABP antibody, the antibodies absorbed by an excess of recombinant S100A10 or B‐FABP were used instead of the primary antibody, respectively. No apparent immunoreactivity was found in the negative‐control sections.
RCC cells and culture. Human RCC cell line TUHR14TKB (RCB 1383) and RCC10RGB9 (RCB 1151) cells were obtained from Riken Cell Bank (Tsukuba, Japan) and cultivated in F12 medium with 10% heat‐inactivated fetal bovine serum (Sigma, St. Louis, MO, USA) and antibiotics in a 5% CO2 incubator.( 16 )
Pull‐down assay. Membrane fractions were prepared from cultured cells as described previously.( 17 ) Membrane and whole cells were made soluble with 0.5% NP‐40 in 0.15 M NaCl, 0.05 M HEPES, pH 7.5. The mAb S100A10 was conjugated to CNBr‐activated Sepharose 4B beads (GE Healthcare, Piscataway, NJ, USA) according to the manufacturer's instructions and suspended to 50% in 0.1 M Tris‐HCl, pH 8.0, 0.5 M NaCl. The NP‐40 lysate (500 µL) was incubated with 50 µL beads with gentle shaking at 4°C for 60 min. The beads were then pulled down in a bench‐top centrifuge, washed twice with a detergent solution (0.3 M Tris‐HCl, pH 8.6, 0.3 M NaCl, 0.1% SDS, 0.05% NP‐40) and three times with a high‐salinity buffer (0.6 M NaCl, 12.5 mM NaP, pH 7.4). Finally, beads were suspended in the sodium dodecyl sulfate‐polyacrylamide gel electrophoresis (SDS‐PAGE) sample buffer, boiled for 3 min, briefly centrifuged, and then the supernatant was subjected to SDS‐PAGE. After blotting on a polyvinylidene difluoride (PVDF) membrane, S100A10 and annexin II were detected by immunostaining.
Immunofluorescent staining of RCC cells. Cells grown on coverslips were fixed with 3% paraformaldehyde in phosphate‐buffered saline (PBS) for 15 min and blocked with 3% bovine serum albumin (BSA) in PBS. Cells were then stained with mAb S100A10 or mAb annexin II followed by TRITC‐conjugated goat antimouse IgG (Sigma), which was repeatedly preabsorbed with paraformaldehyde‐fixed RCC cells. As a control, cells were stained with mouse pre‐immune serum. Cells were then scanned under a confocal laser microscope (Bio‐Rad MRC‐1024).
Statistical analysis. Each value of t‐test or χ2‐test was calculated according to the Free JSTAT 8.2 for Windows.
Results
Expression of S100A10, annexin II and B‐FABP genes in the resected RCC samples. Transcriptional expression of S100A10, annexin II, B‐FABP and β‐actin genes in RCC and normal kidney samples was measured by RT‐PCR, and the intensity of each amplified band, imaged by Scion Image beta 4, was plotted against the PCR cycles. The PCR products of these genes increased in a cycle‐dependent manner up to 30 cycles (data not shown).
Expression of S100A10, annexin II and B‐FABP in normal and tumor tissues (n = 47) was standardized against that of corresponding β‐actin (Fig. 1). Expression of the S100A10 gene was on average 0.38 and 0.95 arbitrary units in the normal and tumor tissues, respectively, indicating that S100A10 is overexpressed 2.5‐fold in RCC (P < 0.0001, t‐test; Fig. 1A). Also, the annexin II gene was overexpressed 1.6 fold in RCC (0.73 and 1.20 units, respectively, P < 0.003; Fig. 1B). Furthermore, gene expression of B‐FABP was negligible in the normal tissues, resulting in a 20‐fold overexpression in RCC (0.04 and 0.78 units, respectively, P < 0.0001; Fig. 1C).
Figure 1.
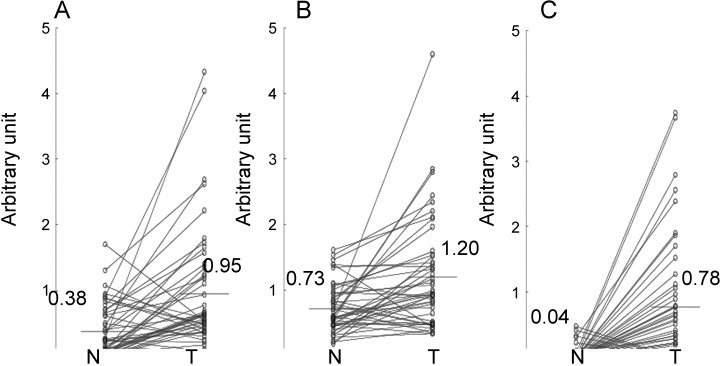
Transcriptional expression of (A) S100A10, (B) annexin II and (C) B‐FABP genes in renal cell carcinoma. The arbitrary unit represents the PCR‐amplified expression of the gene plotted against that of the β‐actin gene in the normal and tumor parts of surgically resected kidney samples (n = 47). N, normal, T, tumor.
Immunohistochemical detection of S100A10, annexin II and B‐FABP in RCC samples. Expression of S100A10, annexin II and B‐FABP in RCC and non‐neoplastic kidney tissues (n = 13) was investigated immunohistochemically (Fig. 2). The immunolocalization of S100A10 and annexin II was basically the same, regardless of whether the kidney tissue was non‐neoplastic (Fig. 2D–G) or cancerous (Fig. 2A,B). In non‐neoplastic kidney tissues, positive reactions were clearly and ubiquitously found in the collecting duct system, the thin portion of Henle's loop and Bowman's capsule. Moreover, reaction was also observed in many of the distal convoluted tubules, a part of the thick portion of Henle's loop and some glomerular podocytes. Few of the proximal tubules showed reaction. The immunoreactivity in the tubular epithelia showed a membranous, especially luminal, staining pattern with or without faint, granular cytoplasmic staining. In RCC samples, immunopositivity was also seen on the plasma membrane with some faint cytoplasmic‐staining (Fig. 2A,B). In addition, positive reactions were found in endothelial cells in non‐neoplastic and cancerous tissues.
Figure 2.
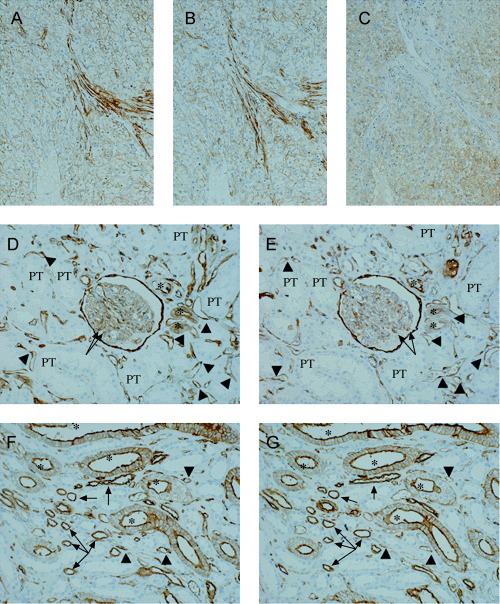
Immunohistochemistry for the three antigens on the serial sections of cancerous and normal renal tissues. (A–C) Serial sections of G2 renal cell carcinoma (original magnification ×14). Positive staining for S100A10 (A) and annexin II (B) is diffusely found on the plasma membrane and occasionally appeared faintly in the cytoplasm. Immunopositivity of B‐FABP (C) is seen in the cytoplasm of the carcinoma cells. (D, E) Normal renal cortex (original magnification ×14). Bowman's capsule and some of the distal convoluted tubules (asterisks) and glomerular podocytes (arrows) are positively stained for S100A10 (D) and annexin II (E). Immunostaining is also found in endothelial cells (arrowheads). The few proximal tubules (PT) represent the signals. (F, G) Normal renal medulla (original magnification ×14). The immunopositivity for S100A10 (F) is in agreement with that for annexin II (G). Positive reactions observed are mainly associated with the plasma membrane of the collecting duct (asterisks) and the thin portion of Henle's loop (arrows). Endothelium (arrowheads) is also diffusely positive for both proteins.
In contrast, B‐FABP was immunohistochemically detected in nine of the 13 RCC cases. Immunoreactivity for B‐FABP was heterogeneous and showed a fine granular cytoplasmic staining pattern (Fig. 2C). No apparent immunopositivity for B‐FABP was seen in the normal kidney tissues (n = 13).
Localization of S100A10 and annexin II complex on the membrane of cultured RCC cells. We initially tested gene expression of S100A10 and annexin II in human RCC cell lines. Two cultured RCC cells, TUHR14TKB and RCC10RGB9, were confirmed to express S100A10 and annexin II genes by RT‐PCR (data not shown). Furthermore, both proteins were detected by western blotting not in the cytosol, but on the membrane of these cells (Fig. 3A). Annexin II was coprecipitated with mAb S100A10 in the NP‐40‐treated membrane solution (Fig. 3A), indicating S100A10/annexin II complex formation on the membrane.
Figure 3.
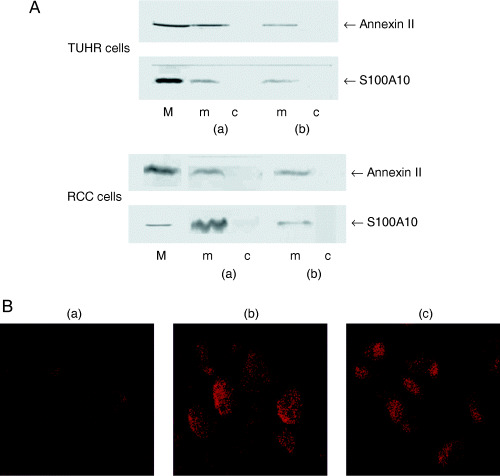
Localization of S100A10 and annexin II complex on the membrane of cultured renal cell carcinoma cells. (A) Pull‐down assay for S100A10 and annexin II complex. S100A10 and annexin II were analyzed in the lysate from membrane (m) and cytosol (c) fraction of TUHR14TKB and RCC10RGB9 cells (a) by western blotting or (b) after being pulled down with mAb S100A10–Sepharose beads. M indicates the marker for S100A10 and annexin II. (B) Immunofluorescent detection of (a) pre‐immune serum, (b) S100A10 and (c) annexin II on RCC10RGB9 cells. Cells were stained without being made permeable with NP‐40.
The RCC10RGB9 cells were then fixed with 3% paraformaldehyde, treated with or without NP‐40 and immunostained with mAb S100A10 and mAb annexin II followed by the TRITC‐conjugated antimouse IgG antibody (Fig. 3B). The cell membranes were stained by each mAb (Fig. 3B), even without NP‐40 being made permeable. Taken together, S100A10 and annexin II formed a complex on the outer surface of RCC10RGB9 cells, as reported in other cultured cancer cells.( 5 , 6 , 7 ) Exactly the same result was obtained with TUHR14TKB cells (data not shown).
Relationship between gene expression and prognostic factors of RCC. First we determined the number of overexpressed cases for each gene (Table 1). We have classified overexpression as expression in a tumor tissue being 1.33‐fold higher than that in the normal tissue.( 18 ) Overexpression of S100A10 and B‐FABP was confirmed (P < 0.05 and P < 0.005, respectively, χ2‐test), but annexin II was not defined as overexpressed under this criterion. Then the 47 RCC cases were classified according to the nuclear grade and stage, and overexpression of three genes in each class was summarized (Table 1). S100A10 and B‐FABP was overexpressed regardless of nuclear grade and stage. Conversely, annexin II was not overexpressed except for in nuclear grade G1 (P < 0.05).
Table 1.
Relationship between overexpression of genes and nuclear grade or stage in 47 surgically resected kidney samples
| Grade or stage | n | S100A10 overexpression | Annexin II overexpression | B‐FABP overexpression | |||
|---|---|---|---|---|---|---|---|
| Positive | P value † | Positive | P value † | Positive | P value † | ||
| Total | 47 | 34 | <0.05 | 26 | NS | 36 | <0.005 |
| Nuclear grade | |||||||
| G1 | 9 | 8 | <0.025 | 8 | <0.025 | 8 | <0.025 |
| G2 | 31 | 21 | <0.05 | 14 | NS | 22 | <0.025 |
| G3 | 7 | 5 | NS | 4 | NS | 6 | NS |
| Stage | |||||||
| Stage I | 26 | 19 | <0.025 | 15 | NS | 20 | <0.01 |
| Stage II | 4 | 2 | NS | 2 | NS | 1 | NS |
| Stage III | 9 | 7 | NS | 5 | NS | 8 | <0.025 |
| Stage IV | 8 | 6 | NS | 4 | NS | 7 | <0.05 |
| Stage II–IV | 21 | 15 | <0.05 | 11 | NS | 16 | <0.025 |
χ2‐test; NS, not significant.
Next, the relationship between the immunoreactivity against three antigens and nuclear grade, T category or stage in the 13 RCC cases was determined (Table 2). All RCC sections showed S100A10‐ and annexin II‐positivity, whereas only 70% were B‐FABP positive. No other relationship was found between the antibody immunoreactivity and nuclear grade, T category or stage, except that S100A10 staining represented a stable reaction.
Table 2.
Relationship between antibody immunoreactivity and nuclear grade, T category or stage in 13 renal cell carcinomas
| Grade or stage | n | S100A10 immunoreactivity † | Annexin II immunoreactivity † | B‐FABP immunoreactivity † | |||||||||
|---|---|---|---|---|---|---|---|---|---|---|---|---|---|
| 0% | <10% | ≥10<50% | ≥50% | 0% | <10% | ≥10<50% | ≥50% | 0% | <10% | ≥10<50% | ≥50% | ||
| Total | 13 | 0 | 0 | 1 | 12 | 0 | 3 | 2 | 8 | 4 | 3 | 2 | 4 |
| Nuclear grade | |||||||||||||
| G1 | 3 | – | – | 1 | 2 | – | 1 | 1 | 1 | 1 | – | 1 | 1 |
| G2 | 8 | – | – | – | 8 | – | 2 | 1 | 5 | 2 | 3 | 1 | 2 |
| G3 | 2 | – | – | – | 2 | – | – | – | 2 | 1 | – | – | 1 |
| T category | |||||||||||||
| pT1a | 8 | – | – | 1 | 7 | – | 3 | 1 | 4 | 2 | 2 | – | 4 |
| pT1b | 2 | – | – | – | 2 | – | – | – | 2 | – | 1 | 1 | – |
| pT2 | 3 | – | – | – | 3 | – | – | 1 | 2 | 2 | – | 1 | – |
| Stage | |||||||||||||
| Stage I | 10 | – | – | 1 | 9 | – | 3 | 1 | 6 | 2 | 3 | 1 | 4 |
| Stage II | 3 | – | – | – | 3 | – | – | 1 | 2 | 2 | – | 1 | – |
Percentage of positively stained tumor cells.
Discussion
We have previously reported overexpression of the S100A10 gene in seven RCC cases, although the experimental procedure (RNA extraction, primer sequence and PCR cycle) was slightly different from the current study.( 1 , 2 ) Nevertheless we confirmed here overexpression of the S100A10 gene in 47 RCC samples (Fig. 1A). Furthermore, the annexin II gene, the natural ligand of S100A10, was also overexpressed in the RCC (Fig. 1B). We immunohistochemically demonstrated the expression of S100A10 and annexin II in the normal renal cortex and medulla (Fig. 2D–G). As most RCC originate from proximal tubules,( 19 ) the normal kidney tissues used as controls were sampled from the non‐neoplastic cortex where proximal tubules localize. In the cortex, S100A10 and annexin II were scarcely immunostained in the proximal tubules but stained in the Bowman's capsule and glomerular podocytes (Fig. 2D,E). Therefore, it is probable that both genes are not expressed in the normal proximal tubules but are induced upon malignant transformation of the normal cells. Furthermore, elevated gene expression of S100A10 and annexin II in the normal tissues (Fig. 1A,B) would reflect the expression of these genes in Bowman's capsule and glomerular podocytes.
In the renal medulla, both antigens were found in the collecting duct system, the thin portion of Henle's loop, the distal convoluted tubules and a part of the thick portion of Henle's loop (Fig. 2F–G). Recently, the S100A10/annexin II complex was demonstrated to be associated with epithelial Ca2+ channel ECaC1 (TRPV5), and to play a role in active Ca2+ reabsorption in the kidney.( 20 , 21 ) The Ca2+ reabsorption through active transport takes place from Henle's loop, through the distal convoluted tubules to the collecting duct system.( 22 ) Therefore, our immunohistochemical staining pattern would strongly support a physiological role of the S100A10/annexin II complex in Ca2+ reabsorption in the kidney.
In contrast, we demonstrated that the B‐FABP gene, another candidate for an RCC marker, is overexpressed in RCC tissue (Fig. 1C) and that the gene product was immunohistochemically detectable in 70% of RCC sections (Fig. 2C, Table 2). As gene and protein expression of B‐FABP was negligible in the normal kidney tissue (Fig. 1C; Table 2), B‐FABP could be considered highly specific to RCC.
In the study using two human RCC cell lines, S100A10 and annexin II formed a complex on the extracellular membrane of those cells (Fig. 3), as shown on many other cancer cells.( 5 , 6 , 7 ) The cell surface S100A10/annexin II complex activates plasminogen to form plasmin.( 8 ) The loss of S100A10 from the extracellular surface of cancer cells results in a significant loss in plasmin generation.( 8 ) Furthermore, S100A10 knock‐down cells exhibit a dramatic loss in extracellular matrix degradation and invasiveness as well as reduced metastasis.( 8 ) Therefore, it is predictable that overproduction of S100A10 and annexin II in RCC would be correlated with poor prognostic indicators.
Nuclear grade is one of significant predictors of RCC‐specific survival.( 9 , 10 ) Also, the TNM staging system separates prognostic groups of RCC patients.( 9 , 11 ) The S100A10 and B‐FABP genes were overexpressed regardless of nuclear grade or stage (Table 1). Conversely, the annexin II gene was not overexpressed except for in G1. Seven of eight G1 samples concurrently overexpressed S100A10 and annexin II (P < 0.05, χ2‐test), whereas 13 of 26 G2 (not significant [NS]) and four of seven G3 samples (NS) concurrently overexpressed these genes. Therefore, simultaneous gene expression of S100A10 and annexin II was characteristic to G1 samples and might be a favorable sign for RCC prognosis.
It is known that growth of cancer cells requires new blood supply through angiogenesis, which is balanced between pro‐ and anti‐angiogenic factors produced by cancer and host cells.( 23 ) Cancer cells produce an angiogenic inhibitor such as angiostatin,( 24 ) which is a fragment of plasmin produced by cleavage of disulfide bonds of kringle 5 of plasmin followed by autoproteolysis.( 25 ) Recently, it was demonstrated that the S100A10/annexin II heterotetramer stimulates angiostatin formation through direct involvement of the tetramer in the reduction of plasmin disulfide.( 26 ) Our present result suggesting that overexpression of S100A10 and annexin II in RCC might be a favorable sign for RCC diagnosis could be explainable if angiostatin formation in RCC is considered. It is essential to study the level of circulating anti‐angiogenic factors( 27 ) and long‐term follow up for the clinical outcome on a larger number of RCC patients, in order to fully understand the current result. In the immunohistochemical studies shown in Table 2, S100A10 and annexin II were stained in all RCC sections (n = 13) regardless of nuclear grade, although the number of sections was small.
The B‐FABP gene is not expressed in normal human tissues except for the brain.( 12 ) In the current study, we showed that the B‐FABP gene and protein were well expressed in RCC tissues. Recently it was demonstrated that the serum level of B‐FABP is a sensitive marker for brain injury.( 28 , 29 , 30 ) B‐FABP in the serum or urine as a potential diagnostic and prognostic marker for RCC is currently under investigation.
Acknowledgment
This study was supported in part by a Grant for Scientific Research from the Ministry of Education, Culture, Sports, Science and Technology, Japan, to S. Ozono.
References
- 1. Teratani T, Watanabe T, Kuwahara F et al. Induced transcriptional expression of calcium‐binding protein S100A1 and S100A10 genes in human renal cell carcinoma. Cancer Lett 2002; 175: 71–7. [DOI] [PubMed] [Google Scholar]
- 2. Teratani T, Watanabe T, Yamahara K et al. Restricted expression of calcium‐binding protein S100A5 in human kidney. Biochem Biophys Res Commun 2002; 291: 623–7. [DOI] [PubMed] [Google Scholar]
- 3. Donato R. Functional roles of S100 proteins, calcium‐binding proteins of the EF‐hand type. Biochim Biophys Acta 1999; 1450: 191–231. [DOI] [PubMed] [Google Scholar]
- 4. Heizmann CW, Fritz G, Schäfer W. S100 proteins: structure, functions and pathology. Frontiers Biosci 2002; 7: 1356–68. [DOI] [PubMed] [Google Scholar]
- 5. Choi K‐S, Fogg DK, Yoon C‐S et al. p11 regulates extracellular plasmin production and invasiveness of HT1080 fibrosarcoma cells. FASEB J 2003; 17: 235–46. [DOI] [PubMed] [Google Scholar]
- 6. Mai J, Finley RL Jr, Waisman DM et al. Human procathepsin B interacts with the annexin II tetramer on the surface of tumor cells. J Biol Chem 2000; 275: 12806–12. [DOI] [PubMed] [Google Scholar]
- 7. Zobiack N, Gerke V, Rescher U. Complex formation and submembranous localization of annexin 2 and S100A10 in live HepG2 cells. FEBS Lett 2001; 500: 137–40. [DOI] [PubMed] [Google Scholar]
- 8. Kwon M, MacLeod TJ, Zhang Y et al. S100A10, annexin A2, and annexin A2 heterotetramer as candidate plasminogen receptors. Front Biosci 2005; 10: 300–25. [DOI] [PubMed] [Google Scholar]
- 9. Amin Ma B, Amin Mi B, Tamboli P et al. Prognostic impact of histologic subtyping of adult renal epithelial neoplasms. Am J Surg Pathol 2002; 26: 281–91. [DOI] [PubMed] [Google Scholar]
- 10. Lohse CM, Blute ML, Zincke H et al. Comparison of standardized and nonstandardized nuclear grade of renal cell carcinoma to predict outcome among 2042 patients. Am J Clin Pathol 2002; 118: 877–86. [DOI] [PubMed] [Google Scholar]
- 11. Moch H, Gasser T, Amin MB et al. Prognostic utility of the recently recommended histologic classification and revised TNM staging system of renal cell carcinoma. Cancer 2000; 89: 604–14. [PubMed] [Google Scholar]
- 12. Teratani T, Domoto T, Kuriki K et al. Detection of the transcript for brain‐type fatty acid binding protein in the tumor and urine of patients with renal cell carcinoma. Urology 2006. (in press). [DOI] [PubMed] [Google Scholar]
- 13. Störkel S, Eble JN, Adlakha K et al. Classification of renal cell carcinoma. Cancer 1997; 80: 987–9. [DOI] [PubMed] [Google Scholar]
- 14. Japanese Urological Association, the Japanese Society of Pathology, Japan Radiological Sociaty , eds. General Rules for Clinical and Pathological Studies on Renal Cell Carcinoma, 3rd edn. Tokyo: Kanehara, 1999; 73 (in Japanese). [Google Scholar]
- 15. Guinan P, Sobin LH, Algaba F et al. TNM staging of renal cell carcinoma. Cancer 1997; 80: 992–3. [DOI] [PubMed] [Google Scholar]
- 16. Arai K, Teratani T, Kuruto‐Niwa R et al. S100A9 expression in invasive ductal carcinoma of the breast: S100A9 expression in adenocarcinoma is closely associated with poor tumour differentiation. Eur J Cancer 2004; 40: 1179–87. [DOI] [PubMed] [Google Scholar]
- 17. Wang H, Schultz R, Hong J et al. Cell surface‐dependent generation of angiostatin 4.5. Cancer Res 2004; 64: 162–8. [DOI] [PubMed] [Google Scholar]
- 18. Ji J, Zhao L, Wang X et al. Differential expression of S100 gene family in human esophageal squamous carcinoma. J Cancer Res Clin Oncol 2004; 130: 480–6. [DOI] [PubMed] [Google Scholar]
- 19. Aizawa S, Kikuchi Y, Suzuki M et al. Renal cell carcinoma of lower nephron origin. Acta Pathol Jpn 1987; 37: 567–74. [DOI] [PubMed] [Google Scholar]
- 20. Van De Graaf SF, Hoenderop JG, Gkika D et al. Functional expression of the epithelial Ca2+ channels (TRPV5 and TRPV6) requires association of the S100A10‐annexin 2 complex. EMBO J 2003; 22: 1478–87. [DOI] [PMC free article] [PubMed] [Google Scholar]
- 21. Hoenderop JG, Nilius B, Bindels RJ. ECaC: the gatekeeper of transepithelial Ca2+ transport. Biochim Biophys Acta 2002; 1600: 6–11. [DOI] [PubMed] [Google Scholar]
- 22. Friedman PA. Renal calcium metabolism. In: Seldin DW, Giebisch G, eds. The Kidney: Physiology and Pathophysiology, 3rd edn. Philadelphia: Lippincott. Williams & Wilkins, 2000; 1749–89. [Google Scholar]
- 23. Hanahan D, Folkman J. Patterns and emerging mechanisms of the angiogenic switch during tumorigenesis. Cell 1996; 86: 353–64. [DOI] [PubMed] [Google Scholar]
- 24. O’Reilly MS, Holmgren L, Shing Y et al. Angiostatin: a novel angiogenesis inhibitor that mediates the suppression of metastasis by a Lewis lung carcinoma. Cell 1994; 79: 315–28. [DOI] [PubMed] [Google Scholar]
- 25. Stathakis P, Lay AJ, Fitzgerald M et al. Angiostatin formation involves disulfide bond reduction and proteolysis in kringle 5 of plasmin. J Biol Chem 1999; 274: 8910–6. [DOI] [PubMed] [Google Scholar]
- 26. Kwon M, Yoon C‐S, Jeong W et al. Annexin A2–S100A10 heterotetramer, a novel substrate of thioredoxin. J Biol Chem 2005; 280: 23584–92. [DOI] [PubMed] [Google Scholar]
- 27. Peeters CFJM, De Geus L‐F, Westphal JR et al. Decrease in circulating anti‐angiogenic factors (angiostatin and endostatin) after surgical removal of primary colorectal carcinoma coincides with increased metabolic activity of liver metastases. Surgery 2005; 137: 246–9. [DOI] [PubMed] [Google Scholar]
- 28. Pelsers MM, Hanhoff T, Van der Voort D et al. Brain‐ and heart‐type fatty acid‐binding proteins in the brain: tissue distribution and clinical utility. Clin Chem 2004; 50: 1568–75. [DOI] [PubMed] [Google Scholar]
- 29. Pelsers MM, Hermens WT, Giatz JF. Fatty acid‐binding proteins as plasma markers of tissue injury. Clin Chim Acta 2005; 352: 15–35. [DOI] [PubMed] [Google Scholar]
- 30. Wunderlich MT, Hanhoff T, Goertler M et al. Release of brain‐type and heart‐type fatty acid‐binding proteins in serum after acute ischaemic stroke. J Neurol 2005; 252: 718–24. [DOI] [PubMed] [Google Scholar]