

Abstract
Although the main cause of gastrointestinal stromal tumor (GIST) is gain‐of‐function mutations in the c‐kit gene in the interstitial cells of Cajal, concomitant genetic or epigenetic changes other than c‐kit appear to occur in the development of metastasis. We sought to identify the genes involved in the metastatic process of gastric GIST. Microarray analysis was performed to compare gene expressions between three gastric GIST and four metastatic liver GIST. Expression levels were higher for 165 genes and lower for 146 genes in metastatic liver GIST. The upregulation of five oncogenes and downregulation of four tumor suppressor genes including versican and CD9 were confirmed by quantitative reverse transcriptional PCR. Immunohistochemistry in 117 GIST revealed that protein levels of versican and CD9 were higher and lower, respectively, in metastatic GIST. High expression of versican and low expression of CD9 in 104 primary gastric GIST correlated with poor disease‐free survival (P = 0.0078 and P = 0.0018). In addition to the c‐kit gene mutation, genetic or epigenetic changes other than c‐kit play important roles in the metastatic process. In particular, versican and CD9 are potential prognostic markers in gastric GIST. (Cancer Sci 2011; 102: 883–889)
Gastrointestinal stromal tumor (GIST) is the most common mesenchymal tumor of the gastrointestinal tract. The main cause of GIST is gain‐of‐function mutations in the c‐kit gene in the interstitial cells of Cajal. Most of these mutations are located in exon 11 that encodes the KIT receptor juxtamembrane domain, while others are located in exons 9, 13 and 17.( 1 , 2 , 3 , 4 ) In a small subset of GIST without c‐kit mutations, alternative oncogenic activating mutations (e.g., in exons 12 and 18 of the platelet‐derived growth factor receptor [PDGRFA] gene) may be involved.( 5 , 6 )
An orally bioactive tyrosine kinase inhibitor (TKI), imatinib mesylate (Glivec, Gleevec; Novartis, Basel, Switzerland), has been shown to inhibit KIT and PDGFR.( 7 ) The safety and efficacy of imatinib treatment in patients with metastatic GIST has been confirmed by the results of phase I/II trials.( 8 , 9 ) Although the benefit of adjuvant imatinib in patients with high‐risk GIST has been reported,( 10 ) it is still controversial which risk classification or biological markers should be used for patient selection. Furthermore, late resistance to imatinib has been observed in most patients with recurrent or metastatic GIST, and a high incidence of adverse events due to imatinib has also been reported.( 11 , 12 , 13 , 14 ) In the era of TKI, identifying novel biological markers appears to be important not only in patient selection for adjuvant imatinib therapy, but also in developing novel therapeutic targets that can be effective for the treatment of imatinib‐resistant GIST.
Although a relationship between c‐kit and PDGFRA mutations and clinical outcomes has been reported,( 15 , 16 , 17 ) other genetic as well as epigenetic changes may enhance the malignant potential of GIST and therefore affect patients’ prognosis. In 40–90% of patients, postoperative recurrence or metastasis is often observed after surgical resection and is associated with poor prognosis.( 18 , 19 ) Therefore, it would be beneficial to determine the difference between primary and metastatic GIST so that the patients’ prognosis can be predicted and novel molecular target therapies can be developed. In earlier papers, we compared primary gastric and metastatic liver GIST immunohistochemically and genetically, and reported that the loss of heterozygosity of the c‐kit gene or the loss of chromosome 4q could be responsible for GIST liver metastasis.( 20 , 21 ) Other chromosomal changes, such as the loss of 1p, 10, 14q, 15q or 22q and gene amplifications of 1q, 5, 8q, 17q or 20 in conjunction with c‐kit alteration, have also been reported in metastatic GIST.( 22 , 23 , 24 , 25 , 26 , 27 ) However, it remains unclear how the loss and gain of these chromosomal sites enhances the malignant potential of gastric GIST, and whether upregulation of oncogenes or downregulation of tumor suppressor genes is involved. Therefore, we have used microarray analysis to identify genes involved in the GIST metastatic process and prognostic markers of gastric GIST patients.
Materials and Methods
Patients and tumors. Frozen tissue specimens of three gastric GIST and four metastatic liver tumors from gastric GIST were utilized for microarray analysis. None of the patients had received imatinib therapy before surgery. Formalin‐fixed paraffin‐embedded tissues of 104 primary GIST and 13 metastatic GIST from 107 patients who had undergone surgery at Hamamatsu University School of Medicine, Hamamatsu Medical Center, Iwata City Hospital, Shimizu City Hospital, Fukuroi City Hospital, Shinshiro City Hospital, Osaka University and Osaka Police Hospital between October1984 and May 2010 were included for immunohistochemistry investigations. Ethical approval for the study was obtained from the Institutional Review Board, and all patients provided written informed consent.
Direct sequencing for c‐kit and PDGFRA. Genomic DNA was extracted from the frozen GIST samples and exons 9, 11, 13 and 17 of the c‐kit gene and exons 12 and 18 of the PDGFRA gene were amplified by polymerase chain reaction (PCR) as previously described.( 20 ) The PCR products were electrophoresed through 3.0% agarose gels containing ethidium bromide. Each band was excised from the gel and extracted. Direct sequencing of the DNA extracted from the gel was carried out as previously described.( 20 )
Microarray analysis. Total RNA was extracted from frozen GIST using the RNeasy Mini kit (Qiagen, Valencia, CA, USA). The intensity and quantity of total RNA was assessed with a Nanodrop ND‐1000 spectrophotometer (Nanodrop Technologies, Wilmington, DE, USA). The expression profile of primary GIST and metastatic liver GIST was determined using the Affymetrix oligonucleotide microarray (Human Gene 1.0 ST) according to the manufacturer’s protocol. Data were analyzed using the GeneSpringGX11 software (Agilent, Santa Clara, CA, USA). Hierarchical clustering analysis and gene ontology analysis were performed with at least a twofold change and P value scores of <0.05.
Quantitative reverse transcription PCR. Total RNA was extracted as described above and reverse transcription was performed using the PrimeScript RT reagent kit (Takara Bio, Shiga, Japan). The resulting cDNA was amplified by real‐time PCR using the Real Time System (Takara Bio) and SYBR Green PCR Mastermix (Takara Bio). The primer sequences and annealing temperatures used are shown in Table S1. Relative expression levels of each mRNA were normalized to glyceraldehydes 3‐phosphate dehydrogenase.
Immunohistochemical analysis. To determine protein expressions, we performed immunohistochemical staining using 4‐μm sections of formalin‐fixed paraffin‐embedded tissues obtained from surgical specimens. Rabbit polyclonal antibodies against human versican (Sigma, Milwaukee, WI, USA) and CD9 (Abcam, Cambridge, MA, USA) were used. Tumor sections were deparaffinized with successive xylene and ethanol treatment, as well as rehydration. Antigen retrieval was conducted by heating the samples at 90°C for 40 min in 10 mM sodium citrate (pH 6.0). Endogenous peroxidase was blocked by incubation in 3% hydrogen peroxide for 30 min. Sections were washed in PBS and then incubated with the primary antibodies, anti‐versican (1:30 dilution) and anti‐CD9 (1:100 dilution) at 4°C overnight. Sections were incubated with peroxidase‐labeled polymer Histofine Simple Stain MAX PO (Nichirei, Tokyo, Japan) for 30 min. Signals were developed using 3, 3′‐diamonobenzidine (Nichirei) and counterstained with hematoxylin for 1 min. Dehydration was performed following a standard procedure. We used thyroid and corpus uteri as positive controls, and liver and pancreas as negative controls for versican. Similarly, we used kidney and lung as positive controls, and lymph node and liver as negative controls for CD9. To rule out nonspecific immunoreactions, sections were incubated with secondary antibodies without primary antibodies. The specificity of CD9 antibody was tested by serial dilution and an absorption test. Versican staining was analyzed using Scion Image software. The number of pixels in the versican‐positive area and the total pixels for the whole image were counted. The dimension of the versican‐positive area was quantified by dividing the versican‐positive pixels by the total pixels. We measured the versican‐positive dimensions in five or more randomly selected ×200 high‐power fields (HPF), and calculated the mean dimension. CD9 immunoreactivity was evaluated independently by three board‐certified pathologists with no knowledge of the clinical data. The staining intensity of CD9 was scored as 0 (none), 1+ (weak), 2+ (moderate) or 3+ (strong). When heterogeneity was seen, the evaluation was made in the predominant area. Scores of 0 and 1+ were defined as CD9‐negative and scores of 2+ and 3+ were defined as CD9‐positive.
Statistical analysis. qRT‐PCR data were analyzed by the Student’s t‐test, and P values <0.05 were considered statistically significant. Correlation between versican expression and risk grade was analyzed by two‐way anova with the Bonferroni post hoc test. Patients’ disease‐free survival (DFS) rates were calculated using the Kaplan–Meier method, and statistically significant differences in DFS were identified using the log‐rank test.
Results
Microarray analysis of primary gastric and metastatic liver GIST. To identify the upregulated and downregulated genes in the metastatic liver GIST, microarray analyses were performed using RNA extracted from three primary gastric GIST without synchronous or metachronous metastasis, and from four metastatic liver tumors that originated from gastric GIST. Patient profiles are shown in Table 1. Of 28 869 genes analyzed, 311 genes were differentially expressed between primary and metastatic liver GIST by at least twofold and with P values <0.05 (Fig. 1A, Table S2). When compared with the primary gastric GIST, 165 genes were upregulated and 146 genes were downregulated in metastatic liver GIST. Gene ontology analysis further revealed that the majority of genes altered in the metastatic process were involved in protein binding, cell division, cell cycle, cellular organization and other biological process (Table S3).
Table 1.
Clinicopathological and genetic findings in three primary gastric GIST and four metastatic liver tumors from gastric GIST used for microarray analysis
| Case no. | Age (years) | Sex | Lesion | Size (mm) | Histology | KIT | CD34 | SMA | S‐100 | Mitosis | Ki‐67 LI (%) | c‐kit mutation |
|---|---|---|---|---|---|---|---|---|---|---|---|---|
| 1 | 76 | M | Stomach | 33 | Spindle type | + | + | − | + | 3/50 | 5.0 | Exon 11: T568D |
| 2 | 28 | M | Stomach | 60 | Mixed type | + | + | − | − | 7/50 | 3.4 | Wild type |
| 3 | 75 | F | Stomach | 40 | Spindle type | + | + | − | − | 3/50 | 2.3 | Exon 11: V559A |
| 4 | 72 | M | Liver | 55 | Spindle type | + | + | + | − | 12/50 | 4.3 | Exon 11: W557_V560del |
| 5 | 65 | M | Liver | 28 | Mixed type | + | + | − | − | 19/50 | 20 | Exon 11: M552T,Y553_Q556del |
| 6† | 71 | F | Liver | 33 | Epithelioid type | + | + | − | − | 13/50 | 10 | Exon 11: 578–591 duplication |
| 7† | 73 | F | Liver | 20 | Epithelioid type | + | + | − | − | 12/50 | 25 | Exon 11: 578–591 duplication |
†Metachronous liver metastases of the same patient. F, female; GIST, gastrointestinal stromal tumor; LI, labeling index; M, male: +, positive; −, negative.
Figure 1.
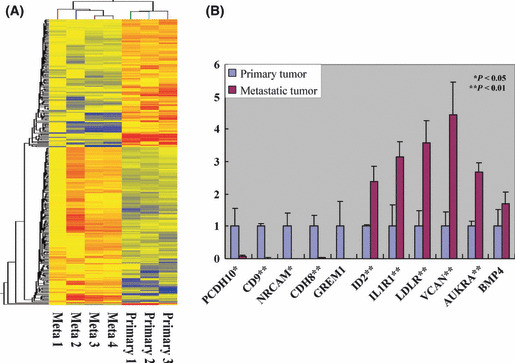
DNA microarray analysis of primary gastric and metastatic liver gastrointestinal stromal tumor (GIST). (A) Hierarchical clustering. Of 28 869 genes analyzed, 311 genes were differentially expressed between primary and metastatic liver GIST by at least twofold and with P values <0.05. (B) Quantitative RT‐PCR of 11 oncogenes and tumor suppressor genes screened by microarray analysis. mRNA levels of protocadherin 10 (PCDH10), CD9, neuronal cell adhesion molecule (NRCAM) and cadherin 8 (CDH8) had low expression, and inhibitor of DNA binding 2 (ID2), interleukin 1 receptor 1 (IL1R1), low‐density lipoprotein receptor (LDLR), versican (VCAN) and aurora kinase A (AURKA) had significantly high expression in metastatic liver GIST. GREM1, gremlin‐1; BMP4, bone morphogenetic protein 4.
Quantitative reverse transcription‐PCR. To confirm the microarray data, quantitative reverse transcription PCR (qRT‐PCR) was performed using cDNA synthesized from the RNA used in the microarray analysis. Of the 311 genes for which the expression differed between primary and metastatic GIST, we focused on 11 genes based on their loci and their oncogenic or tumor suppressive functions as reported in other malignancies. Of the 11 genes analyzed, the expression levels of five genes, inhibitor of DNA binding 2 (ID2), interleukin 1 receptor 1 (IL1R1), low density lipoprotein receptor (LDLR), versican (VCAN) and aurora kinase A (AURKA) were significantly higher, while four genes, protocadherin10 (PCDH10), CD9, neuronal cell adhesion molecule (NRCAM) and cadherin (CDH8) were lower in metastatic liver GIST (Fig. 1B).
Clinicopathological findings of 117 gastric GIST. Of the nine genes confirmed by qRT‐PCR to be upregulated or downregulated in metastatic liver GIST, we selected CD9 and versican for further study, because of their reported important roles in regulating tumor metastasis.( 28 , 29 , 30 ) The CD9 and versican proteins were stained immunohistochemically in 104 primary gastric GIST and 13 metastatic liver GIST originating from gastric GIST. While mitosis was significantly higher in metastatic liver GIST, there was no significant difference between primary and metastatic GIST that was related to the sex and age of the patient (Table 2). According to Miettinen’s risk classification for GIST,( 31 ) 11, 40, 11, 22 and 20 primary GIST were classified into none, very low risk, low‐risk, moderate‐risk and high‐risk groups, respectively. Immunohistochemical analysis revealed that the Ki‐67 labeling index was higher in metastatic liver GIST compared with primary gastric GIST. It is important to note that none of the patients had received imatinib before surgery as an adjuvant therapy.
Table 2.
Clinicopathological features of primary gastric GIST and metastatic liver GIST
| Factor | Primary GIST | Metastatic GIST | P‐value |
|---|---|---|---|
| Sex | |||
| Male | 56 | 6 | 0.5958 |
| Female | 48 | 7 | |
| Age (years) | |||
| ≦65 | 50 | 7 | 0.6803 |
| >65 | 54 | 6 | |
| Histology | |||
| Spindle | 82 | 7 | 0.0453* |
| Epithelioid/mixed | 22 | 6 | |
| Mitosis | |||
| ≦5/50 | 66 | 1 | 0.000143** |
| >5/50 | 38 | 12 | |
| Immunohistochemistry | |||
| KIT positive | 100 | 13 | 0.4982 |
| KIT negative | 4 | 0 | |
| SMA positive | 16 | 3 | 0.4720 |
| SMA negative | 88 | 10 | |
| Ki‐67 LI ≦5% | 78 | 2 | 0.00001** |
| Ki‐67 LI >5% | 26 | 11 | |
| VCAN ≦10% | 60 | 1 | 0.0006** |
| VCAN >10% | 44 | 12 | |
| CD9 positive | 51 | 4 | 0.1757 |
| CD9 negative | 53 | 9 | |
*P < 0.05. **P < 0.001. GIST, gastrointestinal stromal tumor; LI, labeling index; SMA, smooth muscle actin; VCAN, versican.
Immunohistochemistry of versican and CD9 in 117 gastric GIST. Versican in the extracellular matrix has been reported to recruit myeloid‐derived inflammatory cells and to enhance the metastatic potential of Lewis lung cell carcinoma.( 28 ) We stained 117 gastric GIST samples (104 primary and 13 metastatic liver GIST) for versican (Fig. S1) and measured positive dimensions in five or more randomly selected HPF (×200). Compared with primary gastric GIST, metastatic liver GIST had higher immunoreactivity to versican (P < 0.001, Table 2 and Fig. 2A). Among primary gastric GIST, the ratio of the versican‐positive area was significantly higher in high‐risk GIST compared with none, very low or low‐risk and moderate‐risk GIST. These findings suggest that versican plays an important role in the metastatic transformation of GIST and could be used as a prognostic marker of gastric GIST to predict the prognosis of patients with the tumors.
Figure 2.
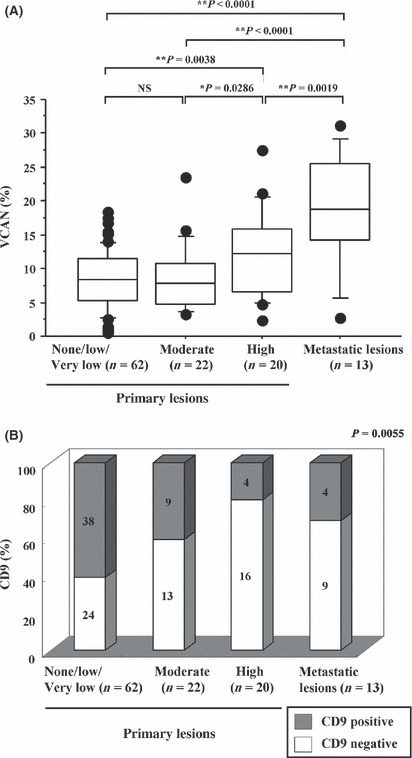
Immunohistochemistry for versican (VCAN) and CD9 in 117 gastric gastrointestinal stromal tumor (GIST). (A) Dimension of versican‐positive area in primary gastric and metastatic liver GIST. The versican‐positive dimension was measured in five or more random ×200 high‐power fields, and the mean dimension was calculated. Compared with primary GIST, metastatic GIST had a significantly higher ratio of versican‐positive area. Among primary gastric GIST, the ratio of versican‐positive area was significantly higher in high‐risk GIST compared with none, very low or low‐risk and moderate‐risk GIST. (B) Correlation between CD9 staining and risk classification of GIST. Staining intensity of CD9 was scored as negative (no staining or weak staining) or positive (moderate to strong staining). High‐risk GIST and metastatic GIST show relatively weaker immunoreactivity to CD9.
As the mRNA levels of CD9 between primary and metastatic liver GIST were the most significantly different of all the genes that we studied (Fig. 1B), we further analyzed CD9 protein levels by immunohistochemistry. We classified staining strength against CD9 into two groups: negative (no staining or weak staining); and positive (moderate to strong staining), as shown in Figure S2. Interestingly, high risk GIST and metastatic GIST showed relatively weak immunoreactivity to CD9 (Fig. 2B). These data suggest that downregulation of CD9 in primary GIST could be responsible for the tumor acquiring malignant potential, resulting in a high incidence of recurrent GIST in which CD9 is further suppressed.
Versican and CD9 expressions in primary gastric GIST and disease‐free survival. Of the 104 patients with gastric GIST, 16 recurred after primary resection during a median follow up of 16 months. The 5‐year disease‐free survival (DFS) rate for all the patients was 85.6%. To clarify the factors that might predict postoperative prognosis in patients with gastric GIST, the relationships between the clinicopathological findings of the primary GIST and patients’ DFS after surgery were evaluated using univariate analysis. Consistent with previous reports, large tumor size, high mitotic index and high‐risk classification were significantly associated with poor DFS (Table 3). In addition, patients with a versican‐positive dimension >10% (versican‐high) had significantly shorter DFS than patients with ≤10% (versican‐low) GIST (P = 0.0078, Table 3 and Fig. 3A). Furthermore, patients with a CD9‐positive tumor had significantly longer DFS compared with patients with CD9‐negative GIST (P = 0.0018, Table 3 and Fig. 3B). These data suggest that the expression of versican and CD9 in primary GIST may identify them as novel prognostic markers in patients with gastric GIST.
Table 3.
Relationship between clinicopathological factors and postoperative DFS in 104 gastric GIST patients
| Factor | Number | 5‐year DFS rate (%) | P‐value |
|---|---|---|---|
| Sex | |||
| Male | 56 | 82.6 | 0.8932 |
| Female | 48 | 79.9 | |
| Age (years) | |||
| ≤65 | 50 | 85.9 | 0.4658 |
| >65 | 54 | 75.7 | |
| Histology | |||
| Spindle | 82 | 81.0 | 0.8719 |
| Epithelioid/mixed | 22 | 81.5 | |
| Size (cm) | |||
| ≤2/>2 and ≤5 | 68 (10/58) | 92.7 | <0.0001** |
| >5 and ≤10 | 24 | 73.8 | |
| >10 | 12 | 36.5 | |
| Mitosis | |||
| ≤5/50 | 66 | 93.8 | 0.0001** |
| >5/50 | 38 | 60.0 | |
| Risk | |||
| None/very low/low | 62 (11/40/11) | 94.9 | <0.0001** |
| Moderate | 22 | 82.2 | |
| High | 20 | 39.0 | |
| Immunohistochemistry | |||
| KIT positive | 100 | 81.2 | 0.6621 |
| KIT negative | 4 | NA | |
| SMA positive | 16 | 85.2 | 0.7034 |
| SMA negative | 88 | 80.5 | |
| Ki‐67 LI ≤5% | 78 | 85.5 | 0.1883 |
| Ki‐67 LI >5% | 26 | 68.2 | |
| VCAN ≤10% | 60 | 90.3 | 0.0078* |
| VCAN >10% | 44 | 68.6 | |
| CD9 positive | 51 | 93.6 | 0.0018* |
| CD9 negative | 53 | 68.7 | |
*P < 0.01. **P < 0.001. DFS, disease‐free survival; GIST, gastrointestinal stromal tumor; LI, labeling index; NA, not applicable; SMA, smooth muscle actin; VCAN, versican.
Figure 3.
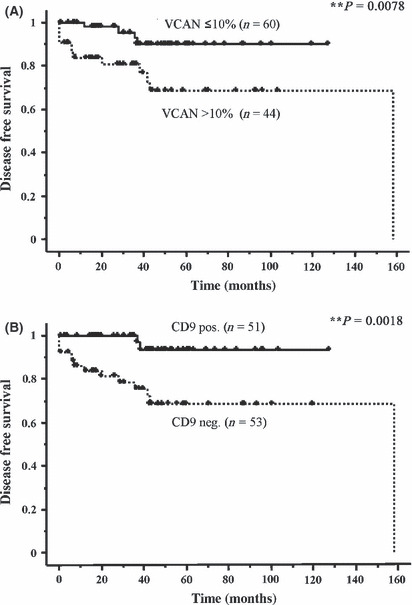
Versican (VCAN) and CD9 expressions in primary gastric gastrointestinal stromal tumor (GIST) and in patients’ prognosis. (A) Disease‐free survival (DFS) by versican positivity in primary gastric GIST. Patients with a versican‐positive dimension >10% had significantly shorter DFS than those with ≤10% GIST (P = 0.0078). (B) Disease‐free survival by CD9 positivity in the tumor. Patients with CD9‐positive tumors had significantly longer DFS compared with CD9‐negative GIST (P = 0.0018).
Versican and CD9 in intestinal GIST. We stained 36 intestinal GIST (29 primary and seven metastatic liver GIST) for versican and CD9. As shown in Table S4, the expression of CD9 but not of versican or other clinicopathological factors differed between primary and metastatic liver GIST. Interestingly, CD9 expression in primary intestinal GIST was not associated with patients’ DFS, while versican expression positively correlated with poor DFS (Table S5 and Fig. S3). These findings indicate that the expression pattern of CD9 and its roles in the metastatic process could be dependent on the primary site or tumor microenvironments.
Discussion
Risk classification of GIST on the basis of tumor size, tumor site and mitosis is the most valuable criteria for predicting outcome.( 31 , 32 ) However, it does not reflect the mechanism of acquiring GIST malignant potential. Until now, the genetic or epigenetic mechanisms underlying malignant change and the GIST metastatic process are not well understood. In the present study, we show for the first time differences in gene expression between primary gastric GIST and metastatic liver GIST using microarray.
Microarray analysis detected 165 upregulated and 146 downregulated genes in the metastatic process. According to gene ontology, protein binding, cellular organization, cell division and cell cycle are significantly different between primary and metastatic liver GIST (Table S3). Because the Ki‐67 labeling index has been widely used as a relevant marker of cell proliferation,( 17 ) we chose to focus on the cellular organization and biological process rather than on cell cycle.
We first selected cell adhesion molecules, downregulation of which is known to correlate with progression and metastasis in some malignancies.( 33 , 34 ) Neuronal cell adhesion molecule (NRCAM) is a member of the immunoglobulin super family and is involved in the pathogenesis and invasive/metastatic behavior of pancreatic cancers.( 34 ) PCDH10 and CDH8 belong to the cadherin super family.( 35 ) Among them, PCDH10 is a tumor suppressor gene located on chromosome 4q. It has been reported that in gastric and cervical cancers PCDH10 is silenced or downregulated due to hypermethylation.( 36 , 37 ) Furthermore, PCDH10 has been shown to inhibit cell proliferation, induce apoptosis and repress tumor invasion.( 36 ) The downregulation of PCDH10 in metastatic liver may partially explain how the loss of heterozygosity of the c‐kit gene or the loss of chromosome 4q was associated with liver metastasis of gastric GIST.( 20 , 21 ) We failed to stain for PCDH10 and so whether or not the PCDH10 protein is suppressed in metastatic liver GIST remains unelucidated. The qRT‐PCR analysis showed that mRNA expression of CD9 was most significantly suppressed in metastatic liver GIST. CD9 is a member of the tetraspanin family. Tetraspanin crosses the membrane four times and interacts with other tetraspanins and with a variety of transmembrane proteins, such as integrin.( 30 ) Tetraspanin is also known to be associated with some growth factors, and therefore takes part in a wide variety of cellular functions. Although converse functions were also reported in some tumors, downregulation of CD9 correlates with tumor progression or metastasis in bladder, breast, lung and colon cancers.( 30 ) In the present study, CD9 staining in gastric GIST was negatively correlated with the high‐risk grade and with poor DFS, suggesting that the cell‐adhesion molecule is downregulated during malignant transformation in gastric GIST, resulting in the high incidence of metastasis and recurrence. In contrast, CD9 expression in intestinal GIST was not associated with patients’ DFS. CD9 expression has been shown to differ in different organs( 30 ) indicating that the role of CD9 in the regulation of GIST metastasis may be organ dependent.
Next we selected prometastatic genes that were reported in other malignancies. Upregulation of ID2, AURKA and bone morphogenetic protein 4 (BMP4) promotes cell migration and correlates with tumor metastasis.( 38 , 39 , 40 , 41 , 42 ) Interleukin‐1 (IL‐1) has been shown to be produced by a variety of tumor cells leading to the induction of many genes, such as MMP, VEGF, bFGF and IL‐8, which play important roles in tumor metastasis.( 43 ) IL‐1R1 is a main signaling receptor for IL‐1. A family of LDLR is reported to promote cancer cell migration and invasion.( 44 ) The versican gene is located on chromosome 5q12 and the protein is a member of the extracellular matrix proteoglycan. Many studies have demonstrated that versican regulates many cellular processes including adhesion, proliferation, apoptosis, migration and invasion. Elevated levels of versican have been found in many malignancies, such as osteosarcoma, breast, prostate, colon, lung, pancreatic and other cancers.( 29 ) In addition, upregulation of versican correlates with poor prognosis. Recently, Kim et al. reported that versican activated macrophage through toll‐like receptor 2 (TLR2) and its co‐receptors TLR6 and CD14.( 28 ) Activation of TLR2 in macrophage results in induction and secretion of tumor necrosis factor (TNF)‐α and strongly enhances Lewis lung cell carcinoma metastasis.( 28 ) In the present study, upregulation of versican (>10%) in primary gastric GIST was associated with a high incidence of recurrence (Fig. 2B, P = 0.0078). However, it remains to be analyzed whether versican expressed in GIST cells activates macrophage to enhance liver metastasis via induction of TNF‐α.
To date, the propensity of GIST to acquire malignant potential has been investigated by several tools. In microsatellite analysis, deletion of Hox11L1 resulted in poor prognosis.( 45 ) Others showed that loss of heterozygosity of p16INK4A and the p14 alternate reading frame (ARF) may contribute to progression and/or malignant transformation of GIST.( 25 , 46 ) Yamaguchi et al. reported that microarray analysis in 32 primary GIST resulted in two major groups, and that the CD26 protein correlated with poor overall and disease‐free survival.( 47 ) By 2‐D difference gel electrophoresis, Suehara and coworkers showed that pfetin distinguished good and poor GIST outcomes, although its role in malignant transformation has not been elucidated.( 48 ) In most previous reports, primary GIST were utilized to reveal potential prognostic markers. In this study, we have identified differences between primary gastric and metastatic liver GIST using microarray. Our data may reflect the biological changes in the metastatic process of gastric GIST.
Although the activating mutation of the c‐kit gene is the main cause of GIST, a high incidence of small GIST, known as occult or incidental GIST, which carry a mutation in the c‐kit gene, have recently been reported by several groups.( 49 , 50 ) Therefore, it appears that the incidence of GIST is frequent and that substantial genetic changes other than in the c‐kit gene are necessary for the development of clinical GIST. As a part of such mechanisms, the loss of chromosome 14q and 22q has been reported in primary GIST.( 23 , 26 , 51 , 52 ) These chromosomal alterations seen in the early stage of GIST could be involved in the development of clinical GIST.
Taken together, there appears to be at least three steps in the development of metastatic GIST. First, the gain‐of‐function mutations in the c‐kit or PDGFRA gene occur in the interstitial cells of Cajal, resulting in the occurrence of small GIST as non‐clinical GIST or as small submucosal tumors. Second, epigenetic changes occur in the small GIST that include chromosomal alterations such as loss of 14q and 22q, and result in the development of clinical GIST that generally needs to be resected. Third, genetic or epigenetic changes occur in oncogenes and tumor suppressor genes that cause malignant transformation and metastasis of the GIST. In particular, alterations of the extracellular matrix, interactions with inflammatory cells and the downregulation of adhesion molecules, such as versican and CD9, appear to play important roles in the regulation of metastasis.
Genetic changes other than c‐kit or PDGFRA mutations may be responsible for GIST acquiring malignant potential. Until now, molecular targeted therapies for GIST have been designed for KIT receptors. However, these therapies against KIT are cytostatic and even though they responded to the initial therapy, GIST are known to relapse due to the acquisition of a second c‐kit mutation.( 11 , 12 , 13 , 14 ) Alternative therapies, other than targeting KIT, are required to overcome these second mutations. Cellular proteins such as CD26, pfetin and versican could be novel therapeutic targets. Clearly, further basic and clinical studies of these proteins are required.
In conclusion, genetic or epigenetic changes involved in the regulation of adhesion molecules, inflammatory cells and by default of tumor microenvironments play important roles in the metastatic process of gastric GIST. In particular, versican and CD9 could be potential prognostic markers of gastric GIST and may serve as novel therapeutic targets of GIST.
Disclosure Statement
The authors have no conflict of interest.
Supporting information
Fig. S1. Representative immunohistochemical staining for versican in gastric GIST.
Fig. S2. Representative immunohistochemical staining for CD9 in gastric GIST.
Fig. S3. Versican and CD9 expressions in primary intestinal GIST and in patients’ prognosis.
Table S1. RT‐PCR primers.
Table S2. Downregulated and upregulated genes in metastatic liver tumors.
Table S3. Gene ontology.
Table S4. Clinicopathological features of primary intestinal GIST and metastatic liver GIST.
Table S5. Relationship between clinicopathological factors and postoperative disease‐free survival in 29 intestinal GIST patients.
Supporting info item
Supporting info item
Acknowledgments
This work was supported in part by the Ministry of Education, Culture, Sports, Science, and Technology of Japan grants‐in‐aid 19790939 (T. Setoguchi), 22791270 (H. Kikuchi), 20670004 (M. Setou) and 21390376 (H. Konno) and Development of System and Technology for Advanced Measurement and Analysis (M. Setou). We thank Drs Takanori Sakaguchi, Shohachi Suzuki, Keigo Matsumoto, Yoshito Ikematsu, Toshikazu Kanai, Tsuyoshi Shoji, Takeshi Kaneko, Fumihiko Tanioka, Takachika Ozawa, Tsuyoshi Takahashi, Yoshitomo Yanagimoto, Toshirou Nishida and Hidemasa Bono for the tumor samples and for their advice.
References
- 1. Hirota S, Isozaki K, Moriyama Y et al. Gain‐of‐function mutations of c‐kit in human gastrointestinal stromal tumors. Science 1998; 279: 577–80. [DOI] [PubMed] [Google Scholar]
- 2. Lux ML, Rubin BP, Biase TL et al. KIT extracellular and kinase domain mutations in gastrointestinal stromal tumors. Am J Pathol 2000; 156: 791–5. [DOI] [PMC free article] [PubMed] [Google Scholar]
- 3. Rubin BP, Singer S, Tsao C et al. KIT activation is a ubiquitous feature of gastrointestinal stromal tumors. Cancer Res 2001; 61: 8118–21. [PubMed] [Google Scholar]
- 4. Hirota S, Nishida T, Isozaki K et al. Gain‐of‐function mutation at the extracellular domain of KIT in gastrointestinal stromal tumours. J Pathol 2001; 193: 505–10. [DOI] [PubMed] [Google Scholar]
- 5. Hirota S, Ohashi A, Nishida T et al. Gain‐of‐function mutations of platelet‐derived growth factor receptor alpha gene in gastrointestinal stromal tumors. Gastroenterology 2003; 125: 660–7. [DOI] [PubMed] [Google Scholar]
- 6. Heinrich MC, Corless CL, Duensing A et al. PDGFRA activating mutations in gastrointestinal stromal tumors. Science 2003; 299: 708–10. [DOI] [PubMed] [Google Scholar]
- 7. Buchdunger E, Cioffi CL, Law N et al. Abl protein‐tyrosine kinase inhibitor STI571 inhibits in vitro signal transduction mediated by c‐kit and platelet‐derived growth factor receptors. J Pharmacol Exp Ther 2000; 295: 139–45. [PubMed] [Google Scholar]
- 8. Joensuu H, Roberts PJ, Sarlomo‐Rikala M et al. Effect of the tyrosine kinase inhibitor STI571 in a patient with a metastatic gastrointestinal stromal tumor. N Engl J Med 2001; 344: 1052–6. [DOI] [PubMed] [Google Scholar]
- 9. van Oosterom AT, Judson I, Verweij J et al. Safety and efficacy of imatinib (STI571) in metastatic gastrointestinal stromal tumours: a phase I study. Lancet 2001; 358: 1421–3. [DOI] [PubMed] [Google Scholar]
- 10. Dematteo RP, Ballman KV, Antonescu CR et al. Adjuvant imatinib mesylate after resection of localised, primary gastrointestinal stromal tumour: a randomised, double‐blind, placebo‐controlled trial. Lancet 2009; 373: 1097–104. [DOI] [PMC free article] [PubMed] [Google Scholar]
- 11. Tamborini E, Bonadiman L, Greco A et al. A new mutation in the KIT ATP pocket causes acquired resistance to imatinib in a gastrointestinal stromal tumor patient. Gastroenterology 2004; 127: 294–9. [DOI] [PubMed] [Google Scholar]
- 12. Chen LL, Trent JC, Wu EF et al. A missense mutation in KIT kinase domain 1 correlates with imatinib resistance in gastrointestinal stromal tumors. Cancer Res 2004; 64: 5913–9. [DOI] [PubMed] [Google Scholar]
- 13. Debiec‐Rychter M, Cools J, Dumez H et al. Mechanisms of resistance to imatinib mesylate in gastrointestinal stromal tumors and activity of the PKC412 inhibitor against imatinib‐resistant mutants. Gastroenterology 2005; 128: 270–9. [DOI] [PubMed] [Google Scholar]
- 14. Antonescu CR, Besmer P, Guo T et al. Acquired resistance to imatinib in gastrointestinal stromal tumor occurs through secondary gene mutation. Clin Cancer Res 2005; 11: 4182–90. [DOI] [PubMed] [Google Scholar]
- 15. Taniguchi M, Nishida T, Hirota S et al. Effect of c‐kit mutation on prognosis of gastrointestinal stromal tumors. Cancer Res 1999; 59: 4297–300. [PubMed] [Google Scholar]
- 16. Antonescu CR, Sommer G, Sarran L et al. Association of KIT exon 9 mutations with nongastric primary site and aggressive behavior: KIT mutation analysis and clinical correlates of 120 gastrointestinal stromal tumors. Clin Cancer Res 2003; 9: 3329–37. [PubMed] [Google Scholar]
- 17. Miettinen M, El‐Rifai W, L HLS, Lasota J. Evaluation of malignancy and prognosis of gastrointestinal stromal tumors: a review. Hum Pathol 2002; 33: 478–83. [DOI] [PubMed] [Google Scholar]
- 18. DeMatteo RP, Lewis JJ, Leung D, Mudan SS, Woodruff JM, Brennan MF. Two hundred gastrointestinal stromal tumors: recurrence patterns and prognostic factors for survival. Ann Surg 2000; 231: 51–8. [DOI] [PMC free article] [PubMed] [Google Scholar]
- 19. Roberts PJ, Eisenberg B. Clinical presentation of gastrointestinal stromal tumors and treatment of operable disease. Eur J Cancer 2002; 38(Suppl 5): S37–8. [DOI] [PubMed] [Google Scholar]
- 20. Kikuchi H, Yamashita K, Kawabata T et al. Immunohistochemical and genetic features of gastric and metastatic liver gastrointestinal stromal tumors: sequential analyses. Cancer Sci 2006; 97: 127–32. [DOI] [PMC free article] [PubMed] [Google Scholar]
- 21. Kikuchi H, Yamamoto M, Hiramatsu Y et al. Effect of loss of heterozygosity of the c‐kit gene on prognosis after hepatectomy for metastatic liver gastrointestinal stromal tumors. Cancer Sci 2007; 98: 1734–9. [DOI] [PMC free article] [PubMed] [Google Scholar]
- 22. El‐Rifai W, Sarlomo‐Rikala M, Andersson LC, Knuutila S, Miettinen M. DNA sequence copy number changes in gastrointestinal stromal tumors: tumor progression and prognostic significance. Cancer Res 2000; 60: 3899–903. [PubMed] [Google Scholar]
- 23. Fukasawa T, Chong JM, Sakurai S et al. Allelic loss of 14q and 22q, NF2 mutation, and genetic instability occur independently of c‐kit mutation in gastrointestinal stromal tumor. Jpn J Cancer Res 2000; 91: 1241–9. [DOI] [PMC free article] [PubMed] [Google Scholar]
- 24. Chen Y, Liou CP, Tseng HH, Jan YJ, Li CF, Tzeng CC. Deletions of chromosome 1p and 15q are associated with aggressiveness of gastrointestinal stromal tumors. J Formos Med Assoc 2009; 108: 28–37. [DOI] [PubMed] [Google Scholar]
- 25. Yang J, Du X, Lazar AJ et al. Genetic aberrations of gastrointestinal stromal tumors. Cancer 2008; 113: 1532–43. [DOI] [PMC free article] [PubMed] [Google Scholar]
- 26. Wozniak A, Sciot R, Guillou L et al. Array CGH analysis in primary gastrointestinal stromal tumors: cytogenetic profile correlates with anatomic site and tumor aggressiveness, irrespective of mutational status. Genes Chromosom Cancer 2007; 46: 261–76. [DOI] [PubMed] [Google Scholar]
- 27. Gunawan B, von Heydebreck A, Sander B et al. An oncogenetic tree model in gastrointestinal stromal tumours (GISTs) identifies different pathways of cytogenetic evolution with prognostic implications. J Pathol 2007; 211: 463–70. [DOI] [PubMed] [Google Scholar]
- 28. Kim S, Takahashi H, Lin WW et al. Carcinoma‐produced factors activate myeloid cells through TLR2 to stimulate metastasis. Nature 2009; 457: 102–6. [DOI] [PMC free article] [PubMed] [Google Scholar]
- 29. Ricciardelli C, Sakko AJ, Ween MP, Russell DL, Horsfall DJ. The biological role and regulation of versican levels in cancer. Cancer Metastasis Rev 2009; 28: 233–45. [DOI] [PubMed] [Google Scholar]
- 30. Zoller M. Tetraspanins: push and pull in suppressing and promoting metastasis. Nat Rev Cancer 2009; 9: 40–55. [DOI] [PubMed] [Google Scholar]
- 31. Miettinen M, Lasota J. Gastrointestinal stromal tumors: pathology and prognosis at different sites. Semin Diagn Pathol 2006; 23: 70–83. [DOI] [PubMed] [Google Scholar]
- 32. Fletcher CD, Berman JJ, Corless C et al. Diagnosis of gastrointestinal stromal tumors: a consensus approach. Int J Surg Pathol 2002; 10: 81–9. [DOI] [PubMed] [Google Scholar]
- 33. Berx G, van Roy F. Involvement of members of cadherin superfamily in cancer. Cold Spring Harb Perspect Biol 2009; 1: 1–27. [DOI] [PMC free article] [PubMed] [Google Scholar]
- 34. Dhodapkar KM, Friedlander D, Scholes J et al. Differential expression of the cell‐adhesion molecule Nr‐CAM in hyperplastic and neoplastic human pancreatic tissue. Hum Pathol 2001; 32: 396–400. [DOI] [PubMed] [Google Scholar]
- 35. Nollet F, Kools P, van Roy F. Phylogenetic analysis of the cadherin superfamily allows identification of six major subfamilies besides several solitary members. J Mol Biol 2000; 299: 551–72. [DOI] [PubMed] [Google Scholar]
- 36. Yu J, Cheng YY, Tao Q et al. Methylation of protocadherin 10, a novel tumor suppressor, is associated with poor prognosis in patients with gastric cancer. Gastroenterology 2009; 136: 640–51 e1. [DOI] [PubMed] [Google Scholar]
- 37. Narayan G, Scotto L, Neelakantan V et al. Protocadherin PCDH10, involved in tumor progression, is a frequent and early target of promoter hypermethylation in cervical cancer. Genes Chromosom Cancer 2009; 48: 983–92. [DOI] [PMC free article] [PubMed] [Google Scholar]
- 38. Tong T, Zhong Y, Kong J et al. Overexpression of Aurora‐A contributes to malignant development of human esophageal squamous cell carcinoma. Clin Cancer Res 2004; 10: 7304–10. [DOI] [PubMed] [Google Scholar]
- 39. Reiter R, Gais P, Jütting U et al. Aurora kinase A messenger RNA overexpression is correlated with tumor progression and shortened survival in head and neck squamous cell carcinoma. Clin Cancer Res 2006; 12: 5136–41. [DOI] [PubMed] [Google Scholar]
- 40. Coma S, Amin DN, Shimizu A et al. Id2 promotes tumor cell migration and invasion through transcriptional repression of semaphoring 3F. Cancer Res 2010; 70: 3823–32. [DOI] [PMC free article] [PubMed] [Google Scholar]
- 41. Rothhammer T, Poser I, Soncin F et al. Bone morphogenetic proteins are overexpressed in malignant melanoma and promote cell invasion and migration. Cancer Res 2005; 65: 448–56. [PubMed] [Google Scholar]
- 42. Deng H, Makizumi R, Ravikumar TS et al. Bone morphogenetic protein‐4 is overexpressed in colonic adenocarcinoma and promotes migration and invasion of HCT116 cells. Exp Cell Res 2007; 313: 1033–44. [DOI] [PubMed] [Google Scholar]
- 43. Apte RN, Dotan S, Elkabets M et al. The involvement of IL‐1 in tumorigenesis, tumor invasiveness, metastasis and tumor‐host interactions. Cancer Metastasis Rev 2006; 25: 387–408. [DOI] [PubMed] [Google Scholar]
- 44. Song H, Li Y, Lee J et al. Low‐density lipoprotein receptor‐related protein 1 promotes cancer cell migration and invasion by inducing the expression of matrix metalloproteinases 2 and 9. Cancer Res 2009; 69: 879–86. [DOI] [PMC free article] [PubMed] [Google Scholar]
- 45. Kaifi JT, Wagner M, Schurr PG et al. Allelic loss of Hox11L1 gene locus predicts outcome of gastrointestinal stromal tumors. Oncol Rep 2006; 16: 915–9. [PubMed] [Google Scholar]
- 46. Sabah M, Cummins R, Leader M, Kay E. Loss of heterozygosity of chromosome 9p and loss of p16INK4A expression are associated with malignant gastrointestinal stromal tumors. Mod Pathol 2004; 17: 1364–71. [DOI] [PubMed] [Google Scholar]
- 47. Yamaguchi U, Nakayama R, Honda K et al. Distinct gene expression‐defined classes of gastrointestinal stromal tumor. J Clin Oncol 2008; 26: 4100–8. [DOI] [PubMed] [Google Scholar]
- 48. Suehara Y, Kondo T, Seki K et al. Pfetin as a prognostic biomarker of gastrointestinal stromal tumors revealed by proteomics. Clin Cancer Res 2008; 14: 1707–17. [DOI] [PubMed] [Google Scholar]
- 49. Kawanowa K, Sakuma Y, Sakurai S et al. High incidence of microscopic gastrointestinal stromal tumors in the stomach. Hum Pathol 2006; 37: 1527–35. [DOI] [PubMed] [Google Scholar]
- 50. Agaimy A, Wunsch PH, Hofstaedter F et al. Minute gastric sclerosing stromal tumors (GIST tumorlets) are common in adults and frequently show c‐KIT mutations. Am J Surg Pathol 2007; 31: 113–20. [DOI] [PubMed] [Google Scholar]
- 51. Chen Y, Tzeng CC, Liou CP, Chang MY, Li CF, Lin CN. Biological significance of chromosomal imbalance aberrations in gastrointestinal stromal tumors. J Biomed Sci 2004; 11: 65–71. [DOI] [PubMed] [Google Scholar]
- 52. Assamaki R, Sarlomo‐Rikala M, Lopez‐Guerrero JA et al. Array comparative genomic hybridization analysis of chromosomal imbalances and their target genes in gastrointestinal stromal tumors. Genes Chromosom Cancer 2007; 46: 564–76. [DOI] [PubMed] [Google Scholar]
Associated Data
This section collects any data citations, data availability statements, or supplementary materials included in this article.
Supplementary Materials
Fig. S1. Representative immunohistochemical staining for versican in gastric GIST.
Fig. S2. Representative immunohistochemical staining for CD9 in gastric GIST.
Fig. S3. Versican and CD9 expressions in primary intestinal GIST and in patients’ prognosis.
Table S1. RT‐PCR primers.
Table S2. Downregulated and upregulated genes in metastatic liver tumors.
Table S3. Gene ontology.
Table S4. Clinicopathological features of primary intestinal GIST and metastatic liver GIST.
Table S5. Relationship between clinicopathological factors and postoperative disease‐free survival in 29 intestinal GIST patients.
Supporting info item
Supporting info item