

Abstract
Tumors have been known to contain a small population of cancer stem cells that initiate tumor growth and promote tumor spreading. CD133 alone or in combination with other markers is currently being used for identification and isolation of the putative cancer stem cell population from malignant tumors. To determine whether the CD133+ cells constitute the stem cell populations of lung cancer cells A549 and H446, CD133+ and CD133− subpopulations were sorted from A549 and H446 cells by magnetic cell separation and characterized for their in vitro stem cell‐like properties. Interestingly, both the CD133+ and CD133− cells displayed similar abilities of colony formation, self‐renewal, proliferation, differentiation, and invasion, as well as resistance to chemotherapy drugs. Furthermore, colony formation assays showed that more than 40% of cells in both the CD133+ cells and CD133− subpopulations could form large colonies capable of regenerating the unsorted populations and forming tumors in nude mice. These results suggest that CD133 alone cannot be used as a stem cell marker for the lung cancer cells A549 and H446, and both the CD133+ and CD133− subpopulations contain similar numbers of cancer stem cells. (Cancer Sci 2009; 100: 1040–1046)
CD133 is a member of the transmembrane glycoprotein family and was initially described as a surface antigen specific for human hematopoietic stem cells.( 1 , 2 ) Although its biological function remains largely unknown, CD133 has been recognized as a stem cell marker for cancerous tissues. Indeed, CD133 alone or in combination with other markers is currently used for identification and isolation of the putative cancer stem cell population from malignant tumors, as well as cell lines of brain,( 3 , 4 ) prostate,( 5 ) liver,( 6 , 7 ) pancreas,( 8 ) colon( 9 , 10 ) and melanoma.( 11 )
In a recent report, CD133 was also used to isolate cancer stem cells from lung cancer.( 12 ) The lung cancer CD133+ subpopulation was able to grow indefinitely as tumor spheres in serum‐free medium containing epidermal growth factor (EGF) and basic fibroblast growth factor (bFGF). When injected into immunocompromised mice, they readily generated xenograft tumor phenotypically identical to the tumor derived from the original unsorted cancer cells. Upon differentiation, lung cancer CD133+ cells acquired the specific lineage markers, while losing the tumorigenic potential together with the CD133 expression.( 12 )
However, in one recent study on different in vitro phenotypes of primary glioblastomas, although most primary cells grown as tumor spheres were driven by CD133+ cells, four of the 15 cell lines grown adherently were driven by stem cell‐like CD133− tumor cells( 13 ) and both the CD133+ and CD133− tumor cells from these cells were similarly tumorigenic in nude mice in vivo.( 13 ) It was also reported that both CD133+ and CD133− metastatic colon tumor subpopulations formed colonospheres in cultures and were capable of long‐term tumorigenesis in a NOD/SCID serial xenotransplantation model.( 14 ) Furthermore, both CD133+ and CD133− cells displayed similar frequencies of stem cell‐like properties in DAOY medulloblastoma cell line.( 15 ) Given the contradiction regarding the role of CD133 as a true cancer stem cell marker, we investigated whether the CD133+ subpopulations of a non‐small cell lung cancer A549 cell line and a small lung cancer H446 cell line characteristically resemble the cancer stem cells more closely than the CD133− subpopulations.
Materials and Methods
Cell culture. Human lung cancer cell lines A549 and H446 were cultured in RPMI‐1640 (HyClone, Logan, UT, USA) and 10% fetal bovine serum (Tian Jin Hao Yang Biological Manufacture, Tian Jin, China) in a tissue culture incubator at 37°C under 5% CO2 and 100% humidity.
Magnetic cell separation and fluorescence‐activated cell sorting (FACS). Cells were harvested by 0.25% trypsin (Gibco, LA, USA) in the logarithmic phase of growth and centrifuged at 300 × g. for 5 min. The cells were resuspended in 100 µL buffer (phosphate‐buffered saline [PBS], pH 7.2, 0.5% bovine serum albumin, 2 mM ethylenediaminetetraacetic acid). Single cells were magnetically labeled with anti‐CD133 MicroBeads (Miltenyi Biotec, Bergisch Gladbach, Germany) in the dark at 4°C for 30 min and applied to the prepared MS Column (Miltenyi Biotec). CD133− cells were collected in the flow‐through of the column; CD133+ cells bound to the beads were flushed out by applying the plunger supplied with the column. The percentage of CD133 expressing cells in the original cell populations, the flow‐through, and the flushed‐out fractions were analyzed by FACS with phycoerythrin‐conjugated anti‐CD133 (Miltenyi Biotec). Cells were stained at the concentration of 1 × 10⁶ cells per 90 µL buffer and 10 µL antibody at 4°C for 25 min before FACS analysis.
Colony formation, long‐term cultures, and tumorigenicity assay. To determine the clonogenicity and regeneration ability of single cells, colony formation assay was carried out as described previously( 16 ) with some modifications. CD133+ and CD133− cells of A549 and H446 were resuspended in fresh medium (RPMI‐1640 with 10% FBS), diluted to 10 cells/mL, and seeded at approximately 1 cell/well with 100 µL medium into 96‐well plates. Wells containing no cells or more than one cell were excluded after careful microscopic examinations, and those with single cells were marked and monitored daily under a microscope. After 1 week of culture, the colonies were counted, dissociated, harvested, diluted, and cultured for another round of subcloning in new 96‐well plates (1 cell/well), similar to the first round of cloning. Big colonies (>100 cells) were expanded until the cell number reached 106, then the expanded cells were harvested and injected into the left axillary fossa of 4‐week‐old female BALB/C nude mice (Shanghai SLAC Laboratory Animal Company, Shanghai, China). The mice were examined for tumor growth visually every 2 days after implantation.
Immunohistochemistry on tumor sections and cultured tumor cells. Xenograft tumor tissues generated from both CD133+ and CD133− cells were embedded in paraffin and sectioned based on the standard histology procedure. Paraffin‐embedded tissue sections were deparaffinized in xylene and rehydrated through a gradient of alcohol solutions. Antigen retrieval was carried out in sodium citrate buffer (pH 6.0) at 95–98°C for 10 min. Cultured CD133+ and CD133− cells were fixed with 4% paraformaldehyde for 30 min. Then both tumor sections and cultured cells were washed with PBS for 15 min and treated with 0.3% hydrogen peroxide for 10 min to block the endogenous peroxidases. After they were incubated in a blocking solution containing goat serum at 37°C for 30 min, tissue sections and cultured cells were incubated separately with each of the following antibodies: rabbit anti‐CD133 (Abcam, Cambridge, UK), mouse anti‐cytokeratin 7 (CK7), mouse anti‐thyroid transcription factor‐1 (TTF‐1), rabbit anti‐synaptophysin (Syn) and rabbit anti‐chromogranin A (CgA) (Beijing ZhongShan Golden Bridge Biotechnology, Beijing, China) in the blocking buffer overnight at 4°C. After washing with PBS, a horseradish peroxidase‐conjugated secondary antibody specific to the first antibody was applied to the sections or fixed cells, and incubated for 30 min at 37°C. Finally, samples were soaked in horseradish peroxidase substrate buffer for 10 min, followed by color development with 3,3′‐diaminobenzidine‐tetrachloride solution until a brown color appeared, at which time they were washed with deionized water, counterstained with hematoxylin, and mounted for microscope imaging.
Tumor sphere formation analysis. CD133+ and CD133− A549 cells were washed with RPMI‐1640 and resuspended in fresh medium containing 20 ng/mL EGF (Peprotech, Rocky Hill, NJ, USA) and 10 ng/mL bFGF (Peprotech). They were incubated in the tissue culture incubator and observed under a microscope every day until tumor spheres formed. At that time, FBS was added to the medium to a final concentration of 10% to determine if tumor spheres could adhere to the flasks.
Cell proliferation assay. 3‐[4,5‐Dimethylthiazol‐2‐yl]‐2,5‐diphenyltetrazolium bromide (MTT) proliferation assay was used to determine the growth curves of CD133+ and CD133− cells of A549 and H446. The cells were resuspended in fresh medium, diluted to 1.25 × 10⁴ cells/mL, and seeded into seven 96‐well plates at 200 µL per well. Cells were grown for up to 7 days and one plate was used for MTT assay each day for a total of 7 days. Twenty microliters of MTT (5 mg/mL; Sigma, St. Louis, MO, USA) was added to each well, and the cells were incubated at 37°C for another 4 h. Then the culture medium was replaced with 150 µL dimethylsulfoxide (Sigma). After shaking for 10 min, the plate was read for the absorbance at 490 nm on a plate reader. Growth curves were obtained by plotting the absorbance values over time.
Drug sensitivity assay. CD133+ and CD133− cells of A549 and H446 were resuspended in fresh RPMI‐1640 with 10% FBS, diluted to 1.5 × 10⁴ cells/mL, and seeded into 96‐well plates with 200 µL per well. After 24 h of recovery, cells were treated with each of the four chemotherapeutic drugs (paclitaxel, gemcitabine, etoposide, and cisplatin) at their respective IC50 concentration for 72 h, and assayed for cell viability by MTT assay. Untreated cells were assayed similarly to obtain the value of the control as 100% viability. Drug resistance was represented as the percentage of the number of live cells surviving after drug treatment relative to the number of control cells, calculated by the formula:
Drug resistance (100%) = (absorbance of treated cells)/(absorbance of untreated cells) × 100%.
Invasion assay. Invasiveness of CD133+ and CD133− cells was determined using six‐well transwell Matrigel chambers (BD Company, NJ, USA). Matrigel (Sigma) was diluted 1:3 with serum‐free RPMI‐1640. Transwell chambers were placed into a six‐well plate and 200 µL diluted Matrigel solution was added onto the transwell membrane. Then the plate with transwell chambers was incubated at 37°C for 30 min until the matrix‐like gel formed. Cells were seeded on top of the Matrigel at 1 × 10⁵ per chamber in serum‐free RPMI‐1640. Outside the chambers, the wells were filled with RPMI‐1640 with 10% FBS as the chemoattractant. Cells were incubated at 37°C with 5% carbon dioxide for 24 h, then the Matrigel with the non‐invading cells remained were removed gently with a cotton swab. Cells invaded across the membrane were stained with hematoxylin for 15 min, washed for 15 min, and counted under a microscope at 40× objective for 10 visual fields from each cell sample.
Results
FACS analysis of CD133 expression of A549 and H446 cells before and after sorting. The single cell suspensions were separated into CD133+ and CD133− cells by magnetic cell separation and analyzed by flow cytometry for CD133 expression. The fractions of CD133 expressing cells in A549 and H446 cells were 0.98% and 1.00%, respectively, before the sorting, and 90.5% respectively, in the CD133+ fractions and 0.12%, in the CD133− fractions after the sorting. These results indicate a good enrichment of CD133 subpopulations by the magnetic cell separation (Fig. 1).
Figure 1.

Fluorescence‐activated cell sorting analysis of CD133 expression in lung cancer cell lines A549 and H446. (a) CD133 was expressed in 0.98% of the unsorted A549 cells; (b) CD133 was expressed in 1.00% of unsorted H446 cells; (c) cells expressing CD133 constituted 90.5% of the CD133+ subpopulation after sorting; (d) cells expressing CD133 constituted only 0.12% of the CD133− subpopulation after sorting; (e) cells expressing CD133 constituted 1.02% of the population regenerated from A549 CD133+ cells; (f) cells expressing CD133 made up 1.08% in the population regenerated from A549 CD133− cells; (g) cells expressing CD133 made up 1.02% of the population regenerated from H446 CD133+ cells; (h) cells expressing CD133 made up 0.97% in the population regenerated from H446 CD133− cells.
CD133+ and CD133− cells each regenerated both CD133+ and CD133− cells. To compare the repopulation ability of CD133+ cells with that of CD133− cells, we cultured the sorted CD133+ cells and CD133− cells separately under the same culture conditions. Both CD133+ cells and CD133− cells could be cultured for at least five passages. Both CD133+ and CD133− populations of A549 and H446 regenerated new populations with percentages of CD133 expression similar to the original cells before sorting (1, 2). Moreover, cell populations regenerated by CD133+ and CD133− A549 cells expressed CK7 at a high level and TTF‐1 at a low level, differentiation markers for lung adenocarcinoma. Cell populations regulated by CD133+ and CD133− H446 cells expressed CgA at a high level and Syn at a low level, two differentiation markers for neuroendocrine tumors (Fig. 2).
Figure 2.
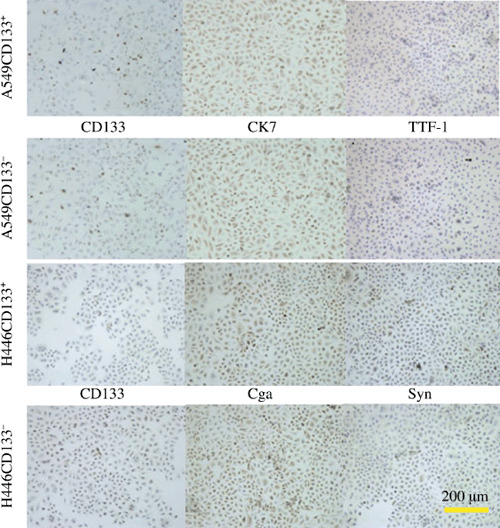
Immunohistochemistry of cultured A549 and H446 lung cancer cells. The cells generated from both CD133+ and CD133− cells of A549 expressed CD133 at quite a low level at the cell membrane, mouse anti‐cytokeratin 7 (CK7) at a high level at the cell cytoplasm, and mouse anti‐thyroid transcription factor‐1 (TTF‐1) at a low level at the cell nucleus. The cells generated by large colonies from CD133+ and CD133− cells of H446 expressed CD133 at quite a low level at the cell membrane, rabbit anti‐chromogranin A (CgA) at a high level at the cytoplasm, and rabbit anti‐synaptophysin (Syn) at a low level at the cytoplasm.
Colony formation and tumorigenicity of CD133+ and CD133− cells. Both CD133+ and CD133− single cells formed three kinds of colonies in the serum‐containing medium in 1 week, that is, large colonies (L) containing more than 100 cells, median colonies (M) containing approximately 50–100 cells, and small colonies (S) containing less than 50 cells. The cells in large colonies were homogeneous in cell morphology and highly proliferative. The cells in the small colonies seemed fragmented and undergoing apoptosis, and the viable cells appeared less healthy than the cells in the large colonies (Fig. 3). Percentages of the large, median, and small colonies formed from different cell subpopulations, A549CD133± or H446CD133±, are shown in Table 1.
Figure 3.

Three kinds of colonies formed by CD133+ and CD133− subpopulations of A549(100×) and H446(200×) lung cancer cells. The cells in the large colonies (L) were homogeneous in cell morphology and highly proliferative. The cells in the small colonies (S) seemed fragmented and undergoing apoptosis, and the viable cells appeared less healthy than the cells in the large colonies. M, median colonies.
Table 1.
Percentages of colonies of three sizes, large (L), median (M), or small (S), formed from different cell subpopulations, A549CD133± or H446CD133±, as indicated
| Subpopulations | L (>100 cells) | M (50–100 cells) | S (<100 cells) |
|---|---|---|---|
| A549 CD133+ | 44.00% ± 1.93% | 24.70% ± 4.75% | 31.30% ± 4.92% |
| A549 CD133− | 43.80% ± 0.80% | 23.60% ± 2.00% | 32.60% ± 1.00% |
| H446 CD133+ | 45.93% ± 0.68% | 25.60% ± 2.60% | 30.30% ± 2.40% |
| H446 CD133− | 46.17% ± 2.44% | 27.57% ± 1.27% | 26.23% ± 3.71% |
After being dissociated and cultured as single cells in new 96‐well plates (1 cell/well), the cells from the small colonies did not form new colonies, instead they underwent apoptosis in the second generation. The cells from the median colonies formed a few colonies of median size in the first generation and formed mostly small ones in the second generation; they underwent apoptosis and formed a few small colonies in the third generation; all the cells underwent apoptosis in the fourth generation and could not be recovered. The cells from the large colonies formed all the three kinds of colonies; the percentage of large colonies was a little higher in the first generation and maintained in the other generations.
Overall, the cells that can form large colonies accounted for 44.00% ± 1.93% of CD133+ and 43.80% ± 0.80% of CD133− A549 cells, and 45.93% ± 0.68% of CD133+ and 46.17% ± 2.44% of CD133− H446 cells (Table 1). These cells had the ability to regenerate the entire original cell population. In vivo xenografts also showed that cells expanded from such big colonies formed tumors in nude mice in 10 days (Fig. 4). There were no significant differences in the tumor sizes formed from the CD133+ and CD133− A549 cells (P > 0.05), or those from the CD133+ and CD133− H446 cells (P > 0.05). Furthermore, both tumors generated from big colonies of the CD133+ and CD133− A549 and H446 cells similarly expressed CD133 (Fig. 5). Moreover, tumors generated from CD133+ and CD133− A549 cells expressed CK7 at a high level and TTF‐1 at a low level, two differentiation markers for lung adenocarcinoma; tumors generated from CD133+ and CD133− H446 cells expressed CgA at a high level and Syn at a low level, two differentiation markers for neuroendocrine tumors (Fig. 5).
Figure 4.

A representative tumor formed in nude mouse from implanted cells isolated from a large colony formed by CD133+ and CD133− subpopulations of A549 and H446 lung cancer cells. (a) Photograph of a nude mouse with the tumor formed by the cells from a large colony; (b) cells dissected from the tumor (11 × 7 × 6 mm in size) in the same mouse.
Figure 5.

Immunohistochemistry of tumor cells formed by CD133+ and CD133− subpopulations of A549 and H446 lung cancer cells. The tumor cells generated by a large colony from both CD133+ and CD133− cells of A549 expressed CD133 at quite a low level at the cell membrane, mouse anti‐cytokeratin 7 (CK7) at a high level at the cell cytoplasm, and mouse anti‐thyroid transcription factor‐1 (TTF‐1) at a low level at the cell nucleus. The cells generated by a large colony both from CD133+ and CD133− cells of H446 expressed CD133 at quite a low level at the cell membrane, rabbit anti‐chromogranin A (CgA) at a high level at the cytoplasm, and rabbit anti‐synaptophysin (Syn) at a low level at the cytoplasm.
Tumor sphere formation. Both the CD133+ and CD133− A549 cells sustained cell proliferation in serum‐free RPMI‐1640 supplemented with 20 ng/mL EGF and 10 ng/mL bFGF. Observed under a microscope every day, both CD133+ and CD133− cells formed tumor spheres in this medium (Fig. 6), and the tumor spheres attached to the flasks on addition of 10% FBS and proliferated.
Figure 6.

Microscopic images of tumor spheres (200×) in serum‐free RPMI‐1640. (a) Tumor spheres formed by CD133+ cells from A549 lung cancer cells; (b) tumor spheres formed by CD133− cells isolated from A549 cells.
Cell proliferation. CD133+ and CD133− cells of A549 and H446 were seeded in 96‐well plates at the same density. MTT assays showed that, over a 7‐day period, both cells proliferated at similar rates, as evidenced by their growth curves of similar shapes (Fig. 7).
Figure 7.

The growth curves of CD133+ and CD133− cells of A549 and H446 lung cancer cells. Although H446 cells grew slightly faster than A549 cells, there was no difference in the growth rates between the CD133+ and CD133− cells of A549 or H446.
CD133+ and CD133− cells were similarly resistant to chemotherapeutic drugs. Drug resistance is a common characteristic of cancer stem cells. We tested whether the CD133− and CD133+ cells were different in the resistance to several drugs commonly used in lung cancer chemotherapy: gemcitabine, paclitaxel, etoposide, and cisplatin. After treatment with each of the four chemotherapeutic drugs at their respective IC50 levels, both CD133+ and CD133− cells of two cell lines showed similar degrees of resistance to all the drugs (Fig. 8).
Figure 8.

Percentages of CD133+ and CD133− cells of A549 and H446 lung cancer cells surviving after treatment by indicated drugs at their IC50 concentrations. The IC50 of gemcitabine for A549 and H446 cells is 30 µg/mL and 4 µg/mL, respectively; the IC50 of paclitaxel for A549 and H446 cells is 4 µg/mL and 0.2 µg/mL, respectively; the IC50 of etoposide for A549 and H446 cells is 10 µg/mL and 0.4 µg/mL, respectively; and the IC50 of cisplatin for A549 and H446 is 2 µg/mL and 0.15 µg/mL, respectively.
CD133+ and CD133− cells displayed similar in vitro invasiveness. To investigate possible difference in invasiveness between CD133+ and CD133− cells, an in vitro Matrigel invasion assay was carried out on sorted A549 and H446 cells. The average numbers of invaded cells across the membranes were 10.4 ± 2.17 and 10.57 ± 1.65 (P > 0.05), for CD133+ and CD133− A549 cells, respectively, whereas those of CD133+ and CD133− H446 cells were 11.70 ± 0.70 and 11.18 ± 0.41 (P > 0.05), respectively. Both A549 and H446 cells did not show significant differences in their in vitro invasiveness between the CD133+ and CD133− subpopulations.
Discussion
Cancer stem cells are multipotent cells capable of self‐renewal and differentiation to other cell types.( 17 ) In particular, cancer stem cells are believed to be more tumorigenic than the bulk of other cancer cells. They have been suggested as a distinct population to cause relapse and metastasis by giving rise to new tumors; therefore, identification and characterization of such cancer‐specific stem cells could offer new therapeutic strategies against metastatic tumors.
Despite the current practice of using CD133 as one of the cancer stem cell markers, our results showed that both CD133+ and CD133− subpopulations of A549 and H446 cells could form similar numbers of big colonies that were able to self‐renew and be maintained in culture for at least five passages. Both CD133+ cells and CD133− cells could equally regenerate the original unsorted populations containing both CD133 positive and negative cells and express lineage‐specific differentiation markers. Their growth curves also showed similar rates of proliferation.
Similar to glioblastoma stem cells,( 18 , 19 ) lung cancer stem cells have been indicated to be resistant to chemotherapeutic drugs.( 12 ) Among four drugs (gemcitabine, paclitaxel, etoposide and cisplatin), although the IC50 values of each drug are different between A549 and H446 cells, both CD133+ and CD133− cells of each cell line showed the same degrees of resistance to all the drugs.
The ultimate test of tumorigenicity is transplantation in vivo, but we did not find compelling evidence for any differences between the CD133+ and CD133− derived cultures of A549 and H446 in their in vivo tumorigenesis or their in vitro invasiveness. Indeed, both CD133+ and CD133− cells were invasive in Matrigel( 20 ) and survived in suspension culture as tumor spheres at similar clonal densities.
These results indicate that both CD133+ and CD133− cells contain equal numbers of cancer stem cells, at least in our two lung cancer cell lines. A recent report showed that only CD133+ cells serve as a tumorigenic population in lung cancer tissue. Although it is not clear why our findings are not consistent with the previously published data,( 12 ) a possible explanation is that there are differences between lung cancer tissue and cell lines. The A549 and H446 lung cancer cell lines have been used widely for decades and cultured in vitro for thousands of passages, but their tumorigenicity remains quite stable. Both cell lines are immortal and proliferate quite rapidly with the doubling time less than 24 h. Cell losses are rarely found in cultures of these cells unless they have been contaminated or treated. Therefore, the numbers of proliferating cells in the immortalized cell lines are much bigger than that of the dormant cells in vivo. Due to this reason, most cells of A549 and H446 possess the regeneration capacity. But the cells freshly isolated from lung tissues proliferate much slower and sometimes they even stop differentiating and proliferating after a short period in culture. It is highly possible that the cells immortalized in culture were selectively derived from the rare population of cancer stem cells in the lung tissues. As a result, the cell lines contain much more stem cells than the lung cancer tissues do. In our study, more than 40% of cells in both the CD133+ and CD133− subpopulations were highly tumorigenic and were therefore likely to be stem cells. This fraction of stem cells is indeed significantly higher than what has been reported (approximately 0.32–22%).( 12 ) For example, in solid tumors, only a small proportion of the tumor cells are able to form colonies in an in vitro colonogenic assay.( 21 , 22 ) It has been indicated that a small population of cancer stem cells could form a greater number of big colonies than non‐stem cells could.( 5 , 23 )
Together, we showed here that CD133 cannot be used as the cancer stem cell markers for the two lung cancer cell lines A549 and H446. Both CD133 positive and negative subpopulations contain more than 40% stem cell‐like cells capable of self‐renewal and forming tumors in nude mice. In the future, it is necessary to explore the definitive marker(s) to identify such stem cells in A549 and H446 cells for the better understanding of their bigger roles in tumor biology and for their potential use as therapeutic targets to treat relapsed cancers, especially those resistant to conventional chemotherapies.
References
- 1. Miraglia S, Godfrey W, Yin AH et al . A novel five‐transmembrane hematopoietic stem cell antigen: isolation, characterization, and molecular cloning. Blood 1997; 90: 5013–21. [PubMed] [Google Scholar]
- 2. Yin AH, Miraglia S, Zanjani ED et al . AC133, a novel marker for human hematopoietic stem and progenitor cells. Blood 1997; 90: 5002–12. [PubMed] [Google Scholar]
- 3. Singh SK, Clarke ID, Terasaki M et al . Identification of a cancer stem cell in human brain tumors. Cancer Res 2003; 63: 5821–8. [PubMed] [Google Scholar]
- 4. Singh SK, Hawkins C, Clarke D et al . Identification of human brain tumor initiating cells. Nature 2004; 432: 396–401. [DOI] [PubMed] [Google Scholar]
- 5. Collins AT, Berry PA, Hyde C, Stower MJ, Maitland NJ. Prospective identification of tumorigenic prostate cancer stem cells. Cancer Res 2005; 65: 10946–51. [DOI] [PubMed] [Google Scholar]
- 6. Suetsugu A, Nagaki M, Aoki H et al . Characterization of CD133+ hepatocellular carcinoma cells as cancer stem/progenitor cells. Biochem Biophys Res Commun 2006; 351: 820–4. [DOI] [PubMed] [Google Scholar]
- 7. Yin S, Li J, Hu C et al . CD133 positive hepatocellular carcinoma cells possess high capacity for tumorigenicity. Int J Cancer 2007; 120: 1444–50. [DOI] [PubMed] [Google Scholar]
- 8. Hermann PC, Huber SL, Herrier T et al . Distinct populations of cancer stem cells determine tumor growth and metastatic activity in human pancreatic cancer. Cell Stem Cell 2007; 1: 313–23. [DOI] [PubMed] [Google Scholar]
- 9. O’Brien CA, Pollett A, Gallinger S et al . A human colon cancer cell capable of initiating tumour growth in immunodeficient mice. Nature 2007; 445: 106–10. [DOI] [PubMed] [Google Scholar]
- 10. Ricci‐Vitiani L, Lombardi DG, Pilozzi E et al . Identification and expansion of human colon‐cancer‐initiating cells. Nature 2007; 445: 111–5. [DOI] [PubMed] [Google Scholar]
- 11. Monzani E, Facchetti F, Galmozzo E et al . Melanoma contains CD133 and ABCG2 positive cells with enhanced tumourigenic potential. Eur J Cancer 2007; 43: 935–46. [DOI] [PubMed] [Google Scholar]
- 12. Eramo A, Lotti F, Sette G et al . Identification and expansion of the tumorigenic lung cancer stem cell population. Cell Death Differ 2008; 15: 504–14. [DOI] [PubMed] [Google Scholar]
- 13. Beier D, Hau P, Proescholdt M et al . CD133 (+) and CD133 (–) glioblastoma‐derived cancer stem cells show differential growth characteristics and molecular profiles. Cancer Res 2007; 67: 4010–5. [DOI] [PubMed] [Google Scholar]
- 14. Shmelkov SV, Butler JM, Hooper AT et al . CD133 expression is not restricted to stem cells, and both CD133+ and CD133− metastatic colon cancer cells initiate tumors. J Clin Invest 2008; 118: 2111–20. [DOI] [PMC free article] [PubMed] [Google Scholar]
- 15. Srivastava VK, Nalbantoglu J. Flow cytometric characterization of the DAOY medulloblastoma cell line for the cancer stem‐like phenotype. Cytometry A 2008. 73: 940–8. [DOI] [PubMed] [Google Scholar]
- 16. Zheng X, Shen G, Yang X, Liu W. Most C6 cells are cancer stem cells: evidence from clonal and population analyses. (Published erratum appears in Cancer Res 2007; 67: 10097.) Cancer Res 2007; 67: 3691–7. [DOI] [PubMed] [Google Scholar]
- 17. Pardal R, Clarke MF, Morrison SJ. Applying the principles of stem‐cell biology to cancer. Nat Rev Cancer 2003; 3: 895–902. [DOI] [PubMed] [Google Scholar]
- 18. Eramo A, Ricci‐Vitiani L, Zeuner A et al . Chemotherapy resistance of glioblastoma stem cells. Cell Death Differ 2006; 13: 1238–41. [DOI] [PubMed] [Google Scholar]
- 19. Liu G, Yuan X, Zeng Z et al . Analyses of gene expression and chemoresistance of CD133+ cancer stem cells in glioblastoma. Mol Cancer, 2006; 2(5): 67. [DOI] [PMC free article] [PubMed] [Google Scholar]
- 20. Albini A, Iwamoto Y, Kleinman HK et al . A rapid in vitro assay for quantitating the invasive potential of tumor cells. Cancer Res 1987; 47: 3239–45. [PubMed] [Google Scholar]
- 21. Heppner GH. Tumor heterogeneity. Cancer Res 1984; 44(6): 2259–65. [PubMed] [Google Scholar]
- 22. Weisenthal LM, Lippman ME. Clonogenic and nonclonogenic in vitro chemosensitivity assays. Cancer Treat Rep 1985; 69: 615–32. [PubMed] [Google Scholar]
- 23. Al‐Hajj M, Wiclla MS, Benito‐Hernandez A et al . Prospective identification of tumorigenic breast cancer cells. Proc Natl Acad Sci USA 2003; 100: 3983–8. [DOI] [PMC free article] [PubMed] [Google Scholar]