

Abstract
It is widely known that vegetable consumption contributes to reducing the risk of gastric cancer (GC). However, the incidence rates of GC remain high in both Japanese and Korean populations, even though they have a high consumption of total vegetables. This may be due to the fact that Japanese and Koreans mainly consume processed vegetables, such as cooked, salted, or pickled vegetables, rather than fresh vegetables. To determine whether the intakes of fresh and pickled vegetables have different effects on the risk of GC in Japanese and Korean populations, we carried out a meta‐analysis of published epidemiological reports. Eight studies on the consumption of fresh vegetables and 14 studies on the consumption of pickled vegetables related to GC risk were included in this meta‐analysis. Four studies exploring differences in GC risk in men and women were considered separately. We observed that a high intake of fresh vegetables was significantly associated with a decreased risk of GC (overall summary OR = 0.62, 95% CI = 0.46–0.85) but that a high intake of pickled vegetables was significantly associated with an increased risk of GC (overall summary OR = 1.28, 95% CI = 1.06–1.53). The results of this meta‐analysis provide evidence that a high intake of pickled vegetables may increase GC risk and suggest that a high consumption of fresh vegetables, rather than a large total amount of vegetables including pickled vegetables, is important to reduce GC risk. (Cancer Sci 2009)
Vegetable consumption is known to contribute to a reduction of gastric cancer (GC) risk.( 1 , 2 , 3 , 4 , 5 , 6 ) The mean daily intake of vegetables in Korea (327.0 g/day)( 7 ) and Japan (253.9 g/day)( 8 ) is higher than that of the USA (189 g/day)( 9 ) and northern Europe (104.6–119.1 g/day in men and 119.4–131.0 g/day in women),( 10 ) all regions characterized by low rates of GC incidence (<15/100 000).( 11 ) However, the age‐standardized incidence rate of GC remained high in Korea (67–73/100 000 men and 20–30/100 000 women) and Japan (60–92/100 000 men and 24–39/100 000 women) during the 1990s.( 12 ) Moreover, the seroprevalence of Helicobacter pylori infection, considered as a major risk factor for GC, is also high in Japan (60.0%) and Korea (59.6%).( 13 , 14 )
This paradox might be explained by the fact that Japanese and Korean people consume more pickled vegetables than fresh vegetables. Vegetables are the main source of various antioxidants (such as carotenoids, vitamin C, folate, and selenium), fiber, and phytochemicals that play an important role in the etiology of cancer.( 15 , 16 , 17 ) However, vegetables have varying effects on GC risk, depending on how they are prepared and preserved. Fresh vegetables contain greater amounts of these nutrients because there is no nutrient loss due to preparation, so fresh vegetable consumption appears to be a stronger protective factor against GC than total vegetable consumption.( 16 ) Unfortunately, Japanese and Korean people often consume processed vegetables, such as cooked, salted, or pickled vegetables, rather than fresh vegetables.( 7 ) Pickling, also known as brining or corning, is the process of preserving food by soaking and storing it in vinegar or brine.( 18 ) Although pickled vegetables may offer health benefits due to the fermentation process,( 19 ) they may have adverse effects on GC risk due to the addition of large amounts of salt and the loss of key nutrients contained in vegetables under acidic and oxygenic conditions.( 15 , 20 , 21 ) In addition, pickled vegetables are a possible source of nitroso compounds that may contribute to gastric carcinogenesis.( 22 , 23 )
Although the evidence from case–control studies supporting the protective effects of vegetables against GC risk remains strong, evidence about the effects of vegetable consumption on GC risk from cohort studies is equivocal,( 16 , 24 , 25 , 26 ) and meta‐analyses of the relationships between pickled vegetable intake and GC risk have not been carried out. Therefore, we examined the relationships between the consumption of fresh vegetables and pickled vegetables and GC risk through a meta‐analysis of studies carried out in Japanese and Korean populations that indicated a high risk of GC but also a high intake of vegetables.
Materials and Methods
Selection of studies for meta‐analysis. Case–control studies and cohort studies evaluating the relationships between vegetable intake and GC risk published before November 2008 were identified using databases including PubMed (http://www.ncbi.nlm.nih.gov/pubmed/), KoreaMed (http://www.koreamed.org/SearchBasic.php), and Ichushi (Japana Centra Revuo Medicina, http://www.jamas.or.jp). The keywords used in these searches were (“gastric cancer” or “stomach cancer”), (“vegetable” or “pickled vegetable”), and (“Japan” or “Korea”). We also reviewed the references cited in the articles to identify additional studies for inclusion. We included published works written in Japanese, Korean, and English.
Inclusion/exclusion criteria. Inclusion/exclusion criteria for this meta‐analysis were as follows.
-
1
To examine the relationships between overall fresh or pickled vegetables intake and GC risk, we included only the results that specified the food item to be “fresh vegetables,”“raw vegetables,”“pickled vegetables,”“pickles,” or “pickled food” in each study, and the results obtained from single food item questions have been excluded.
-
2
Subjects were of Japanese or Korean ethnicities. Migrant studies were also included.
-
3
Cohort or case–control studies were included. Review or meta‐analysis articles were excluded.
-
4
The studies that presented adjusted 95% confidence intervals (CI) as well as relative risks (RR) or odds ratios (OR) were included for meta‐analysis in order to use adjusted values. Studies that did not report adjusted 95% CI or that presented regression coefficient values were excluded even if the number of cases and controls were presented.
-
5
In cases of multiple publications drawn from studies of the same population, only the most recent study was included.
-
6
Case–control studies that evaluated mortality instead of GC incidence were excluded.
Data abstraction. The studies were reviewed independently by two reviewers using the same inclusion/exclusion criteria, with disagreements between the reviewers resolved by consensus. The following information was collected from each study: the study design; author; publication year; nation; study period; study subjects (type and sources, definition, and numbers of subjects); measure unit of food intake (consumption frequency or quantitative intake amount); category of food intake; RR/OR and 95% CI; P for trend; and confounding variables.
Statistical analysis. To consider the values adjusted for the confounding factors and to include the studies that did not present each cell number (cross‐tabulation) in the tables,( 6 , 27 ) we used the values of RR or OR with its 95% CI. Statistical heterogeneity across the studies was assessed by calculating the between‐study variation (τ2) from the Q statistic.( 28 ) In addition to Q, the I2 statistic describing the percentage of variation attributable to heterogeneity across the studies was also calculated from Q values because it is easily interpretable. It has been suggested that I2 values of 25%, 50%, and 75% is assigned to low, moderate, and high heterogeneity, respectively.( 29 ) Depending on these results for heterogeneity, we decided whether a fixed‐effect or random‐effect model would be used to calculate the summary OR and its 95% CI. Additionally, we discovered sources of heterogeneity between studies through a meta‐regression analysis including nationality (Japanese vs Korean), study design (cohort vs case–control study), sex (total, men, vs women), and the year the study started. To assess the degree of publication bias, we tested asymmetry in the funnel plot using Begg’s test.( 30 ) P‐values less than 0.05 were considered statistically significant. All analyses were carried out using STATA 10 software (STATA, College Station, TX, USA).
Results
We identified a total of 75 articles through an initial computerized search of published work. By screening the articles according to title and abstract, 54 articles (11 review papers, 1 meta‐analysis study, 9 experiment studies or clinical trials, 9 studies of populations from other countries, 23 studies on other foods or vegetables or non‐dietary factors, and 1 study on atrophic gastritis) were excluded. We added 11 articles through citation searches, and then 32 original articles related to the relationships between the consumption of fresh and/or pickled vegetables and GC risk were included. Among these articles, the number of studies on the relationships between fresh vegetable intake and GC risk was 14 (2 cohort studies( 31 , 32 ) and 12 case–control studies( 6 , 27 , 33 , 34 , 35 , 36 , 37 , 38 , 39 , 40 , 41 , 42 )), and the number of studies on the relationships between pickled vegetable intake and GC risk was 25 (15 cohort studies( 23 , 31 , 32 , 43 , 44 , 45 , 46 , 47 , 48 , 49 , 50 , 51 , 52 , 53 , 54 ) and 10 case–control studies( 27 , 33 , 34 , 36 , 41 , 55 , 56 , 57 , 58 , 59 )). Based on the exclusion criteria, three case–control studies that did not report adjusted 95% CI values,( 33 , 55 , 56 ) one cohort study that presented the regression coefficient values,( 43 ) one cohort study that compared the mean intake times per week,( 44 ) nine publications presenting multiple studies of the same population,( 31 , 35 , 37 , 38 , 39 , 45 , 47 , 48 , 54 ) and one case–control study using death cases( 57 ) were excluded. Finally, a total of eight articles (one cohort study( 32 ) and seven case–control studies( 6 , 27 , 34 , 36 , 40 , 41 , 42 )) on the effects of consuming fresh vegetables and 14 articles (eight cohort studies( 23 , 32 , 46 , 49 , 50 , 51 , 52 , 53 ) and six case–control studies( 27 , 34 , 36 , 41 , 58 , 59 )) on the effects of consuming pickled vegetables were included in this meta‐analysis. Four articles( 34 , 50 , 51 , 53 ) that presented results separately for men and women were considered in the separate articles for meta‐analysis.
The details of the eligible studies are presented in 1, 2 by vegetable type (fresh or pickled). Confounding factors, including typical confounders such as age and sex, were adjusted for in most studies. We obtained statistically significant results in tests of heterogeneity between studies of fresh vegetables (Q = 28.369 on 8 degrees of freedom, P < 0.001; I2 = 71.8%) and pickled vegetables (Q = 45.292 on 16 degrees of freedom, P < 0.001; I2 = 64.7%). Therefore, we selected a random‐effect model to present the summary statistics. The results of the meta‐analysis of the relationships between fresh and pickled vegetable intake and GC risk are presented in 1, 2, respectively. A high intake of fresh vegetables was significantly associated with a decreased risk of GC (overall summary OR = 0.62, 95% CI = 0.46–0.85), whereas a high intake of pickled vegetables was significantly associated with an increased risk of GC (overall summary OR = 1.28, 95% CI = 1.06–1.53). The adjusted RR/OR for the highest category of fresh vegetable intake were skewed in the negative direction (RR/OR range, 0.20–0.92) except for one study (OR = 1.20),( 36 ) whereas the adjusted RR/OR for the highest category of pickled vegetable intake varied (RR/OR range, 0.60–3.80). After excluding two studies by Lee JK et al. ( 36 ) and Lee SA et al.,( 40 ) which reported excessive right‐ or left‐sided skew in their associations between fresh vegetable intake and GC risk, the level of heterogeneity became low (Q = 13.074 on 6 degrees of freedom, P = 0.042; I2 = 54.1%; data not shown). However, the significance levels of the overall summary estimate of the effect of the consumption of fresh vegetables on GC risk did not change (overall summary OR = 0.64, 95% CI = 0.49–0.83; data not shown).
Table 1.
Intake of fresh vegetables and gastric cancer (GC) risk: cohort and case–control studies among Japanese and Korean populations
| Author (year), country(Ref.) | Study period | Study subjects | Measure unit of food intake | Category | RR/OR (95% CI) | P for trend | Confounding variables considered | |||
|---|---|---|---|---|---|---|---|---|---|---|
| Source of subjects | No. of subjects | Event followed | No. of incident cases or deaths | |||||||
| Cohort studies | ||||||||||
| Inoue et al. (1996), Japan( 32 ) | 1985–1995 | Patients who received gastroscopy (Aichi Cancer Center) | 5373 | Incidence | 69 (51 men, 18 women) | Frequency | Rarely Occasionally Daily | 1.0 0.73 (0.34–1.55) 0.67 (0.29–1.57)† | NA | Adjusted for sex and age |
| Case–control studies | ||||||||||
| Kato et al. (1990), Japan( 34 ) | 1985–1989 | Cases: histologically confirmed cases/Controls: patients with normal gastric mucosa (Aichi Cancer Center) | Cases: 289 men/ Controls: 1247 men | Frequency | ≤1–2/month 2–3/week | 1.0 0.77 (0.51–1.15) | NA | Adjusted for age and residence | ||
| Daily | 0.59 (0.37–0.93) | |||||||||
| Cases: 138 women/ Controls: 1767 women | ≤1–2/month 2–3/week Daily | 1.0 1.04 (0.62–1.74) 0.84 (0.47–1.51) | NA | |||||||
| Hoshiyama et al. (1992), Japan( 27 ) | 1984–1990 | Cases: newly histologically confirmed cases/Controls: residents in the study area (Saitama Cancer Center) | Cases: 294 (206 men, 88 women)/ Controls: 294 (206 men, 88 women) | Frequency | ≤1/week 2–5/week ≥6/week | 1.0 0.5 (0.3–0.8) 0.4 (0.2–0.7)‡ | <0.0100 | Matched for sex, age, administrative division, and smoking status | ||
| Lee et al. (1995), Korea( 36 ) | 1990–1991 | Cases: histologically confirmed cases/Controls: hospitalized patients (Hanyang University Hospital and Asan Medical Center) | Cases: 213 (132 men, 81 women)/ Controls: 213 (132 men, 81 women) | Quantitative amount | Tertile 1 Tertile 2 Tertile 3 | 1.0 1.1 (0.7–1.9) 1.2 (0.8–1.9) | 0.6400 | Matched for sex and age (±2 years)/Adjusted for age, sex, education, economic status and residence | ||
| Kim et al. (2002), Korea( 6 ) | 1997–1998 | Cases: newly histologically confirmed cases/Controls: patients without GC of the same hospital (Hanyang University Hospital and Hallim University Hospital) | Cases: 136 (93 men, 43 women)/ Controls: 136 (93 men, 43 women) | Quantitative amount | Quartile 1 Quartile 2–3 Quartile 4 | 1.0 0.61 (0.34–1.09) 0.55 (0.28–1.09) | 0.1579 | Matched for sex, age (±2 years), and hospital/ Adjusted for age, sex, socioeconomic status, family history of GC, and refrigerator use | ||
| Ito et al. (2003), Japan( 41 ) | 1988–1998 | Cases: histologically confirmed cases/Controls: cancer‐free first visit outpatients at the center (Aichi Cancer Center) | Cases: 508 women/ Controls: 36 490 women | Frequency | Almost never Occasionally 3–4 times/week Everyday | 1.00 0.68 (0.48–0.97) 0.74 (0.52–1.05) 0.50 (0.36–0.71) | <0.0010 | Adjusted for age, year and season of first hospital visit, smoking, and family history of GC | ||
| Lee et al. (2003), Korea( 40 ) | 2000 | Cases: newly histologically confirmed cases/Controls: outpatients without GC (Asan Medical Center) | Cases: 69 (50 men, 19 women)/ Controls: 199 (116 men, 83 women) | Frequency | <4/week 4–6/week >6/week | 1.0 0.2 (0.1–0.5) 0.2 (0.1–0.5) | <0.0100 | Adjusted for age, sex, and Helicobacter pylori infection | ||
| Nan et al. (2005), Korea( 42 ) | 1997–2003 | Cases: histologically confirmed cases/Controls: patients of the same hospital (Chungbuk National University Hospital and Eulji University Hospital) | Cases: 421 (276 men, 145 women)/ Controls: 632 (414 men, 218 women) | Quantitative amount | Low High | 1.0 0.92 (0.72–1.17) | NA | Matched for sex, age (±3 years), and hospital | ||
†Compared with subjects without atrophic gastritis. ‡Compared with general population controls. CI, confidence interval; NA, not available; OR, odds ratio; RR, relative risk.
Table 2.
Intake of pickled vegetables and gastric cancer (GC) risk: cohort and case–control studies among Japanese or Korean populations
| Author (year), country(Ref.) | Study period | Study subjects | Measure unit of food intake | Category | RR/OR (95% CI) | P for trend | Confounding variables considered | |||
|---|---|---|---|---|---|---|---|---|---|---|
| Source of subjects | No. of subjects | Event followed | No. of incident cases or deaths | |||||||
| Cohort studies | ||||||||||
| Kato et al. (1992), Japan( 23 ) | 1985–1991 | Population‐based subjects (Aichi prefectures) | 9753 | Death | 57 (35 men, 22 women) | Frequency | ≤1–2/week 3–4/week Daily | 1.0 0.51 (0.18–1.48) 0.75 (0.38–1.49) | 0.593 | Adjusted for age and sex |
| Inoue et al. (1996), Japan( 32 ) | 1985–1995 | Patients who received gastroscopy at Aichi Cancer Center | 5373 | Incidence | 69 (51 men, 18 women) | Frequency | Rarely Occasionally Daily | 1.0 2.40 (0.91–6.34) 2.31 (0.87–6.10)† | NA | Adjusted for sex and age |
| Galanis et al. (1998), Japan( 46 ) | 1975–1994 | Japanese‐American residents of Hawaii | 11 907 (5610 men, 6297 women) | Incidence | 108 (64 men, 44 women) | Frequency | None 1–6/week ≥7/week | 1.0 1.3 (0.8–2.2) 1.1 (0.7–1.8) | 0.750 | Adjusted for sex, age, years of education, and Japanese place of birth |
| Ngoan et al. (2002), Japan( 49 ) | 1986–1999 | Population‐based subjects (Fukuoka prefectures) | 13 250 (5917 men, 7333 women) | Death | 116 (77 men, 39 women) | Frequency | ≤2–4/week Once/day ≥2/day | 1.0 1.3 (0.7–2.5) 1.5 (0.7–3.2) | ≥0.050 | Adjusted for age, sex, smoking, processed meat, liver, cooking or salad oil, suimono soup |
| Khan et al. (2004), Japan( 50 ) | 1984–2002 | Population‐based subjects (Hokkaido prefectures) | 1524 men | Death | 36 men | Frequency | ≤Several/month ≥Several/week | 1.0 0.9 (0.3–3.1)‡ | NA | Adjusted for age and smoking |
| Tsugane et al. (2004), Japan( 51 ) | 1990–2001 | Participants in JPHC cohort I (four prefectures; Iwate, Akita, Nagano, Okinawa) | 18 684 men | Incidence | 358 men | Frequency | Almost none 1–2 days/week 3–4 days/week Almost every day | 1.0 1.54 (0.97–2.46) 2.71 (1.76–4.19) 2.35 (1.57–3.54) | <0.001 | Adjusted for age, smoking, fruit and non green‐yellow vegetable intake |
| 20 381 women | Incidence | 128 women | Almost none 1–2 days/week 3–4 days/week Almost every day | 1.0 1.01 (0.44–2.31) 2.20 (1.05–4.58) 1.74 (0.89–3.41) | 0.050 | |||||
| Sauvaget et al. (2005), Japan( 52 ) | 1980–1999 | Participants in LSS cohort§ (two prefectures; Hiroshima and Nagasaki) | 38 576 (14 885 men, 23 691 women) | Incidence | 1270 (719 men, 551 women) | Frequency | <2/week 2–4/week ≥5/week | 1.0 0.91 (0.77–1.07) 1.11 (0.98–1.26) | 0.025 | Adjusted for age, sex, city, radiation dose, sex‐specific smoking habit, and education |
| Tokui et al. (2005), Japan( 53 ) | 1988–1999 | Participants in JACC study (45 areas) | 110 792 | Death | 574 men | Frequency | ≤1–2/month 1–2/week 3–4/week ≥1/day | 1.0 1.04 (0.72–1.51) 1.00 (0.70–1.42) 1.09 (0.82–1.47) | 0.480 | Adjusted for age |
| 285 women | ≤1–2/month 1–2/week 3–4/week ≥1/day | 1.0 1.56 (0.87–2.81) 1.32 (0.74–2.36) 1.47 (0.90–2.39) | 0.260 | |||||||
| Case–control studies | ||||||||||
| Kato et al. (1990), Japan( 34 ) | 1985–1989 | Cases: histologically confirmed cases/Controls: patients with normal gastric mucosa (Aichi Cancer Center) | Cases: 289 men/ Controls: 1247 men | Frequency | ≤1–2/month 2–3/week Daily | 1.0 1.54 (1.00–2.39) 1.37 (0.88–2.13) | NA | Adjusted for age and residence | ||
| Cases: 138 women/ Controls: 1767 women | ≤1–2/month 2–3/week Daily | 1.0 1.16 (0.71–1.90) 0.75 (0.45–1.27) | NA | |||||||
| Hoshiyama et al. (1992), Japan( 27 ) | 1984–1990 | Cases: newly histologically confirmed cases/Population controls: residents in the study area (Saitama Cancer Center) | Cases: 294 (206 men, 88 women)/ Controls: 294 (206 men, 88 women) | Frequency | ≤1/week 2–9/week ≥10/week | 1.0 0.8 (0.4–1.5) 1.3 (0.7–2.6)¶ | 0.030 | Matched for sex, age, administrative division, and smoking status | ||
| Lee et al. (1995), Korea( 36 ) | 1990–1991 | Cases: histologically confirmed cases/Controls: hospitalized patients (Hanyang University Hospital and Asan Medical Center) | Cases: 213 (132 men, 81 women)/ Controls: 213 (132 men, 81 women) | Quantitative amount | Tertile 1 Tertile 2 Tertile 3 | 1.0 2.9 (1.6–5.2) 3.8 (2.3–6.5) | <0.001 | Matched for sex and age (±2 years)/Adjusted for age, sex, education, economic status and residence | ||
| Watabe et al. (1998), Japan( 58 ) | 1996–1997 | Cases: histologically confirmed cases/Controls: randomly selected from the telephone book (Sapporo Medical University Hospital) | Cases: 242 (180 men, 62 women)/ Controls: 484 (360 men, 124 women) | Frequency | ≤3–6/week Daily | 1.0 1.10 (0.78–1.55) | NA | Matched for sex, age (±3 years), and registered residence | ||
| Ito et al. (2003), Japan( 41 ) | 1988–1998 | Cases: histologically confirmed cases/Controls: cancer‐ free first visit outpatients (Aichi Cancer Center) | Cases: 508 women/ Controls: 36 490 women | Frequency | <1/week 1–2/week 3–4/week ≥5/week | 1.00 0.92 (0.72–1.18) 1.36 (1.02–1.81) 1.04 (0.74–1.47) | NS | Adjusted for age, year and season of first hospital visit, smoking, and family history of GC | ||
| Machida‐Montani et al. (2004), Japan( 59 ) | 1998–2002 | Cases: 122 (82 men, 40 women)/ Controls: 235 (159 men, 76 women) | Quantitative amount | Tertile 1 Tertile 2 Tertile 3 | 1.0 0.6 (0.3–1.2) 0.6 (0.3–1.3) | 0.17 | ||||
†Compared with subjects without atrophic gastritis. ‡Only for men (relative risk [RR] in women was not estimated due to zero cases in both intake groups). §Life Span Study (LSS) cohort includes atomic bomb survivors and unexposed subjects in Hiroshima and Nagasaki. ¶Compared with general population control. CI, confidence interval; JACC, Japan Collaborative Cohort Study for Evaluation of Cancer Risk; JPHC cohort, Japan Public Health Center‐based prospective study; NA, not available; NS, not significant; OR, odds ratio.
Figure 1.
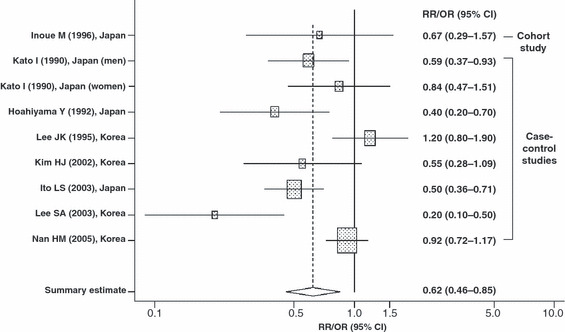
Summary estimate of the relationships between fresh vegetable intake and gastric cancer risk in Japanese and Korean populations. CI, confidence interval; OR, odds ratio; RR, relative risk. Shaded box, point estimate of each study; horizontal line, 95% CI of each study; diamond, summary point estimate and its 95% CI of studies.
Figure 2.
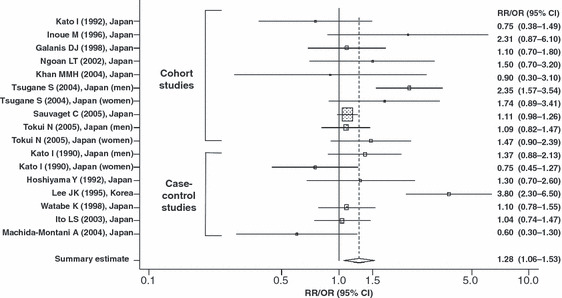
Summary estimate of the relationships between pickled vegetable intake and gastric cancer risk in Japanese and Korean populations. CI, confidence interval; OR, odds ratio; RR, relative risk. Shaded box, point estimate of each study; horizontal line, 95% CI of each study; diamond, summary point estimate and its 95% CI of studies.
To explore the possible variables that explain why the results varied from study to study, a meta‐regression analysis was carried out that included nationality (Japanese vs Korean), study design (cohort vs case–control study), sex (total, men vs women), and the year the study started. Of these variables, nationality (P = 0.043 for fresh vegetables and P < 0.001 for pickled vegetables) was observed as a source of heterogeneity. However, study design (P = 0.690 for fresh vegetables and P = 0.126 for pickled vegetables), sex (P = 0.449 for fresh vegetables and P = 0.567 for pickled vegetables), and the year the study started (P = 0.081 for fresh vegetables and P = 0.512 for pickled vegetables) were not significant sources of heterogeneity between studies. Therefore, we carried out a subgroup analysis according to nationality. The protective effects of fresh vegetables on GC risk from Japanese studies (OR = 0.56, 95% CI = 0.45–0.69) was stronger than that of the overall analysis, and the heterogeneity between studies disappeared (Q = 3.609 on four degrees of freedom, P = 0.461, I2 = 0%). However, the heterogeneities between Korean studies on fresh vegetables as well as Japanese studies on pickled vegetables remained after the subgroup analysis according to nationality (data not shown).
Begg’s funnel plots for assessment of publication bias are presented in Figure 3. Begg’s test and funnel plots did not detect publication bias in the meta‐analyses of the effect of fresh (Z = 0.94, P = 0.348) or pickled vegetables (Z = 0.78, P = 0.434) on GC risk.
Figure 3.
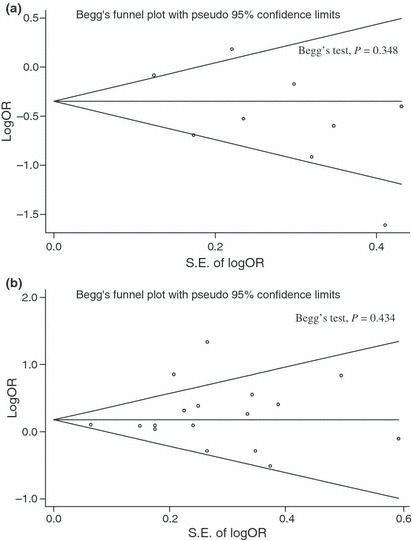
Begg’s funnel plot for publication bias in our overall meta‐analysis of published epidemiological reports regarding fresh vegetable intake (a) and pickled vegetable intake (b) and gastric cancer risk. SE of logOR, standard error of log odds ratio.
Discussion
The American Institute for Cancer Research reported that the summary relative risks of GC comparing high to low categories for total vegetable consumption were 0.50 (95% CI = 0.38–0.65) for 14 case–control studies and 0.80 (95% CI = 0.54–1.18) for 4 cohort studies through meta‐analysis.( 16 ) In a meta‐analysis of 8 cohort studies, the summary relative risk of GC in high versus low categories for total vegetable intake was 0.88 (95% CI = 0.69–1.13).( 24 ) Similarly, two large European cohort studies( 25 , 26 ) reported that total vegetable intake was not associated with GC risk, regardless of the anatomic site. Although the protective effects of vegetable consumption on GC risk is widely accepted,( 1 , 2 , 3 , 4 , 5 , 6 ) the results of the above meta‐analyses indicate that the evidence from cohort studies does not support the protective effects of total vegetable intake on GC risk.( 16 , 24 , 25 , 26 )
Japanese and Korean populations have higher rates of GC incidence,( 12 ) despite the fact that total vegetable consumption is higher in Japan and Korea,( 7 , 8 ) than those in other countries with a lower intake of vegetables.( 9 , 10 ) There is a possibility that a higher incidence of GC in Japan and Korea is partly due to the low consumption of fruits in these areas. However, the total consumption of vegetables and fruits is also higher in Korea (414.4 g/day)( 7 ) and Japan (373.1 g/day)( 8 ) than in the USA (358 g/day)( 9 ) or northern Europe (278–288.5).( 10 ) Moreover, Japanese and Korean people tend to consume more cooked, salted, or pickled vegetables than do people from North America or Europe.( 7 , 10 , 60 ) Based on this observation, we inferred that the effects of vegetable consumption on GC risk may be different according to the preparation of the vegetables.
In the present meta‐analysis, we observed significant inverse associations between a high intake of fresh vegetables and GC risk (overall summary OR = 0.62, 95% CI = 0.46–0.85). It has been suggested that the anticarcinogenic effect of vegetables is attributed in part to the effect of antioxidant vitamins, especially vitamin C and β‐carotene, which inhibit the intragastric formation of carcinogens such as N‐nitroso compounds from secondary amines and nitrite. This inhibition might be caused by the reduction of nitrites into nitric oxide in the presence of reducing equivalents, such as vitamin C, or the combination of antioxidant vitamins with amines.( 4 , 61 , 62 ) Another possible mechanism for the anticarcinogenic effects of antioxidants is the neutralization of reactive oxygen free radicals that can damage DNA.( 63 , 64 ) Fresh vegetables contain a larger amount of antioxidant vitamins, such as vitamin C and β‐carotene, than processed vegetables.( 20 , 21 , 65 ) As well as antioxidant vitamins, vegetables contain various phytochemicals that act as antioxidants and scavenge free radicals, which could help to prevent cancer that occurs as a result of oxidative stress.( 15 )
We observed that a high intake of pickled vegetables was significantly associated with an increased risk of GC (overall summary OR = 1.28, 95% CI = 1.06–1.53). Examples of pickled vegetables include Japanese tsukemono and Korean Jangajji. Japanese tsukemono includes takuan (daikon), umeboshi (ume plum), ginger, turnip, cucumber, and Chinese cabbage.( 18 ) Korean Jangajji is a pickled vegetable made by pickling or marinating garlic, daikon, cucumber, chili pepper leaves, and perilla leaves in soy sauce, chili pepper paste, soybean paste, or diluted vinegar.( 66 ) Because they are preserved in brine (a solution of salt in water) or marinated and stored in an acid solution, pickled vegetables contain a substantial amount of salt. Salt is not a directly acting carcinogen, but consumption of salt and salt‐preserved foods may cause atrophic gastritis by directly damaging the gastric mucosa, which could induce DNA synthesis and cell proliferation that contributes to stomach carcinogenesis( 67 ) or enhance the penetration of carcinogens.( 68 ) In addition, it has been reported that a high‐salt diet enhances H. pylori colonization in the stomach.( 69 ) Helicobacter pylori infection may increase the endogenous synthesis of nitrate in the stomach and decrease gastric vitamin C concentrations,( 70 ) thereby increasing endogenous N‐nitroso compound formation.( 16 ) For these reasons, a high intake of salt and salt‐preserved foods has been considered a probable cause of GC in many studies.( 16 , 36 , 40 , 51 , 54 , 71 , 72 ) The loss of antioxidants in fresh vegetables as a consequence of processing and storage under acid and oxygen might partially explain the harmful effects of consumption of pickled vegetables on GC risk.( 15 , 20 , 21 ) Another possible explanation is that pickled vegetables are a possible food source of nitroso compounds, thereby contributing to gastric carcinogenesis.( 22 , 23 )
There are several limitations concerning the interpretation of this meta‐analysis. We selected a random‐effect model to ameliorate the effect of large heterogeneity between studies in this meta‐analysis, but this model has a typical limitation in that it does not strictly rule out the effects of heterogeneity; moreover, the relative weighting of the larger studies becomes reduced, whereas the weighting of the smaller studies is increased.( 73 ) In this meta‐analysis, the statistical significance of the results based on a fixed‐effect model and random‐effect model were not changed (OR = 0.71, 95% CI = 0.61–0.82 in fixed‐effect model for fresh vegetables; OR = 1.19, 95% CI = 1.09–1.30 in fixed‐effect model for pickled vegetables; data not shown). To explore the possible variables that explain the heterogeneity between studies, we carried out a meta‐regression analysis that included nationality, study design, sex, and the year the study started. As a result, only nationality was observed as a source of heterogeneity between studies. Although we carried out a meta‐analysis using adjusted RR/OR in order to consider several confounders, a residual confounding effect could remain because the variables included in the multivariate model were different from study to study.
In addition to the above limitations, various types of bias could occur in this meta‐analysis. Publication bias is a typical one involved in finding published studies that may lead researchers to draw incorrect conclusions from their meta‐analysis, because studies with statistically significant results are more likely to be published.( 73 ) The results of Begg’s test suggest that publication bias did not exist in this meta‐analysis, but the possibility of publication bias, which is a characteristic inherent to meta‐analyses, could still be present. In addition, because most studies were not designed to determine the effects of consumption of fresh or pickled vegetables on GC risk, there is a possibility that an outcome‐reporting bias may have influenced the validity of our meta‐analysis.( 74 ) That is, non‐significant associations between the consumption of fresh or pickled vegetables and GC risk may not have been presented in the results and, therefore, cannot be detected for meta‐analysis. The application of strict inclusion criteria for the selection of studies also introduces inclusion criteria bias.( 74 ) However, as the results with the same population can lead to overestimation due to duplication, we excluded these studies. We also excluded one case–control study using death cases,( 57 ) which are more prone to various types of bias in the case–control design than incidence cases. However, even if we include this study of death cases in our meta‐analysis, the significance of the overall summary estimate does not change (overall summary OR = 1.26, 95% CI = 1.05–1.50; data not shown). The interpretation and conclusions made from the results of this meta‐analysis should be regarded cautiously due to the above limitations and bias.
In conclusion, the results of this meta‐analysis provide evidence that high intake of pickled vegetables was associated with an increased GC risk, whereas high intake of fresh vegetables was associated with a decreased GC risk. These results may explain why the GC incidence rates in Japan and Korea remain high despite a high consumption of vegetables in these countries. A high consumption of fresh vegetables, rather than the total amount of vegetables, which includes pickled vegetables, should be promoted to reduce GC rates in Japan and Korea.
Acknowledgments
This study was supported by the National Cancer Center, Korea (0731060‐1, 0710160‐1, 0910221‐1) and by a Grant for the Third Term Comprehensive Control Research for Cancer from the Ministry of Health, Labour and Welfare of Japan.
References
- 1. Chyou PH, Nomura AM, Hankin JH, Stemmermann GN. A case‐cohort study of diet and stomach cancer. Cancer Res 1990; 50: 7501–4. [PubMed] [Google Scholar]
- 2. Buiatti E, Palli D, Decarli A et al. A case–control study of gastric cancer and diet in Italy: II. Association with nutrients. Int J Cancer 1990; 45: 896–901. [DOI] [PubMed] [Google Scholar]
- 3. Boeing H, Frentzel‐Beyme R, Berger M et al. Case–control study on stomach cancer in Germany. Int J Cancer 1991; 47: 858–64. [DOI] [PubMed] [Google Scholar]
- 4. Correa P, Chen VW. Gastric cancer. Cancer Surv 1994; 20: 55–76. [PubMed] [Google Scholar]
- 5. Hansson LE, Nyren O, Bergstrom R et al. Nutrients and gastric cancer risk. A population‐based case–control study in Sweden. Int J Cancer 1994; 57: 638–44. [DOI] [PubMed] [Google Scholar]
- 6. Kim HJ, Chang WK, Kim MK, Lee SS, Choi BY. Dietary factors and gastric cancer in Korea: a case–control study. Int J Cancer 2002; 97: 531–5. [DOI] [PubMed] [Google Scholar]
- 7. Korea Ministry of Health and Welfare . The Third Korea National Health and Nutrition Examination Survey (KNHANES III), 2005. Kwacheon, Korea: Ministry of Health and Welfare, 2006. [Google Scholar]
- 8. Japan Ministry of Health, Labour and Welfare . Summary of Results of the National Health and Nutrition Survey, 2004. Tokyo, Japan: Ministry of Health, Labour and Welfare, 2006. [Google Scholar]
- 9. Agricultural Research Service of the U.S. Department of Agriculture . Results from USDA’s 1994‐96 Continuing Survey of Food Intakes by Individuals and 1994‐96 Diet and Health Knowledge Survey: Table Set 10. Beltsville, Maryland: U.S. Department of Agriculture, 1999. [Google Scholar]
- 10. Agudo A, Slimani N, Ocke MC et al. Consumption of vegetables, fruit and other plant foods in the European Prospective Investigation into Cancer and Nutrition (EPIC) cohorts from 10 European countries. Public Health Nutr 2002; 5: 1179–96. [DOI] [PubMed] [Google Scholar]
- 11. International Agency for Research on Cancer . World Cancer Report. Lyon: IARC Press, 2003. [Google Scholar]
- 12. International Agency for Research on Cancer . Cancer Incidence in Five Continents, Volume VIII. Lyon: IARC Press, 2002. [Google Scholar]
- 13. Nishise Y, Fukao A, Takahashi T. Risk factors for Helicobacter pylori infection among a rural population in Japan: relation to living environment and medical history. J Epidemiol 2003; 13: 266–73. [DOI] [PMC free article] [PubMed] [Google Scholar]
- 14. Yim JY, Kim N, Choi SH et al. Seroprevalence of Helicobacter pylori in South Korea. Helicobacter 2007; 12: 333–40. [DOI] [PubMed] [Google Scholar]
- 15. Kaur C, Kapoor HC. Antioxidants in fruits and vegetables – the millennium’s health. Int J Food Sci Technol 2001; 36: 703–25. [Google Scholar]
- 16. World Cancer Research Fund/American Institute for Cancer Research . Food, nutrition, physical activity, and the prevention of cancer: a global perspective. Washington, DC: American Institute for Cancer Research, 2007. [Google Scholar]
- 17. Liu C, Russell RM. Nutrition and gastric cancer risk: an update. Nutr Rev 2008; 66: 237–49. [DOI] [PubMed] [Google Scholar]
- 18. Wikipedia . Pickling. [Cited 9 April 2009.] Available from URL: http://en.wikipedia.org/wiki/Pickled_vegetables. San Francisco, California: Wikimedia Foundation, Inc., 2009. [Google Scholar]
- 19. Park KY. Korean traditional foods and their anticancer effects. J Korean Soc People Plants Environ 2002; 5: 41–5. [Google Scholar]
- 20. Lee YO, Park KY, Cheigh HS. Antioxidant effect of Kimchi with various fermentation period on the lipid oxidation of cooked ground meat. J Korean Soc Food Nutr 1996; 25: 261–6. [Google Scholar]
- 21. Yalim S, O¨zdemır Y. Effects of preparation procedures on ascorbic acid retention in pickled hot peppers. Int J Food Sci Nutr 2003; 54: 291–6. [DOI] [PubMed] [Google Scholar]
- 22. Correa P, Haenszel W, Cuello C, Tannenbaum S, Archer M. A model for gastric cancer epidemiology. Lancet 1975; 2: 58–60. [DOI] [PubMed] [Google Scholar]
- 23. Kato I, Tominaga S, Matsumoto K. A prospective study of stomach cancer among a rural Japanese population: a 6‐year survey. Jpn J Cancer Res 1992; 83: 568–75. [DOI] [PMC free article] [PubMed] [Google Scholar]
- 24. Lunet N, Lacerda‐Vieira A, Barros H. Fruit and vegetables consumption and gastric cancer: a systematic review and meta‐analysis of cohort studies. Nutr Cancer 2005; 53: 1–10. [DOI] [PubMed] [Google Scholar]
- 25. Nouraie M, Pietinen P, Kamangar F et al. Fruits, vegetables, and antioxidants and risk of gastric cancer among male smokers. Cancer Epidemiol Biomarkers Prev 2005; 14: 2087–92. [DOI] [PubMed] [Google Scholar]
- 26. Gonzalez CA, Pera G, Agudo A et al. Fruit and vegetable intake and the risk of stomach and oesophagus adenocarcinoma in the European Prospective Investigation into Cancer and Nutrition (EPIC‐EURGAST). Int J Cancer 2006; 118: 2559–66. [DOI] [PubMed] [Google Scholar]
- 27. Hoshiyama Y, Sasaba T. A case–control study of stomach cancer and its relation to diet, cigarettes, and alcohol consumption in Saitama Prefecture, Japan. Cancer Causes Control 1992; 3: 441–8. [DOI] [PubMed] [Google Scholar]
- 28. DerSimonian R, Laird N. Meta‐analysis in clinical trials. Control Clin Trials 1986; 7: 177–88. [DOI] [PubMed] [Google Scholar]
- 29. Higgins JP, Thompson SG, Deeks JJ, Altman DG. Measuring inconsistency in meta‐analyses. BMJ 2003; 327: 557–60. [DOI] [PMC free article] [PubMed] [Google Scholar]
- 30. Begg CB, Mazumdar M. Operating characteristics of a rank correlation test for publication bias. Biometrics 1994; 50: 1088–101. [PubMed] [Google Scholar]
- 31. Kato I, Tominaga S, Ito Y et al. A prospective study of atrophic gastritis and stomach cancer risk. Jpn J Cancer Res 1992; 83: 1137–42. [DOI] [PMC free article] [PubMed] [Google Scholar]
- 32. Inoue M, Tajima K, Kobayashi S et al. Protective factor against progression from atrophic gastritis to gastric cancer‐‐data from a cohort study in Japan. Int J Cancer 1996; 66: 309–14. [DOI] [PubMed] [Google Scholar]
- 33. Kono S, Ikeda M, Tokudome S, Kuratsune M. A case–control study of gastric cancer and diet in northern Kyushu, Japan. Jpn J Cancer Res 1988; 79: 1067–74. [DOI] [PMC free article] [PubMed] [Google Scholar]
- 34. Kato I, Tominaga S, Ito Y et al. A comparative case–control analysis of stomach cancer and atrophic gastritis. Cancer Res 1990; 50: 6559–64. [PubMed] [Google Scholar]
- 35. Inoue M, Tajima K, Hirose K, Kuroishi T, Gao CM, Kitoh T. Life‐style and subsite of gastric cancer‐‐joint effect of smoking and drinking habits. Int J Cancer 1994; 56: 494–9. [DOI] [PubMed] [Google Scholar]
- 36. Lee JK, Park BJ, Yoo KY, Ahn YO. Dietary factors and stomach cancer: a case–control study in Korea. Int J Epidemiol 1995; 24: 33–41. [DOI] [PubMed] [Google Scholar]
- 37. Huang X, Tajima K, Hamajima N et al. Effect of life styles on the risk of subsite‐specific gastric cancer in those with and without family history. J Epidemiol 1999; 9: 40–5. [DOI] [PubMed] [Google Scholar]
- 38. Huang XE, Tajima K, Hamajima N et al. Comparison of lifestyle and risk factors among Japanese with and without gastric cancer family history. Int J Cancer 2000; 86: 421–4. [DOI] [PubMed] [Google Scholar]
- 39. Lee SA, Kang D, Hong WS, Shim KN, Choe JW, Choi H. Dietary habit and Helicobacter pylori infection in early gastric cancer patient. Cancer Res Treat 2002; 34: 104–10. [DOI] [PubMed] [Google Scholar]
- 40. Lee SA, Kang D, Shim KN, Choe JW, Hong WS, Choi H. Effect of diet and Helicobacter pylori infection to the risk of early gastric cancer. J Epidemiol 2003; 13: 162–8. [DOI] [PMC free article] [PubMed] [Google Scholar]
- 41. Ito LS, Inoue M, Tajima K et al. Dietary factors and the risk of gastric cancer among Japanese women: a comparison between the differentiated and non‐differentiated subtypes. Ann Epidemiol 2003; 13: 24–31. [DOI] [PubMed] [Google Scholar]
- 42. Nan HM, Park JW, Song YJ et al. Kimchi and soybean pastes are risk factors of gastric cancer. World J Gastroenterol 2005; 11: 3175–81. [DOI] [PMC free article] [PubMed] [Google Scholar]
- 43. Ikeda M, Yoshimoto K, Yoshimura T, Kono S, Kato H, Kuratsune M. A cohort study on the possible association between broiled fish intake and cancer. Gann 1983; 74: 640–8. [PubMed] [Google Scholar]
- 44. Kolonel LN, Nomura AM, Hirohata T, Hankin JH, Hinds MW. Association of diet and place of birth with stomach cancer incidence in Hawaii Japanese and Caucasians. Am J Clin Nutr 1981; 34: 2478–85. [DOI] [PubMed] [Google Scholar]
- 45. Nomura A, Grove JS, Stemmermann GN, Severson RK. A prospective study of stomach cancer and its relation to diet, cigarettes, and alcohol consumption. Cancer Res 1990; 50: 627–31. [PubMed] [Google Scholar]
- 46. Galanis DJ, Kolonel LN, Lee J, Nomura A. Intakes of selected foods and beverages and the incidence of gastric cancer among the Japanese residents of Hawaii: a prospective study. Int J Epidemiol 1998; 27: 173–80. [DOI] [PubMed] [Google Scholar]
- 47. Fujino Y, Tamakoshi A, Ohno Y, Mizoue T, Tokui N, Yoshimura T. Prospective study of educational background and stomach cancer in Japan. Prev Med 2002; 35: 121–7. [DOI] [PubMed] [Google Scholar]
- 48. Kobayashi M, Tsubono Y, Sasazuki S, Sasaki S, Tsugane S. Vegetables, fruit and risk of gastric cancer in Japan: a 10‐year follow‐up of the JPHC Study Cohort I. Int J Cancer 2002; 102: 39–44. [DOI] [PubMed] [Google Scholar]
- 49. Ngoan LT, Mizoue T, Fujino Y, Tokui N, Yoshimura T. Dietary factors and stomach cancer mortality. Br J Cancer 2002; 87: 37–42. [DOI] [PMC free article] [PubMed] [Google Scholar]
- 50. Khan MMH, Goto R, Kobayashi K et al. Dietary habits and cancer mortality among middle aged and older Japanese living in hokkaido, Japan by cancer site and sex. Asian Pac J Cancer Prev 2004; 5: 58–65. [PubMed] [Google Scholar]
- 51. Tsugane S, Sasazuki S, Kobayashi M, Sasaki S. Salt and salted food intake and subsequent risk of gastric cancer among middle‐aged Japanese men and women. Br J Cancer 2004; 90: 128–34. [DOI] [PMC free article] [PubMed] [Google Scholar]
- 52. Sauvaget C, Lagarde F, Nagano J, Soda M, Koyama K, Kodama K. Lifestyle factors, radiation and gastric cancer in atomic‐bomb survivors (Japan). Cancer Causes Control 2005; 16: 773–80. [DOI] [PubMed] [Google Scholar]
- 53. Tokui N, Yoshimura T, Fujino Y et al. Dietary habits and stomach cancer risk in the JACC Study. J Epidemiol 2005; 15 (Suppl 2): S98–108. [DOI] [PMC free article] [PubMed] [Google Scholar]
- 54. Kurosawa M, Kikuchi S, Xu J, Inaba Y. Highly salted food and mountain herbs elevate the risk for stomach cancer death in a rural area of Japan. J Gastroenterol Hepatol 2006; 21: 1681–6. [DOI] [PubMed] [Google Scholar]
- 55. Haenszel W, Kurihara M, Locke FB, Shimuzu K, Segi M. Stomach cancer in Japan. J Natl Cancer Inst 1976; 56: 265–74. [DOI] [PubMed] [Google Scholar]
- 56. Tajima K, Tominaga S. Dietary habits and gastro‐intestinal cancers: a comparative case–control study of stomach and large intestinal cancers in Nagoya, Japan. Jpn J Cancer Res 1985; 76: 705–16. [PubMed] [Google Scholar]
- 57. Iwasaki J, Ebihira I, Uchida A, Ogura K. Case–control studies of lung cancer and stomach cancer cases in mountain villages and farming‐fishing villages. J Jpn assoc rural med 1992; 41: 92–102. [Google Scholar]
- 58. Watabe K, Nishi M, Miyake H, Hirata K. Lifestyle and gastric cancer: a case–control study. Oncol Rep 1998; 5: 1191–4. [DOI] [PubMed] [Google Scholar]
- 59. Machida‐Montani A, Sasazuki S, Inoue M et al. Association of Helicobacter pylori infection and environmental factors in non‐cardia gastric cancer in Japan. Gastric Cancer 2004; 7: 46–53. [DOI] [PubMed] [Google Scholar]
- 60. Su LJ, Arab L. Salad and raw vegetable consumption and nutritional status in the adult US population: results from the Third National Health and Nutrition Examination Survey. J Am Diet Assoc 2006; 106: 1394–404. [DOI] [PubMed] [Google Scholar]
- 61. Mirvish SS. Effects of vitamins C and E on N‐nitroso compound formation, carcinogenesis, and cancer. Cancer 1986; 58: 1842–50. [DOI] [PubMed] [Google Scholar]
- 62. Correa P. A human model of gastric carcinogenesis. Cancer Res 1988; 48: 3554–60. [PubMed] [Google Scholar]
- 63. Krinsky NI. Effects of carotenoids in cellular and animal systems. Am J Clin Nutr 1991; 53: 238S–46S. [DOI] [PubMed] [Google Scholar]
- 64. Drake IM, Davies MJ, Mapstone NP et al. Ascorbic acid may protect against human gastric cancer by scavenging mucosal oxygen radicals. Carcinogenesis 1996; 17: 559–62. [DOI] [PubMed] [Google Scholar]
- 65. Miglio C, Chiavaro E, Visconti A, Fogliano V, Pellegrini N. Effects of different cooking methods on nutritional and physicochemical characteristics of selected vegetables. J Agric Food Chem 2008; 56: 139–47. [DOI] [PubMed] [Google Scholar]
- 66. Wikipedia . Jangajji. [Cited 9 April 2009.] Available from URL: http://en.wikipedia.org/wiki/Jangajji. San Francisco, California: Wikimedia Foundation, Inc., 2009. [Google Scholar]
- 67. Furihata C, Ohta H, Katsuyama T. Cause and effect between concentration‐dependent tissue damage and temporary cell proliferation in rat stomach mucosa by NaCl, a stomach tumor promoter. Carcinogenesis 1996; 17: 401–6. [DOI] [PubMed] [Google Scholar]
- 68. Tatematsu M, Takahashi M, Fukushima S, Hananouchi M, Shirai T. Effects in rats of sodium chloride on experimental gastric cancers induced by N‐methyl‐N‐nitro‐N‐nitrosoguanidine or 4‐nitroquinoline‐1‐oxide. J Natl Cancer Inst 1975; 55: 101–6. [DOI] [PubMed] [Google Scholar]
- 69. Fox JG, Dangler CA, Taylor NS, King A, Koh TJ, Wang TC. High‐salt diet induces gastric epithelial hyperplasia and parietal cell loss, and enhances Helicobacter pylori colonization in C57BL/6 mice. Cancer Res 1999; 59: 4823–8. [PubMed] [Google Scholar]
- 70. Kodama K, Sumii K, Kawano M et al. Gastric juice nitrite and vitamin C in patients with gastric cancer and atrophic gastritis: is low acidity solely responsible for cancer risk? Eur J Gastroenterol Hepatol 2003; 15: 987–93. [DOI] [PubMed] [Google Scholar]
- 71. Tsugane S, Akabane M, Inami T et al. Urinary salt excretion and stomach cancer mortality among four Japanese populations. Cancer Causes Control 1991; 2: 165–8. [DOI] [PubMed] [Google Scholar]
- 72. Tsugane S. Salt, salted food intake, and risk of gastric cancer: epidemiologic evidence. Cancer Sci 2005; 96: 1–6. [DOI] [PMC free article] [PubMed] [Google Scholar]
- 73. Sutton AJ, Abrams KR, Jones DR, Sheldon TA, Song F. Methods for Meta‐analysis in Medical Research. Chichester, West Sussex: John Wiley and Sons Ltd, 2002. [Google Scholar]
- 74. Felson DT. Bias in meta‐analytic research. J Clin Epidemiol 1992; 45: 885–92. [DOI] [PubMed] [Google Scholar]