

Abstract
Adaphostin is a tyrphostin that was designed to inhibit Bcr/Abl tyrosine kinase by altering the binding site of peptide substrates rather than that of adenosine triphosphate, a known mechanism of imatinib mesylate (IM). However, it has been shown that adaphostin‐mediated cytotoxicity is dependent on oxidant production and does not require Bcr/Abl. We have tested adaphostin against both Philadelphia chromosome (Ph)‐positive (K562, KBM5, KBM5‐R [IM resistant KBM5], KBM7, and KBM7‐R [IM‐resistant KBM7]) and Ph‐negative (OCI/AML2 and OCI/AML3) cells, and against cells from patients with chronic myeloid leukemia (CML) and acute myeloid leukemia (AML). Adaphostin significantly inhibited growth of all cell lines (50% inhibition of cell proliferation [IC50] 0.5–1 µM) except K562 (IC50 13 µM). Ph‐positive IM‐resistant cell lines showed significant cross resistance to adaphostin. Simultaneous or sequential treatment with adaphostin and IM did not exert a synergistic effect in any KBM line. Adaphostin induced superoxide and apoptosis in a dose‐dependent and time‐dependent fashion in both Ph‐positive and Ph‐negative cells. Adaphostin selectively inhibited colony growth of cells from CML (IM‐sensitive and IM‐resistant) and AML patients. Analysis of tyrosine phosphorylated proteins after treatment with adaphostin revealed alternate effects in different cells consistent with the modulation of multiple targets. In conclusion, adaphostin showed significant and selective activity against CML and AML cells and its development for clinical testing is warranted. (Cancer Sci 2006; 97: 952–960)
Chronic myeloid leukemia (CML) is a clonal myeloproliferative disease characterized by a specific chromosomal abnormality, t(9;22), that generates the Philadelphia chromosome (Ph) and the BCR‐ABL oncogene.( 1 ) The fusion gene product is a constitutively active tyrosine kinase that is responsible for the transforming properties of the BCR‐ABL gene.( 2 ) The most studied Bcr/Abl inhibitor is imatinib mesylate (imatinib; Gleevec®, Glivec®; Novartis, Basel, Switzerland), a competitive inhibitor of Bcr/Abl kinase at the adenosine triphosphate (ATP) binding site.( 3 , 4 , 5 ) In clinical trials, almost all patients with chronic‐phase CML respond well to treatment with imatinib, whereas remissions in patients with CML in accelerated or blast phases and Ph‐positive acute lymphoblastic leukemia, although achievable, are transient despite continued treatment.( 6 , 7 ) Moreover, patients with chronic‐phase CML who are initially responsive to imatinib could develop a clinical resistance to this treatment.( 8 ) In order to overcome this significant problem, preclinical and clinical studies of imatinib in combination with conventional cytotoxic agents are ongoing.( 9 ) An alternative therapeutic strategy could be to develop compounds able to inhibit Bcr/Abl using different mechanism other than interference at the ATP binding level, such as altering the binding of specific peptide substrates to the tyrosine kinase.
Tyrphostins are compounds that structurally resemble tyrosine and act as competitive substrate inhibitors for tyrosine kinases in in vitro assays.( 10 ) One of the tyrphostins, AG957, with activity against Bcr/Abl has been studied extensively.( 11 ) Exposure of Ph‐positive K562 cells to micromolar concentrations of this drug resulted in an antiproliferative effect, associated with a dose‐related downregulation of Bcr/Abl levels. The adamantyl derivative of AG957, NSC 680410 or adaphostin, has been shown to be three to four‐fold more potent in downregulating Bcr/Abl and inhibiting colony formation of bone marrow cells derived from CML patients.( 12 ) Mow et al.( 13 ) reported that adaphostin's mode of action involved the induction of apoptosis, which is kinetically distinct from apoptosis induced by imatinib. Treatment of K562 cells with 10 µM adaphostin resulted in decreased Bcr/Abl protein levels in the first 6 h, followed by caspase activation and accumulation of apoptotic cells in less than 12 h, and after 24 h, 90% of the cells were apoptotic and unable to form colonies.( 13 ) Imatinib‐resistant cells remained sensitive to adaphostin and the combination of imatinib and adaphostin had a greater antiproliferative effect on Ph‐positive cells than either agent alone.( 13 ) However, the results of Mow et al.( 13 ) also indicated that adaphostin may not have absolute specificity for cells expressing BCR/ABL as it affected the growth of Ph‐negative leukemia cells as well, as had been observed previously by Losiewicz et al.( 14 ) and Urbano et al.( 15 ) In the present study we attempt to confirm these proposed mechanisms in a panel of CML‐derived and acute myeloid leukemia (AML)‐derived cell lines and in primary cells from patients with myeloid leukemia. The results are discussed in regard to the mechanisms of action attributed to adaphostin in reports published recently.( 16 −22)
Materials and Methods
Drugs
Adaphostin (NSC 680410) was synthesized by the Drug Synthesis and Chemistry Branch, Division of Cancer Treatment and Diagnosis, National Cancer Institute (Bethesda, MD, USA) and stored as a 20 mM stock dilution in dimethyl sulfoxide (DMSO) at −20°C. Imatinib was provided by Novartis and stored as a 10 mM stock dilution in DMSO at −20°C. Cytarabine was purchased from Sigma Chemical Co. (St Louis, MO, USA) and dissolved initially in phosphate‐buffered saline (PBS). Fresh working solutions of each compound were prepared in medium before each experiment.
Cell lines and primary leukemic cells
The Ph‐positive, p210 Bcr/Abl protein‐expressing cell lines KBM5 and KBM7 were established in our laboratory from two patients with blastic‐phase CML.( 23 , 24 ) The KBM5 cells contained multiple copies of the Ph chromosome but lacked the normal c‐ABL. The KBM7 cell line was near haploid. Cell line K562 was obtained from American Type Culture Collection (Manassas, VA, USA). Human AML cell lines OCI/AML2 and OCI/AML3 were kindly provided by Dr Emil J. Freireich (MD Anderson Cancer Center). Both cell lines were established at the Ontario Cancer Center: OCI/AML3 was established from a patient with AML M2 and OCI/AML2 from a patient with erythroleukemia; both cell lines proliferate in the presence of culture medium and fetal calf serum (FCS) without exogenous growth factors.( 25 , 26 ) All cell lines were cultured in Iscove's modified Dulbecco's medium (Invitrogen, Carlsbad, CA, USA) supplemented with 10% FCS at 37°C in an atmosphere of 5% CO2 in air.
The imatinib‐resistant cell lines KBM5‐R and KBM7‐R were generated as described in detail by Scappini et al.( 27 ) They showed a 50% inhibition of cell proliferation (IC50) approximately 20 times higher then the value in the corresponding parental cell line (KBM5 = 0.6 µM vs KBM5‐R = 15.5 µM; KBM7 = 0.3 µM vs KBM7‐R = 5 µM). KBM5‐R cells were shown to have a marginal increase in the BCR‐ABL gene copy number, a modest increase in p210 protein expression, but highly imatinib‐resistant Bcr/Abl tyrosine kinase activity associated with the acquisition of a single C‐T change at ABL nucleotide 944 (T315I).( 27 , 28 ) In contrast, KBM7‐R cells were found to have no mutations within the ATP‐binding domain of Bcr/Abl, but did have amplification of the BCR/ABL gene and increased expression levels of the Bcr/Abl p210 protein, with decreased inhibition of Bcr/Abl tyrosine kinase activity by imatinib, and loss of apoptotic response to imatinib.( 27 )
Primary leukemic cells were obtained from peripheral blood or bone marrow samples from patients with CML and AML seen at the MD Anderson Cancer Center, after informed consent was signed. Mononuclear cells were isolated using Ficoll‐Paque (density 1.077 g/mL; Amersham, Arlington Heights, IL, USA). CML patient samples were not manipulated further and may have contained a proportion of normal cells. AML patient samples contained >80% of blasts.
MTS assay
In vitro growth inhibition/cytotoxic effect of adaphostin on leukemic cells was determined by measuring MTS dye (CellTiter 96® Aqueous One Solution Reagent; Promega, Madison, WI, USA) absorbance by living cells. Briefly, cells were seeded in triplicate in 96‐well microtiter plates at a concentration of 0.4 × 10⁶ cells/mL for cell lines and 1.0 × 10⁶ cells/mL for primary leukemic cells, in their respective media (StemSpan CC100 [Stemcell Technologies, Vancouver, Canada] was used for primary leukemic cells). After exposure to the drugs at increasing concentrations for 24, 48 or 72 h, 20 µL of MTS solution was added to each well, the plates were incubated for an additional 3 h at 37°C, and absorbance was measured at 490 nm.
Clonogenic assay
Mononuclear cells were plated in 35 × 10 mm dishes at 1 × 10⁵ cells/mL in ‘complete’ methylcellulose medium with recombinant cytokines (Methocult GF H4434; Stemcell Technologies). Adaphostin was added at increasing concentrations. Numbers of colony forming units (aggregates composed of more than 50 cells) were counted after 8 days of culture at 37°C in a fully humidified atmosphere with 5% CO2 in air. All clonogenic assays were done in duplicate. The adaphostin concentration resulting in an IC50 was determined in relation to the percentage of colony growth in control wells (no drugs added).
Caspase‐3/7 assay
Caspase activity was measured with the Apo‐One™ Homogeneous Caspase 3/7‐assay kit (Promega). This assay uses the fluorogenic substrate rhodamine 110, bis‐(N‐CBZ‐l‐aspartyl‐glutamyl‐l‐valyl‐l‐aspartic acid amide) (Z‐DEVD‐R110). Caspase activity was evaluated by detection of the free rhodamine 110 group upon sequential cleavage and removal of the DEVD peptides by caspase‐3/7. Cleavage of the fluorogenic caspase 3/7 substrate Z‐DEVD‐R110 was carried out according to the manufacturer's instructions, using a Fluorostar plate reader and excitation and emission wavelengths of 499 nm and 521 nm, respectively. Briefly, cells were seeded at a density of 1.5 × 10⁶ cells/mL and incubated in the presence or absence of the drug for 18 h and 48 h. Homogeneous caspase‐3/7 reagent was added to an aliquot of cell culture in a 96‐well plate and the reaction mixture was incubated for 2 h at room temperature before measurement of fluorescence. Results are expressed as relative fluorescence light units.
Analysis of apoptosis by flow cytometry
Induction of apoptosis was evaluated by flow cytometry using annexin V binding/propidium iodide (PI) staining, detection of caspase 3 and caspase 3‐like activities, and analysis of the mitochondrial membrane potential. Following treatment of cells in culture with adaphostin, for annexin V/PI study, cells were washed in PBS and incubated with a 1 : 100 solution of fluorescein‐isothiocyanate‐conjugated annexin V (Trevigen, Gaithersburg, MD, USA) for 15 min in the dark. Cells were then washed and analyzed by flow cytometry after the addition of PI. Alternatively, cells were labeled only with PI for quantitation of the subdiploid cell population, indicating DNA fragmentation. For measurement of the mitochondrial membrane potential, cells were washed in PBS, stained with MitoTracker dyes in submicromolar concentrations (MitoTracker Red CMXRos and MitoTracker Green FM; Molecular Probes, Eugene, OR, USA) and incubated for 1 h at 37°C in the dark. Cells were then washed and analyzed by flow cytometry. The fluorogenic substrate PhiPhiLux G1D2 (Oncomunin, Gaithersburg, MD, USA) was used for detection and measurement of caspase 3 and caspase 3‐like activities in living cells. Cells were washed in PBS, resuspended in 50 µL substrate solution and incubated for 1 h at 37°C in the dark. Cells were washed and PI was added a few minutes before flow cytometric analysis.
Western blotting analysis
After 3 and 6 h of incubation with different concentrations of adaphostin (2 and 5 µM), cells were lysed in TENN buffer (50 mM Tris‐HCl [pH 7.4], 150 mM NaCl supplemented with 1 mM phenylmethylsulfonylfluoride, 2 µg/mL leupeptine, 2 µg/mL pepstatin and 50 IU/mL of aprotinin) for 60 min on ice with frequent vortexing. Lysates were spun in a microcentrifuge at 20 000 g for 50 min at 4°C. Protein concentration was determined using the Bradford method, and 200 µg of cell extract was separated electrophoretically on a 9.5% sodium dodecyl sulfate‐polyacrylamide gel and transferred to nitrocellulose paper overnight. The nitrocellulose paper was blocked with 5% non‐fat milk in PBS containing 0.01% Tween‐20 for 5 h at room temperature. The blot was then incubated overnight at 4°C with mouse antiphosphotyrosine (Upstate USA, Lake Placid, NY, USA) diluted 1 : 2000 in PBS containing 2.5% bovine serum albumin (BSA), 2.5% non‐fat milk, and 0.01% Tween‐20. After washing the blot with PBS−0.01% Tween‐20, it was incubated with sheep horseradish peroxidase‐conjugated antibody (Amersham) in 1% non‐fat milk and 0.01% Tween‐20 at room temperature for 80 min. Detection was carried out by electrochemiluminescence (ECL; Amersham). The membrane was then stripped under conditions recommended by the manufacturer, blocked and reprobed with mouse anti‐β‐actin antibody (Sigma) to assure equal loading of the protein. For immunoprecipitation analysis, protein lysate (obtained as described above) was mixed with 30 µL of agarose‐A/G (Santa Cruz, Santa Barbara, CA, USA) with mouse antiphosphotyrosine clone 4G (Upstate USA). After mixing for 16 h at 4°C the complex was washed four times with TENN buffer, followed by three washes in PBS, and 50 µL of 2× loading buffer was added to elute the proteins from the agarose column. After boiling for 5 min in a heat block, 20 µL of immunoprecipitated protein was separated on a 9.5% sodium dodecyl sulfate‐polyacrylamide gel and western blotting was carried out as above. After blocking, the blot was probed with 0.5 µg/mL of rabbit anti‐Crk‐L antibody (Santa Cruz), followed by stripping and reprobing with rabbit anti‐Cbl antibody (Santa Cruz) in 2.5% BSA and 2.5% non‐fat milk overnight at 4°C. After washing the blot in PBS–Tween‐20 it was incubated with horseradish peroxidase‐conjugated donkey antirabbit antibody (Amersham) in 1% non‐fat milk for 80 min. Detection of reactive bands was carried out as described above.
Detection of intracellular superoxide in leukemic cells
To evaluate superoxide production in leukemic cells exposed to adaphostin and its extinction with the use of an antioxidant, cells were treated with 2 or 5 µM adaphostin for the indicated times with or without addition of 24 mM N‐acetyl‐l‐cysteine (NAC; Sigma Aldrich). Twenty minutes before cell harvesting, 10 µM dihydroethidium (Molecular Probes) was added to cultures. The cells were then washed in 2 mL of Ca2+‐free PBS, resuspended in 0.5 mL of Ca2+‐free PBS and analyzed immediately for ethidium fluorescence intensity by flow cytometry.
Statistical evaluation
The Mann–Whitney non‐parametric test was used to compare data between two non‐dependent variables.
Results
Effect of adaphostin on the growth of human myeloid leukemia cell lines
The effect of adaphostin was tested initially using the MTS assay against a panel of four myeloid cell lines: two CML lines (KBM5 and KBM7) and two AML lines (OCI/AML2 and OCI/AML3). The Ph‐positive, p210 Bcr/Abl protein‐expressing cell lines KBM5 and KBM7 were established from two patients with blastic‐phase CML.( 23 , 24 ) The KBM5 cells contained multiple copies of the Ph chromosome but lacked normal c‐ABL. The KBM7 cell line was near haploid. The human AML cell lines OCI/AML2 and OCI/AML3 were established from patients with erythroleukemia and AML M2, respectively. Despite the diverse backgrounds of the lines, the IC50 ranged from 0.5 to 1.0 µM for all cell lines tested (Fig. 1A). Of note, K562 cells were less sensitive to adaphostin treatment than the other cell lines tested in our experiments. This is in agreement with data reported previously, suggesting that significant adaphostin‐induced cytotoxicity occurs at doses above 5–10 µM in K562 cells,( 16 ) whereas this effect is more rapidly apparent and occurs at lower concentrations in other Bcr/Abl‐positive cells( 16 ) as well as in AML‐derived( 18 ) and chronic lymphocytic leukemia (CLL)‐derived cells.( 19 )
Figure 1.
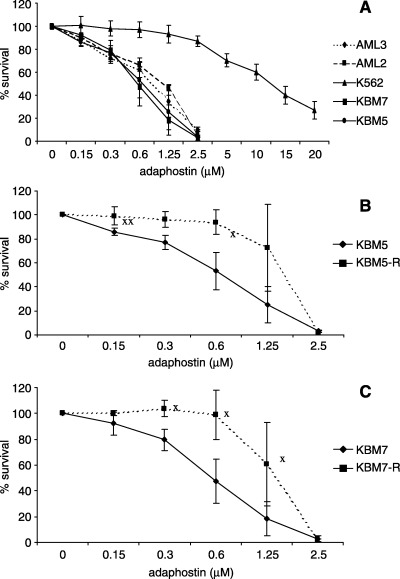
Antiproliferative/cytotoxic activity of adaphostin against chronic myeloid leukemia (CML) and acute myeloid leukemia (AML) cell lines. Cells were incubated for 72 h with adaphostin and were then assessed for viability using MTS dye. (A) The effect of adaphostin on CML lines (imatinib‐sensitive) K562, KBM5 and KBM7, and AML lines AML2 and AML3. (B,C) The effect of adaphostin on imatinib‐sensitive (KBM5 and KBM7) and imatinib‐resistant (KBM5‐R and KBM7‐R) cell lines. Results shown are a summary of four independent experiments, each done in triplicate. XStatistically significant difference (P < 0.03).
Cell viability was tested using the MTS assay on two imatinib‐resistant cell lines, KBM5‐R and KBM7‐R, and the results showed significant cross resistance to adaphostin (Fig. 1B,C) with an IC50 of approximately 1.3 µM for both cell lines at 72 h of exposure. Shortening of the incubation time to 48 or 24 h did not result in a significant decrease in efficacy in any of the cell lines tested (data not shown).
Induction of apoptosis by adaphostin
To assess whether the effects of adaphostin seen in the MTS assay were associated with the induction of apoptosis, cell lines were incubated with adaphostin at increasing concentrations up to 5 µM, and activated caspase 3/7 levels were measured after 18 and 48 h of culture. In all cell lines at 18 h, elevated levels of caspase 3/7‐positive cells were detected in a dose‐dependent manner, and were essentially unchanged or slightly decreased at 48 h (examples shown in Fig. 2A). To confirm that the cytotoxic effect of adaphostin is mediated by activation of apoptotic pathways, KBM5 cells were cultured with adaphostin at increasing concentrations for 24 h and then changes in the mitochondrial membrane potential, levels of caspase 3 and 3‐like activities, and annexin V binding were evaluated by flow cytometry. Results are depicted in Fig. 2B. Treatment resulted in dose‐related changes of mitochondrial membrane potential, associated with activation of caspase 3, and acquisition of annexin V positivity.
Figure 2.
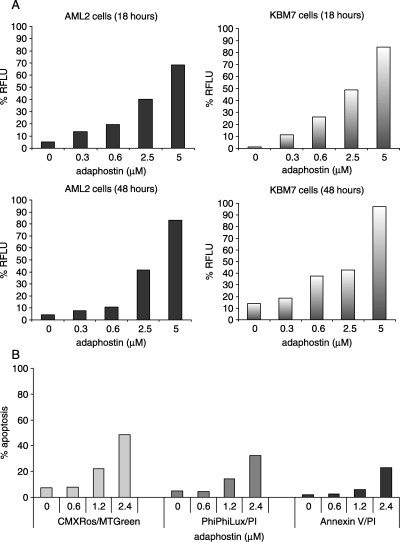
(A) Induction of apoptosis in AML2 and KBM7 cells by adaphostin. Cells were cultured with adaphostin for the times indicated. Apoptosis was then assessed using the caspase 3/7 activity fluorogenic assay. Results shown are representative of two independent experiments and are expressed as relative fluorescence light units (RFLU). (B) Induction of apoptosis in KBM5 cells by adaphostin treatment. KBM5 cells were incubated in the presence of different concentrations of adaphostin for 24 h. Changes in mitochondrial membrane potential (CMXRos/MTGreen), level of caspase 3 and caspase 3‐like activities (PhiPhiLux/PI), and in plasma membrane (annexin V/PI) were evaluated. Results shown are representative of three independent experiments.
Imatinib exerts cytostatic effects in KBM5 cells, with cell cycle arrest in G0/G1 phase, without induction of apoptosis.( 27 ) In KBM7 cells, in contrast, imatinib causes activation of apoptotic pathways culminating in cell death.( 27 ) KBM5 and KBM7 cells were assessed for annexin V binding following 48 h incubation in the presence of imatinib or adaphostin. As reported previously, imatinib induced apoptosis in a dose‐dependent manner only in KBM7 cells (Fig. 3A), whereas adaphostin was able to induce apoptosis in both cell lines (Fig. 3B).
Figure 3.
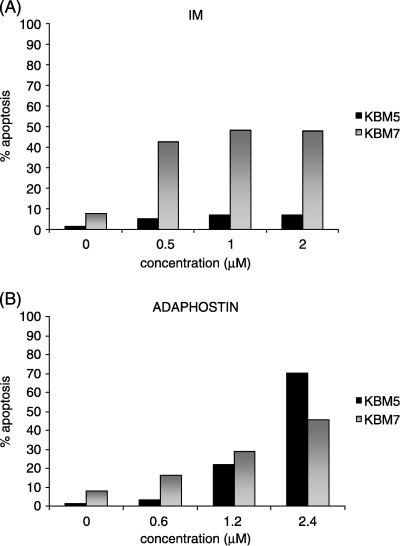
Induction of apoptosis after imatinib or adaphostin exposure in Ph‐positive cell lines. KBM5 and KBM7 cells were assessed for annexin V binding after 48 h incubation in the presence of (A) imatinib or (B) adaphostin. Results shown are representative of four independent experiments.
Effect of adaphostin in combination with imatinib on the growth of human myeloid leukemia cell lines
Further experiments assessed whether adaphostin and imatinib in combination have synergistic effects in Ph‐positive imatinib‐sensitive and imatinib‐resistant cell lines. For each cell line, increasing concentrations of adaphostin were combined with a dose of imatinib that caused approximately 20% cell death (IC20). After 72 h of exposure, cell proliferation was evaluated by MTS assay. Results are shown in Fig. 4A. The combination of adaphostin and imatinib resulted in an additive effect in all four lines tested. DNA fragmentation was also quantitated in cell lines treated with adaphostin and imatinib by using PI labeling and flow cytometric evaluation (Fig. 4B). These data corroborated the MTS data in that the effect in KBM5, KBM7, KBM5‐R and KBM7‐R was additive rather than synergistic. In contrast, the combination of adaphostin and imatinib elicited a strong synergistic response in K562 cells.
Figure 4.
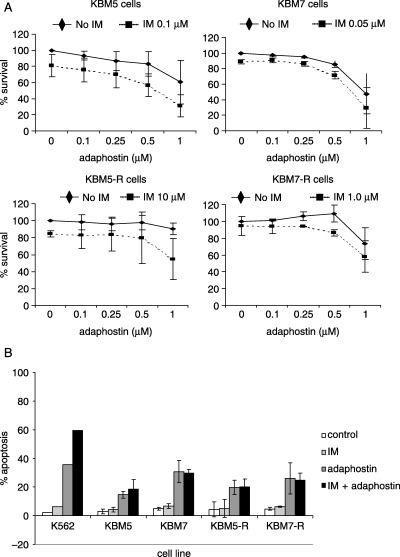
Effect of imatinib and adaphostin combination treatment on chronic myeloid leukemia (CML)‐derived cell lines. (A) Imatinib‐sensitive KBM5 and KBM7, and imatinib‐resistant KBM5‐R and KBM7‐R cells were cultured in the presence of fixed dose of imatinib (IC20 for corresponding cell line) and increasing concentrations of adaphostin. Effect on survival was evaluated after 72 h by MTS assay. Result shown are a summary of three independent experiments, each carried out in triplicate. (B) Different CML cell lines were cultured with adaphostin and imatinib for 24 h, stained with propidium iodide and assessed for DNA fragmentation. The doses used were: K562, 10 µM imatinib and 5 µM adaphostin; KBM5 and KBM7, 0.05 µM imatinib and 0.5 µM adaphostin; KBM5‐R and KBM7‐R, 5 µM imatinib and 1 µM adaphostin. Result shown are a summary of three independent experiments, each carried out in triplicate (except for K562, which is representative of two independent experiments).
Effect of adaphostin on the growth of primary patient leukemic cells
Bone marrow mononuclear cells from CML and AML patients were examined for the ability to form colonies in the presence of adaphostin; cells from normal control bone marrows were tested in parallel. Experiments conducted using leukemic cells demonstrated that the number of colonies decreased in a dose‐dependent manner (representative examples are shown in Fig. 5A,B); these included samples from patients with newly diagnosed AML, CML in blastic phase, and chronic phase (CP)‐CML, as well as from patients with relapsed AML and CML in chronic phase resistant to therapy with imatinib. In contrast, the concentrations of adaphostin used had no significant effect on the colony growth of normal bone marrow cells (Fig. 5A). Adaphostin was also effective in killing AML cells in short‐term MTS assay (Fig. 5C).
Figure 5.
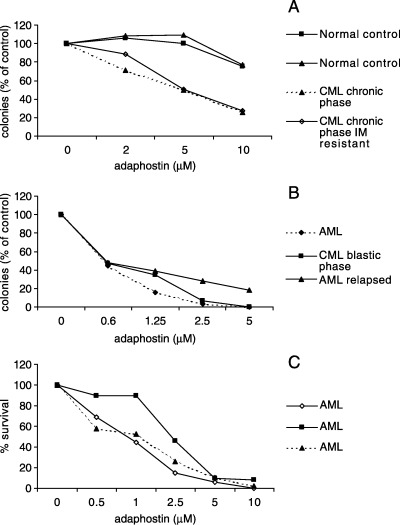
Effects of adaphostin on the growth and survival of primary chronic myeloid leukemia (CML) and acute myeloid leukemia (AML) cells. (A,B) Mononuclear cells from CML and AML patients, as well as normal donors, were plated in methylcellulose with the indicated concentrations of adaphostin. After 8 days, colonies containing more than 50 cells were counted. Data represent the percentage of colonies (compared with the number of colonies formed by untreated cells). (C) In addition, mononuclear cells from AML patients were incubated for 72 h with the indicated concentrations of adaphostin and were then assessed for their viability using MTS dye.
Effect of adaphostin on the phosphorylation of cellular proteins in leukemic cells
As adaphostin was originally developed as a kinase inhibitor, we sought to determine whether adaphostin's ability to inhibit kinase signaling was relevant to the cytotoxic effects seen in KBM and AML cell lines. KBM5 and OCI/AML3 cells were incubated with adaphostin at concentrations of either 2 or 5 µM for 3 or 6 h. Cell lysates were examined by western blot analysis with an antiphosphotyrosine antibody. Adaphostin caused time‐dependent and dose‐dependent modulation in phosphorylation of numerous tyrosine polypeptides. However, adaphostin treatment caused different phosphorylation patterns in these two cell lines (Fig. 6), which did not correlate with the extent of cell killing seen in previous experiments.
Figure 6.
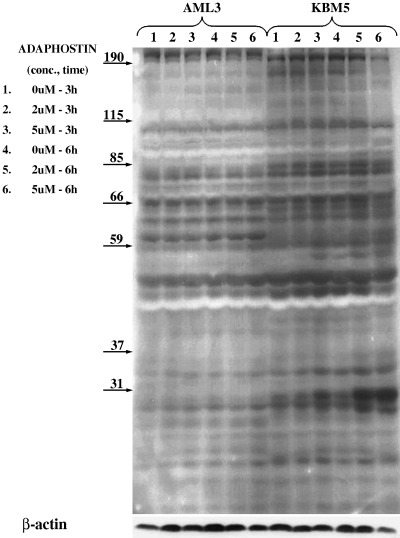
Effect of adaphostin on the phosphorylation of tyrosine polypeptides in leukemic cells. KBM5 (Philadelphia chromosome [Ph]‐positive) and AML3 (Ph‐negative) cells were incubated with adaphostin at concentrations of 2 or 5 µM for 3 or 6 h, lysed and cell lysates were examined by western blot analysis with antiphosphotyrosine antibody. Numbers on arrows indicate the specific molecular weights of the proteins.
Next we evaluated the effects of adaphostin on specific proteins known to be downstream of Bcr/Abl, which may represent downstream mediators of adaphostin‐induced cytotoxicity. K562, KBM5 and OCI/AML3 cells were incubated with adaphostin at concentration of 2 or 5 µM for 3 or 6 h, lysed and cell lysates were examined by immunoprecipitation using specific antibodies for Crk‐L and Cbl. In repeated experiments, whereas both proteins were detectable in K562 cells, neither Crk‐L nor Cbl were detectable in KBM5 and OCI/AML3 cell lysates (Fig. 7). Levels of Bcl‐2 were examined in the same lysates. Bcl‐2 protein expression was uniform across AML and KBM5 cells and did not vary with adaphostin exposure.
Figure 7.
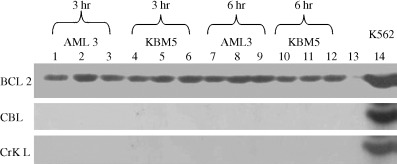
Effect of adaphostin on Bcl‐2, Crk‐L and Cbl. KBM5 and AML3 cells were exposed to adaphostin for 0, 3 or 6 h. Lysates were obtained and exposed to western blotting using antibodies directed against Bcl‐2, Crk‐L or Cbl. Neither KBM5 nor AML3 cell lines expressed Crk‐L or Cbl, suggesting that adaphostin‐mediated cytotoxicity observed in both cell lines was not mediated via inhibition of Bcr‐Abl tyrosine kinase activity. K562 cell lysates were used as a positive control for Crk‐L and Cbl expression. No significant variation in the expression of Bcl‐2 was noted in any cell line at the dose range tested. Lines 1, 4, 7 and 10 are control, no drug exposure, and samples; lines 2, 5, 8 and 11 are samples exposed to 2 µM of adaphostin; lines 3, 6, 9 and 12 are samples exposed to 5 µM of adaphostin; line 13 is negative control and line 14 is positive control (K562 cells).
Adaphostin causes superoxide production in leukemic cells
Intracellular superoxide and hydrogen peroxide generation have been reported to be critical events in the mechanism of action of adaphostin against chronic and acute leukemia cells. It is now well established that adaphostin does not increase reactive oxygen species (ROS) production in granulocyte colony‐forming units (CFU‐G) obtained from healthy control subjects, but rather, this effect is circumscribed to leukemic cells.( 13 , 20 ) Based on these data, we measured the production of superoxide in KBM5 and OCI/AML3 cells treated with 2 or 5 µM of adaphostin for up to 6 h, with or without the addition of an antioxidant, N‐acetyl‐cysteine (NAC). Adaphostin was able to induce superoxide in both leukemic cell lines in a dose‐dependent and time‐dependent manner. The production of superoxide was significantly impaired in the presence of the antioxidant NAC (Fig. 8).
Figure 8.
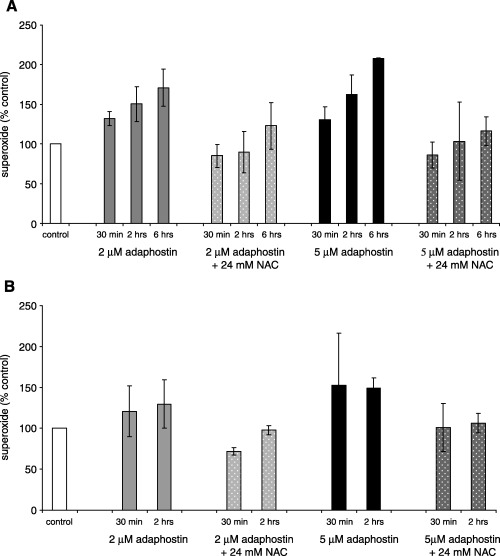
Effect of adaphostin on superoxide production in leukemic cells. (A) AML3 and (B) KBM5 cells were incubated with 2 or 5 µM adaphostin alone or in combination with 24 mM N‐acetyl‐cysteine (NAC) for the time indicated. Superoxide production was assessed using dihydroethidium (DHE) and expressed as percentage of untreated control. Results shown are a summary of three independent experiments.
Discussion
The present study evaluated the activity of adaphostin, a novel tyrosine kinase inhibitor,( 12 , 13 , 20 ) against a series of myeloid leukemic cells, including both cell lines and patient‐derived primary cells. Adaphostin affected leukemia cells to an equal extent, regardless of the presence or absence of the Ph chromosome (i.e. CML or AML cells, respectively): two Ph‐positive cell lines, KBM5 and KBM7, and two Ph‐negative cell lines, OCI/AML2 and OCI/AML3, had similar IC50 in short‐term cultures at approximately 0.5–1.0 µM. We also confirmed previous observations in the Ph‐positive cell line K562 of an IC50 of approximately 12–13 µM. 6 6( 13 ) If Bcr/Abl was the only target in K562 cells then the lesser activity of adaphostin against this cell line might be explained by its hyperdiploidy with consequent overexpression of the Bcr/Abl tyrosine kinase activity. However, approximately 75% of KBM5 cells have four to eight BCR/ABL fusion signals by fluorescence in situ hybridization (FISH) analysis,( 27 ) and yet the cells were highly sensitive to adaphostin. The results would therefore suggest that adaphostin acts against additional targets in Ph‐positive cells. Induction of ROS is one possible mechanism, as shown in Fig. 8 and reported by others.( 16 , 17 , 18 ) The differential sensitivity of these Ph‐positive cells to adaphostin may allow further elucidation of it's mechanism as it can be contrasted in relatively sensitive and resistant cells (e.g. KBM5 vs K562 cells) and is underway.
Initial observations by Mow et al.( 13 ) already raised the possibility that the mechanism of action of adaphostin does not merely involve inhibition of Bcr/Abl. Compared to imatinib, adaphostin had a more rapid rate of induction of apoptosis, but was slower at inhibiting Bcr/Abl kinase activity. Imatinib induced the downregulation of BcL‐XL and Mcl‐1 via inhibition of the STAT5 pathway, whereas after treatment with adaphostin these two antiapoptotic proteins were increased transiently, then downregulated after caspase activation, without significant involvement of STAT5 phosphorylation.( 13 ) Similar proapoptotic effects and downregulation of the levels of antiapoptotic proteins such as Bcl‐2 have been described recently in B cells from patients with CML.( 19 )
Whereas we have confirmed that adaphostin action occurs over a short period of time (within 24 h) and that it acts via induction of apoptosis (Fig. 2), likely secondary to the production of ROS, we further support the notion that imatinib and adaphostin have different modes of action in Ph‐positive cells. In KBM5 cells the inhibition of Bcr/Abl kinase activity by imatinib is cytostatic, leading to cell cycle arrest in G0/G1 phase, without induction of apoptosis.( 27 ) In contrast, after treatment with adaphostin KBM5 cells show clear apoptotic features, namely drops in mitochondrial membrane potential and activation of caspases (2, 3).
Utilizing recently developed imatinib‐resistant subclones of KBM5 and KBM7 cell lines,( 27 ) we have observed significant cross resistance between imatinib and adaphostin (Fig. 1B,C). Imatinib resistance in KBM7‐R cells is sustained by amplification of the BCR/ABL gene, whereas in KBM5‐R cells a point mutation in the ATP pocket of Bcr/Abl is responsible for the resistant phenotype.( 27 , 28 ) Apparently, the different mechanisms of resistance to imatinib in these two cell lines had no bearing on their response to adaphostin, as they were equally sensitive to adaphostin (IC50 approximately 1.3 µM in both cell lines). It is plausible to speculate that acquisition of adaphostin resistance in the imatinib‐resistant cell lines is the result of ROS alterations as they acquire imatinib resistance; further work is underway to address this issue. However, we found no cross resistance between imatinib and adaphostin in patient samples (Fig. 5A).
We were unable to demonstrate synergistic activity between imatinib and adaphostin (Fig. 4), as reported previously in Ph‐positive( 13 ) and Ph‐negative cells.( 19 ) Lack of synergy of adaphostin and imatinib in KBM5 and KBM7 cells, and their imatinib‐resistant variants, may be explained by several pieces of data. Differential activation of downstream Bcr/Abl substrates may account for differences seen in imatinib sensitivity and lack of ability to synergize with adaphostin. Our data show that Crk‐L and Cbl protein expression is absent in KBM5 cells whereas there is abundant expression in K562 cell lines (Fig. 7). The fact that adaphostin is cytotoxic against both cell lines and that the expression of Crk‐L and Cbl is absent in KBM5 cells suggests that adaphostin exerts cytotoxic effects through Bcr/Abl‐independent mechanisms. Whereas our data do not indicate that the presence of Cbl and/or Crk‐L is required for synergy between adaphostin and imatinib reported in K562 cells,( 13 ) it is clear that the Bcr/Abl kinase signaling cascade is not identical in KBM5 and K562 cells. Furthermore, the KBM and AML cells were far more sensitive than the K562 cells to adaphostin. Dissection of the signaling pathways activated in these lines may provide insight into the differences in sensitivity as compared to the K562 cell line. The synergism exhibited by the combination of adaphostin and imatinib in K562 cells reported by Mow et al. ( 13 ) and Chandra et al.( 18 ) suggests that these agents may result in improved clinical responses in some patients with advanced CML, or in those resistant to single‐agent tyrosine kinase inhibitor therapy. In addition, adaphostin has proved synergistic with other agents such as proteasome inhibitors (MG‐132 and bortezomib) through a ROS‐dependent mechanism against human leukemia cells,( 20 ) including imatinib‐resistant hematopoietic cells expressing mutant forms of Bcr/Abl.( 21 )
Our observations strongly support the hypothesis that proteins other than Bcr/Abl kinase represent the molecular targets of adaphostin. Furthermore, Cbl and Crk‐L are dispensable for adaphostin activity. Although adaphostin was reported to primarily inhibit cellular protein synthesis,( 18 ) recent work by Chandra et al.( 16 , 18 ) has determined ROS production and subsequent induction of apoptosis as its primary mode of action. These results are confirmed in part in this study. In addition, the analysis of tyrosine‐phosphorylated proteins after adaphostin exposure in Ph‐positive and Ph‐negative cells (Fig. 6) showed complex yet different patterns, suggesting that multiple signal transduction pathways might be affected secondary to ROS production, as suggested recently by Yu et al.,( 17 ) and may differ in different leukemic cells. In this regard, a recent report suggests that induction of apoptosis by adaphostin in human leukemia cells proceeds through the mitogen‐activated protein kinase (MAPK) pathway, involving extracellular signal‐regulated protein kinase (ERK1/2), c‐Jun N‐terminal kinase (JNK) and p38 MAPK.( 22 )
Adaphostin was equally effective in Ph‐negative cells and Ph‐positive cells. Cytotoxic activity against OCI/AML2 and OCI/AML3 cell lines seen in short‐term MTS assays (Fig. 1A) was associated with the induction of apoptosis in a time‐dependent and dose‐dependent fashion. This was mechanistically identical to the effect of adaphostin on Ph‐positive cells (2, 3). Our results extend recent observation of adaphostin's cytotoxic/pro‐apoptotic activity against T‐cell lymphoblastic leukemia, and brain tumor cell lines.( 29 , 30 ) We also show its activity against primary AML patient‐derived leukemic cells in both short‐term and long‐term (clonogenic) assays (Fig. 5B,C), an extension of recent findings by Chandra et al.( 16 , 18 ) Most importantly, however, adaphostin showed selective activity against leukemic cells at the doses tested, with no significant influence on the colony growth of normal donor cells (Fig. 5A). This selectivity of action surely represents additional stimulus to bring adaphostin forward and test it in a clinical setting.
References
- 1. Faderl S, Talpaz M, Estrov Z, O’Brien S, Kurzrock R, Kantarjian HM. The biology of chronic myeloid leukemia. New Engl J Med 1999; 341: 164–72. [DOI] [PubMed] [Google Scholar]
- 2. Daley GQ, Van Etten RA, Baltimore D. Induction of chronic myelogenous leukemia in mice by the P210bcr/abl gene of the Philadelphia chromosome. Science 1990; 247: 824–30. [DOI] [PubMed] [Google Scholar]
- 3. Druker BJ, Tamura S, Buchdunger E et al. Effects of a selective inhibitor of the Abl tyrosine kinase on the growth of Bcr‐Abl positive cells. Nat Med 1996; 2: 561–6. [DOI] [PubMed] [Google Scholar]
- 4. Beran M, Cao X, Estrov Z et al. Selective inhibition of cell proliferation and BCR‐ABL phosphorylation in acute lymphoblastic leukemia cells expressing Mr 190 000 BCR‐ABL protein by a tyrosine kinase inhibitor (CGP‐57148). Clin Cancer Res 1998; 4: 1661–72. [PubMed] [Google Scholar]
- 5. Deininger MW, Goldman JM, Lydon N, Melo JV. The tyrosine kinase inhibitor CGP57148B selectively inhibits the growth of BCR‐ABL‐positive cells. Blood 1997; 90: 3691–8. [PubMed] [Google Scholar]
- 6. Druker BJ, Talpaz M, Resta DJ et al. Efficacy and safety of a specific inhibitor of the BCR‐ABL tyrosine kinase in chronic myeloid leukemia. New Engl J Med 2001; 344: 1031–7. [DOI] [PubMed] [Google Scholar]
- 7. Kantarjian HM, Talpaz M. Imatinib mesylate: clinical results in Philadelphia chromosome‐positive leukemias. Seminars Oncol 2001; 28: 9–18. [PubMed] [Google Scholar]
- 8. Marcucci G, Perrotti D, Caligiuri MA. Understanding the molecular basis of imatinib mesylate therapy in chronic myelogenous leukemia and the related mechanisms of resistance. Commentary re: A. N. Mohamed et al., The effect of imatinib mesylate on patients with Philadelphia chromosome‐positive chronic myeloid leukemia with secondary chromosomal aberrations. Clin Cancer Res 2003; 9: 1333–7, Clin Cancer Res 2003; 9: 1248–52. [PubMed] [Google Scholar]
- 9. Scappini B, Onida F, Kantarjian HM et al. In vitro effects of STI 571‐containing drug combinations on the growth of Philadelphia‐positive chronic myelogenous leukemia cells. Cancer 2002; 94: 2653–62. [DOI] [PubMed] [Google Scholar]
- 10. Kaur G, Gazit A, Levitzki A, Stowe E, Cooney DA, Sausville EA. Tyrphostin induced growth inhibition: correlation with effect on p210bcr‐abl autokinase activity in K562 chronic myelogenous leukemia. Anticancer Drugs 1994; 5: 213–22. [PubMed] [Google Scholar]
- 11. Kaur G, Sausville EA. Altered physical state of p210bcr‐abl in tyrphostin AG957‐treated K562 cells. Anticancer Drugs 1996; 7: 815–24. [DOI] [PubMed] [Google Scholar]
- 12. Svingen PA, Tefferi A, Kottke TJ et al. Effects of the bcr/abl kinase inhibitors AG957 and NSC 680410 on chronic myelogenous leukemia cells in vitro . Clin Cancer Res 2000; 6: 237–49. [PubMed] [Google Scholar]
- 13. Mow BM, Chandra J, Svingen PA et al. Effects of the Bcr/abl kinase inhibitors STI571 and adaphostin (NSC 680410) on chronic myelogenous leukemia cells in vitro . Blood 2002; 99: 664–71. [DOI] [PubMed] [Google Scholar]
- 14. Losiewicz MD, Kaur G, Sausville EA. Different early effects of tyrphostin AG957 and geldanamycins on mitogen‐activated protein kinase and p210cbl phosphorylation in anti CD‐3‐stimatinibulated T‐lymphoblasts. Biochem Pharmacol 1999; 57: 281–9. [DOI] [PubMed] [Google Scholar]
- 15. Urbano A, Gorgun G, Foss F. Mechanisms of apoptosis by the tyrphostin AG957 in hematopoietic cells. Biochem Pharmacol 2002; 63: 689–92. [DOI] [PubMed] [Google Scholar]
- 16. Chandra J, Hackbarth J, Le S et al. Involvement of reactive oxygen species in adaphostin‐induced cytotoxicity in human leukemia cells. Blood 2003; 102: 4512–19. [DOI] [PubMed] [Google Scholar]
- 17. Yu C, Rahmani M, Almenara J, Sausville EA, Dent P, Grant S. Induction of apoptosis in human leukemia cells by the tyrosine kinase inhibitor adaphostin proceeds through a RAF‐1/MEK/ERK‐ and AKT‐dependent process. Oncogene 2003; 23: 1364–76. [DOI] [PubMed] [Google Scholar]
- 18. Chandra J, Tracy J, Loegering D et al. Adaphostin‐induced oxidative stress overcomes BCR/ABL mutation‐dependent and ‐independent imatinib resistance. Blood 2006; 107: 2501–6. [DOI] [PMC free article] [PubMed] [Google Scholar]
- 19. Shanafelt TD, Lee YK, Bone ED et al. Adaphostin‐induced apoptosis in CLL B cells is associated with induction of oxidative stress and exhibits synergy with fludarabine. Blood 2005; 105: 2099–106. [DOI] [PubMed] [Google Scholar]
- 20. Dasmahapatra G, Rahmani M, Dent P et al. The tyrphostin adaphostin interacts synergistically with proteasome inhibitors to induce apoptosis in human leukemia cells through a reactive oxygen species (ROS)‐dependent mechanism. Blood 2006; 107: 232–40. [DOI] [PMC free article] [PubMed] [Google Scholar] [Retracted]
- 21. Dasmahapatra G, Nguyen TK, Dent P et al. Adaphostin and bortezomib induce oxidative injury and apoptosis in imatinib mesylate‐resistant hematopoietic cells expressing mutant forms of Bcr/Abl. Leuk Res 2006. Feb. 13; [Epub ahead of print]. [DOI] [PubMed] [Google Scholar]
- 22. Yu C, Rahmani M, Almenara J et al. Induction of apoptosis in human leukemia cells by the tyrosine kinase inhibitor adaphostin proceeds through a RAF‐1/MEK/ERK‐ and AKT‐dependent process. Oncogene 2004; 23: 1364–76. [DOI] [PubMed] [Google Scholar]
- 23. Beran M, Pisa P, O’Brien S et al. Biological properties and growth in SCID mice of a new myelogenous leukemia cell line (KBM‐5) derived from chronic myelogenous leukemia cells in the blastic phase. Cancer Res 1993; 53: 3603–10. [PubMed] [Google Scholar]
- 24. Andersson BS, Beran M, Pathak S, Goodacre A, Barlogie B, McCredie KB. Ph‐positive chronic myeloid leukemia with near‐haploid conversion in vivo and establishment of a continuously growing cell line with similar cytogenetic pattern. Cancer Genet Cytogenetics 1987; 24: 335–43. [DOI] [PubMed] [Google Scholar]
- 25. Wang C, Curtis JE, Minden MD, McCulloch EA. Expression of a retinioic acid receptor gene in myeloid leukemia cells. Leukemia 1981; 3: 264–9. [PubMed] [Google Scholar]
- 26. Papayannopoulou T, Nakamoto B, Kurachi S, Tweeddale M, Messner H. Surface antigenic profile and globin phenotype of two new human erythroleukemia lines: characterization and interpretations. Blood 1988; 72: 1029–38. [PubMed] [Google Scholar]
- 27. Scappini B, Gatto S, Onida F et al. Changes associated with the development of resistance to STI571 in two leukemia cell lines expressing p210 Bcr/Abl protein. Cancer 2004; 100: 1459–71. [DOI] [PubMed] [Google Scholar]
- 28. Ricci C, Scappini B, Divoky V et al. Mutation in the ATP‐binding pocket of the ABL kinase domain in an STI571‐resistant BCR/ABL‐positive cell line. Cancer Res 2002; 62: 5995–8. [PubMed] [Google Scholar]
- 29. Avramis IA, Christodoulopoulos G, Suzuki A et al. In vitro and in vivo evaluations of the tyrosine kinase inhibitor NSC 680410 against human leukemia and glioblastoma cell lines. Cancer Chemother Pharm 2002; 50: 479–89. [DOI] [PubMed] [Google Scholar]
- 30. Avramis IA, Laug WE, Sausville EA, Avramis VI. Determination of drug synergism between the tyrosine kinase inhibitors NSC 680410 (adaphostin) and/or STI571 (imatinib mesylate, Gleevec) with cytotoxic drugs against human leukemia cell lines. Cancer Chemoth Pharm 2003; 52: 307–18. [DOI] [PubMed] [Google Scholar]