Abstract
NK cells and αβ‐ and γδ‐CTL play important roles in cellular immunity against tumors. We previously demonstrated that NPC patients have a quantitative and qualitative deficit in γδ‐CTL and EBV‐specific αβ‐CTL when compared to normal subjects and NPC long‐term survivors. In this study we report further observations of a complementary activation of peripheral NK cells in NPC patients. The NK cells in these patients, compared to those of healthy subjects and NPC survivors, were preferentially activated in response to the stimulation of myeloma cell line XG‐7 and expanded in the presence of exogenous IL‐2. The production of IFN‐γ was lowest in the patient group, whereas IL‐12, IL‐15 and TNF‐α were produced in higher levels in patients than in the donors and survivors. The cytolytic effect of the NK cells against NPC cells in the patient group was also higher than that of the donors and survivors. Furthermore, the patients at later stages of NPC had lower γδ‐CTL activity but higher NK cytotoxicity towards NPC targets, with higher production of IL‐12, IL‐15 and TNF‐α but lower production of IFN‐γ than in patients at earlier stages. This might be part of a triggered compensatory re‐activation of the innate immunity, believed to be mediated through various cytokines and chemokines when adaptive T cell immunity is breached. Together, these data suggest complementary roles of innate and adaptive immune response in tumor immunity where NK cells, γδ‐ and αβ‐CTL compensate for the deficits of one another at different stages of tumor invasion. (Cancer Sci 2006; 97: 912–919)
Abbreviations:
- CTL
cytotoxic T lymphocytes
- EBV
Epstein–Barr virus
- ELISA
enzyme‐linked immunosorbent assay
- FACS
fluorescence‐activated cell sorting
- FCS
fetal calf serum
- FI
fluorescence intensity
- FITC
fluorescein‐isothiocyanate
- IFN
interferon
- IL
interleukin
- mAbs
monoclonal antibodies
- MEC
methylcellulose
- MHC
major histocompatibility complex
- NK
natural killer
- NPC
nasopharyngeal carcinoma
- PBMC
peripheral blood mononuclear cells
- PE
phycoerythrin
- TCR
T‐cell receptor
- TNF
tumor necrosis factor.
NK cells, and αβ‐ and γδ‐CTL are the dominant players in cellular immunity to tumors.( 1 ) The presence of cellular disregulation manifested as abnormal expressions on the surface of tumor cells are potential targets for immune surveillance by these cytolytic lymphocytes.( 2 ) The effector function of αβ‐CTL of the adaptive immune response is MHC restricted and hence provides more specific targeted, albeit delayed, cytotoxicity.( 3 ) NK cells and γδ‐CTL are thought to contribute principally to innate immune surveillance due to their non‐MHC restricted cytotoxicity, which will accommodate a more rapid response to cellular stress and disregulation signals that trigger these cells’ cytolytic functions.( 4 , 5 , 6 ) The escape mechanisms of tumor cells from these cytolytic lymphocytes depend on the expression of different cell surface molecules such as inhibitory ligands.( 7 ) The presence of these inhibitory ligand‐mediated escape mechanisms is essential for the host to control excessive autoimmune reactions in otherwise healthy individuals.( 8 ) Different inhibitory ligands are recognized by receptors, such as NKG2A and KIR, distributed amongst these different cytolytic cells, thus reducing the chance of the tumor cells’ complete escape from them.( 9 , 10 , 11 ) The nature of these lymphocytes, taken together, thus provides a broad defense net at different stages of cellular immunity as well as broader coverage of cytotoxicity towards their respective targets.
The cytolytic effect of NK cells mainly occurs through the granulysin–perforin mechanism after activation of the appropriate receptors and in the absence of inhibitory ligands such as MHC class I molecules.( 12 ) Circulating NK cells recognize and kill cells which express abnormally downregulated levels of MHC class I molecules resulting from stress, infection or cellular disregulation.( 13 ) However, tumor cells expressing MHC class I molecules are also susceptible to NK cytotoxicity when ligands to the NKG2A receptor, such as MIC and RAE‐1, are coexpressed( 6 , 10 ) providing an impediment to escape mechanisms depending on MHC class I alone.
The roles of NK cells and T cells in host immunity are extensively interdependent through the sharing of cytokines and chemokines in a complex web of stimulatory and inhibitory interactions which remains to be further explored.( 14 , 15 , 16 , 17 , 18 , 19 , 20 ) NK cells are generally believed to take part in early innate host defense through a non‐specific response to inflammatory cytokines. They are distinguished from T cells in that they do not partake in adaptive immunity through expression of rearranged antigen receptors.( 21 ) NK cells do contribute to the development of the adaptive immune response,( 22 ) but their role diminishes as the more specific adaptive immune response begins to mature in the body's defense. Kasaian et al.( 23 ) recently demonstrated that IL‐21, a product of activated T cells, can reduce NK cells by antagonizing their survival, which provides one possible pathway for innate immunity to be taken over by adaptive immunity as the immune response progresses.
NPC is an EBV‐associated cancer common in southern China. We have previously shown that NPC patients display quantitative and qualitative deficits in γδ‐CTL and EBV‐specific αβ‐CTL compared to NPC long‐term survivors and healthy donors.( 24 , 25 ) The deficits were restored in the survivors after successful treatment to remove the tumor. In this study, we further demonstrate that NPC patients exhibit preferential activation of NK cells with concomitant increase in cytotoxicity against NPC cells and different profiles of tumor‐induced cytokine production.
Materials and methods
Study subjects
Study subjects included 15 active NPC patients, five long‐term survivors who had been in disease‐free remission for 5–13 years and five healthy donors. All study subjects were male ethnic Chinese whose ages coincided with the peak age incidence of the disease. Diagnosis of NPC patients was confirmed by characteristic pathology of poorly or undifferentiated carcinoma. The disease stage was defined according to Ho's standard.( 26 ) The 15 active NPC patients were divided into three groups according to their NPC stages, which were varied from T1N1 to T3N3 (Table 1).
Table 1.
NPC statuses of 25 study subjects, with disease stages defined according to Ho's standard( 26 )
| Number | NPC statuses | ||||
|---|---|---|---|---|---|
| Patients (groups) | Survivors | Donors | |||
| II (P1) | III (P2) | IV (P3) | II–III | ||
| 1 | T2N1 | T3N1 | T2N3 | T2N1 | NA |
| 2 | T1N1 | T2N2 | T3N3 | T1N2 | NA |
| 3 | T1N1 | T2N2 | T3N3 | T2N2 | NA |
| 4 | T2N1 | T3N1 | T3N3 | T3N2 | NA |
| 5 | T1N1 | T2N2 | T2N3 | T2N2 | NA |
Diagnosis of NPC patients was confirmed by characteristic pathology of poorly or undifferentiated carcinoma. NA: Not applicable.
Cytokines, cell lines and cell cultures
All recombinant cytokines were obtained from R&D Systems (USA). XG‐7 is a human myeloma cell line that expresses both HLA‐I (97% with intensity 511) and HLA‐II (94% with intensity 458).( 27 ) This cell line has been demonstrated to be able to effectively simulate growth of γδ T cells using Hsp70 on its surface.( 28 ) CNE2 and 915 are NPC cell lines. They were generous gifts of Dr X. Zhang (Su Zhou Medical College, China) and Dr Y. Zeng (Chinese Academy of Preventive Medicine, Beijing, China), respectively. XG‐7 was cultured in RPMI‐1640 medium (Gibco‐BRL, USA) supplemented with 10% FCS (Gibco‐BRL) (10% RPMI), 0.2 mM L‐glutamine and antibiotics (100 U/mL of penicillin, 100 µg/mL streptomycin, 20 µg/mL garamycin and 100 units of nystatin) and 1 U/mL rIL‐6. The NPC cell lines were cultured in modified Eagle's medium (Gibco‐BRL) supplemented with 10% FCS (10% MEC), 0.2 mM L‐glutamine and antibiotics. PBMC obtained from the study subjects were separated by Ficoll‐Hypaque (Pharmacia Biotech, Sweden) according to standard procedure. CD40‐activated B cell lines were established as described previously.( 28 )
Ex vivo expansion of non‐HLA‐restricted tumor‐effector cells
PBMC were cultured with a γδ T cell stimulant, XG‐7, for 10 days. The non‐HLA‐restricted tumor‐effector cells were expanded ex vivo as described previously.( 28 , 29 ) Briefly, 1 × 10⁷ of PBMC was mixed with 5 × 10⁶ irradiated (7000 cGy) allogeneic XG‐7 cells and incubated in 10% RPMI. Irradiated XG‐7 cells (3 × 10⁶) were added to the cultures on day 3, 6 and 9. Exogenous rIL‐2 (100 U/mL) was added to the cultures on day 11 and fed every 2–3 days or as needed thereafter.
Flow cytometry analysis using FACS
Approximately 1 × 10⁶ cells were stained with FITC‐ or PE‐labeled mAbs specific for CD3, CD34, CD56, Lineage, pan TCR‐αβ, pan TCR‐γδ and mouse immunoglobulin G1 (BD Biosciences, USA) for 30 min at 4°C. After three washes with phosphate‐buffered saline, the stained cells were analyzed using a flow cytometer (BD Biosciences).
Purification of NK cells and γδ T cells
NK cells and γδ T cells were purified from 4‐week expansion cultures using MACS CD56 and TCR‐γδ MicroBeads (Miltenyi Biotec, Germany). Briefly, approximately 107 cells in 0.5 mL of phosphate‐buffered saline containing 2 mM EDTA and 0.5% FCS were mixed with 20 µL of the CD56 or TCR‐γδ beads and allowed to stand at 6–10°C for 20 min. The beads‐bound NK cells or γδ T cells were magnetically separated. The procedure was repeated to ensure the purity of NK and γδ T cells (>95%).
Detection of cytokine secretion
The production of IFN‐γ, TNF‐α, IL‐15 and IL‐12 in XG‐7 stimulated cell cultures was detected by ELISA using OptEIA kits (PharMingen, USA) according to the manufacturer's instructions. Levels of these cytokines in supernatant obtained on day 2, 4, 6, 8 and 10 post‐stimulation were quantified using at least six concentrations of standard cytokines provided by the kits.
Detection of CTL activity
The CTL activity of the purified NK and γδ T cells was determined in triplicate by a standard 4 h Calcein AM release assay (Molecular Probes, USA) in U‐bottom 96‐well microplates.( 28 , 30 , 31 ) Briefly, triplicate cultures were seeded with a graded number of purified NK or γδ T cells and 5000 Calcein AM (Molecular Probes) labeled target cells at effector:target ratios from 30/1 to 0.3/1. The cytolysis of the targets was determined by measuring Calcein AM FI using a fluorometer. The maximum release was estimated by incubating target cells with 5% sodium dodecylsulfate (total lysis) and the spontaneous release estimated by incubating the targets in medium alone (target control). The percentage specific cytolysis was calculated as follows:
 |
Statistical analysis
The significance of differences between groups was analyzed by paired Student's t‐test.
Results
Preferential activation and expansion of NK cells from NPC patients in response to tumor cell stimulator
FACS analysis of freshly prepared PBMC revealed that the frequencies of CD3−/CD56+ NK cells were similar among NPC patients, survivors and healthy donors. However, the percentage of γδ T cells was slightly lower in the patients than survivors and donors, and CD34+/Lin cells, NK cell precursors, showed markedly increased frequencies in the patients than in the other groups (Fig. 1a). PBMC were ex vivo stimulated with XG‐7 cells, a non‐HLA restricted tumor stimulant,( 25 , 28 ) for 10 days and further cultured in the presence of exogenous IL‐2 thereafter. The number of NK cells was increased rapidly in the cultures of the patient groups in response to the tumor cell stimulation, reaching 7.9 ± 1.2 × 10⁶ (mean ± standard deviation, the same below) on day 10 (Fig. 2a), which was approximately 12‐ and 24‐fold higher than those in the cultures from survivors (0.66 ± 0.3 × 10⁶) and donors (0.33 ± 0.3 × 10⁶), respectively (P < 0.05). Notably, the frequency of NK cells from the patient groups was markedly higher after 4 weeks of culture, reaching 38.6% ± 21.5%, as compared to that of survivor (1.5% ± 1.1%) and donor (0.5% ± 0.2%) groups. However, no CD34+/Lin− cells were detectable in these cultures (Fig. 1b). Interestingly, the number of γδ T cells in the cultures from the patient group was significantly less than those of donors and survivors after 10 days with tumor cell stimulation (Fig. 2b), suggesting impaired activation of γδ T cells from the patients. In the presence of exogenous IL‐2, rapid γδ T cell growth was sustained for approximately 5 weeks in the cultures of PBMC from survivors and donors, reaching approximately 8.8 × 10⁹ and 5.4 × 10⁹, respectively. However, the number of γδ T cells in cultures from NPC patients was at least 20‐fold lower than that from survivors and donors (P < 0.01) (data not shown). After 4 weeks of culture, NK cells from patients were increased to approximately 1.1 × 10⁸, which was 6‐ and 10‐fold more than those from survivors and donors. The results showed that NK cells from NPC patients display markedly enhanced growth after tumor cell stimulation, whereas their γδ T cell expansion was significantly reduced as compared with those from the donors and survivors.
Figure 1.
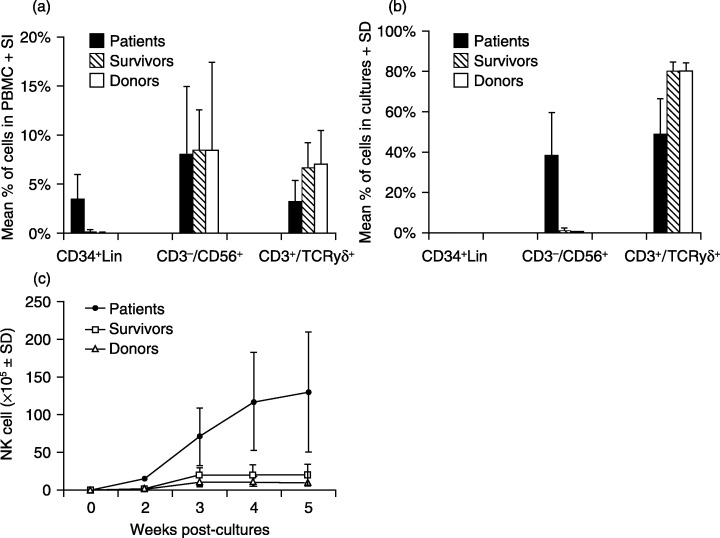
Phenotypes of PBMC and cell cultures from study subjects. Phenotypes of fresh PBMC (a) and the cells harvested in 4‐week cultures (b) from NPC patients, survivors and healthy donors were analyzed by FACS. γδ T cells and NK cells were differentiated and enumerated using a PE‐labeled CD3 mAb and FITC‐labeled mAbs specific to TCR‐γδ and CD56, respectively. Numbers of NK cells in expansion cultures from three groups of study subjects were determined by total cell numbers multiplied by the percentage of CD3−/CD56+ cells in the cultures (c).
Figure 2.
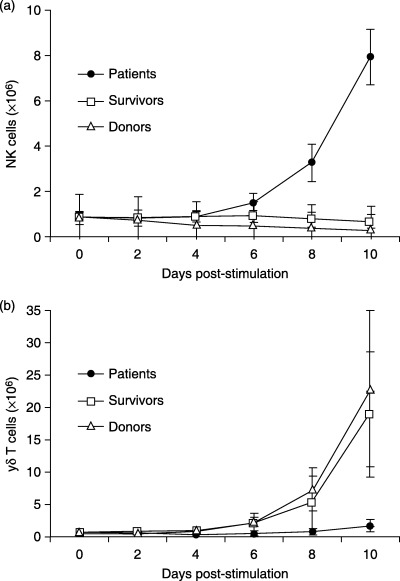
Activation of NK and γδ T cells in PBMC cultures stimulated with tumor cell line XG‐7. PBMC (10 × 106 cells) from NPC patients, survivors and donors were stimulated with XG‐7 and cultured for 10 days. The numbers of NK cells (a) and γδ T cells (b) were determined every 2 days by FACS using PE‐labeled CD3 mAb and FITC‐labeled mAbs specific to TCR‐γδ and CD56.
Increased cytotoxicity of NK cells from patients to target tumor cells
The non‐HLA restricted cytotoxicity of NK and γδ T cells to tumor targets was measured in total cells from 4‐week cultures of study subjects (Fig. 3). The cytotoxicity of purified NK cells from the cultures of patient groups against two NPC cell lines, CNE2 and 915, was significantly higher than other groups, whereas those from healthy donors showed the lowest cytotoxicity to the tumor targets. Furthermore, NK cells from survivors showed less cytotoxicity against the tumor cells, after γδ T cell immunity was restored, than patients with active disease. Compared to survivors, however, the cytotoxicity of purified γδ T cells from patients and donors was markedly reduced. These total culture cells, purified NK and γδ T cells did not lyse autologous B cells (data not shown).
Figure 3.
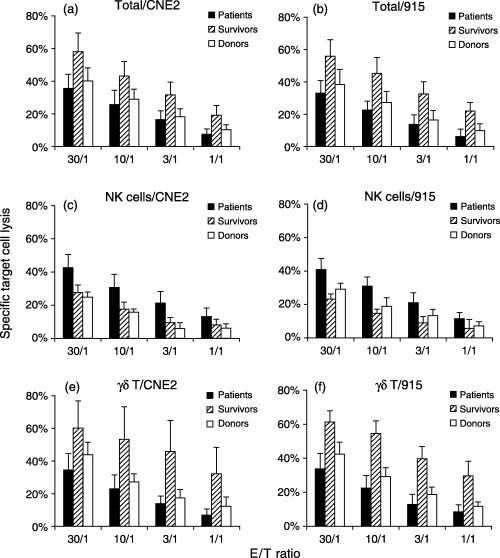
Cytolytic activities of total cultured cells, purified NK and γδ T cells derived from study subjects against tumor targets. Cytotoxicity of total cultured cells, purified NK and γδ T cells was determined by seeding a graded number of these effector cells against 5000 of the indicated Calcein AM‐labeled target cells (CNE2 and 915) at an effector:target ratio from 30:1 to 1:1, and expressed as a percentage of specific target cell lysis.
Complementary regulation of NK cell and γδ T cell immunity associated with the progression of NPC
Cytolytic activities of purified NK and γδ T cells derived from NPC patients at different disease stages were further compared (Fig. 4). Patients who had progressed to a later disease stage (group P3) showed more defective γδ T cell immunity to NPC cell lines than those at earlier disease stages (groups P1 and P2). The patients in groups P2 and P3 showed stronger cytotoxicity of NK cells to the tumor targets. Alternately, purified γδ T cells from patients with earlier NPC status (group P1) showed sustained median levels of cytotoxic activity against the tumor targets, which were similar to that from the donors (Fig. 3), but the cytotoxicity of their NK cells was lower than those from the other patient groups (groups P2 and P3).
Figure 4.
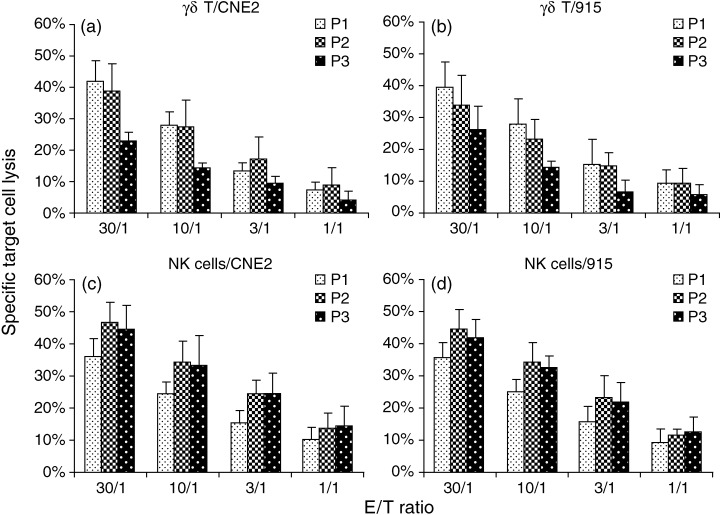
Cytotoxicity of purified NK and γδ T cells derived from NPC patients with different disease status against tumor targets. Cytotoxicity of purified NK and γδ T cells against NPC targets was determined as described in Figure 3, and compared between NPC patients with disease status II (P1), III (P2) and IV (P3).
Different profiles of tumor‐induced cytokine production in the cultures of patients, survivors and donors
Production of cytokines was detected in supernatants collected at 2‐day intervals from the 10‐day cultures of the study subjects (Fig. 5). In response to the stimulation of tumor cells, culture supernatants of survivors had the highest level of induced IFN‐γ production, followed by that of donors, and both groups showed significantly higher levels of IFN‐γ production than patients (P < 0.02, Fig. 5a). This IFN‐γ profile was in line with the observation above that much fewer γδ T cells were activated by the XG‐7 stimulation in the cultures of NPC patients. Interestingly, culture supernatants from patients showed earlier and higher IL‐12p40 production as compared with those of survivors and donors (Fig. 5b). IL‐12p40 was detectable on day 6 in the cultures from patients, which was 2 days superior to those from survivors and donors. In the patient group, the secretion of IL‐12p40 reached the highest level (36 ± 9 pg/mL) after 10 days of culture, which was significantly higher than that of survivors (15 ± 6 pg/mL) and donors (9 ± 7 pg/mL) (P < 0.05). The production of IL‐15 (Fig. 5c) and TNF‐α (Fig. 5d) was also higher in the cultures from patients, reaching levels of 29 ± 9 pg/mL and 80 ± 10 pg/mL in day 10 cultures, respectively, which was significantly higher than those of survivors (19 ± 5 pg/mL and 54 ± 12 pg/mL) and donors (18 ± 4 pg/mL and 50 ± 10 pg/mL) (P < 0.05).
Figure 5.
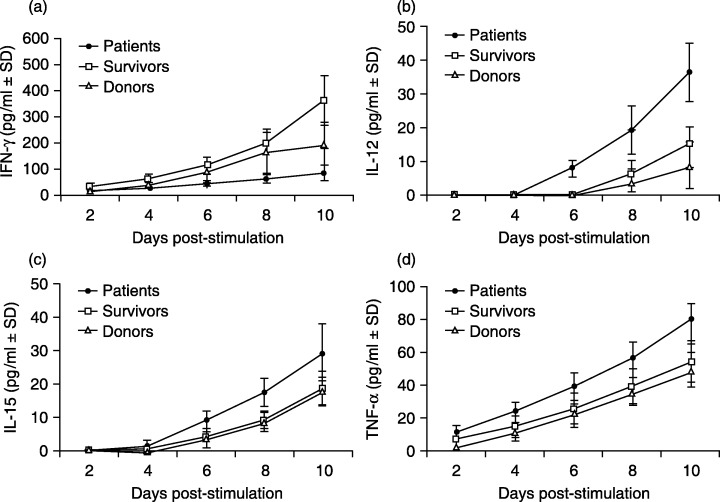
Cytokine profiles in study subjects’ PBMC cultures stimulated with XG‐7 cells. PBMC (10 × 107 cells) from NPC patients, survivors and donors were stimulated with XG‐7 and cultured for 10 days in the absence of exogenous IL‐2. The culture supernatants were collected every 2 days for determination of IFN‐γ (A), IL‐12p40 (B), IL‐15 (C) and TNF‐α (D) by ELISA.
Tumor‐induced cytokine profiles varied in NPC patients with different disease status
Further analysis revealed that the production of cytokines induced by tumor cell stimulation was varied in patients with different disease status (Fig. 6). The cultures from patients who had less disease progression (group P1) showed higher production of IFN‐γ but lower production of IL‐12p40, IL‐15 and TNF‐α than those from patients at later stages (groups P2 and P3). The level of IFN‐γ at day 10 of culture from group P1 was 115 ± 18 pg/mL, which was significantly higher than that of groups P2 and P3 (73 ± 9 pg/mL and 66 ± 13 pg/mL, P < 0.05). However, levels of IL‐12, IL‐15 and TNF‐α in day 10 cultures from group P1 were 30 ± 5 pg/mL, 22 ± 6 pg/mL and 73 ± 11 pg/mL, respectively, which were much lower than those from groups P2 (39 ± 7 pg/mL, 37 ± 7 pg/mL and 82 ± 6 pg/mL) and P3 (39 ± 7 pg/mL, 28 ± 6 pg/mL and 84 ± 9 pg/mL). These results were consistent with those compared to survivors and donors (Fig. 5). The cytokine profile of patients with earlier disease status (group P1) was comparable to that of donors than those of patients at later disease stages (groups P2 and P3).
Figure 6.
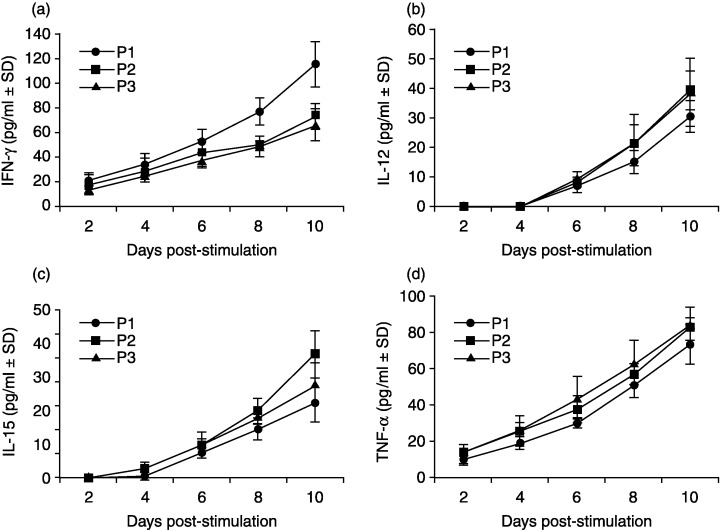
Cytokine productions in response to the stimulation of XG‐7 cells in PBMC cultures from NPC patients with different disease statuses. Production of IFN‐γ (A), IL‐12p40 (B), IL‐15 (C) and TNF‐α (D) in PBMC cultures from NPC patients with different disease statuses of II (P1), III (P2) and IV (P3) were tested by ELISA.
Discussion
In our previous studies on NPC patients, it was observed that both patients’ EBV‐specific αβ‐CTLs and tumor cytolytic γδ‐CTLs suffer from reductions in cell quantity as well as their respective cytolytic effects against tumor cells.( 24 , 25 ) Moreover, increased deficits of these cells were also observed during the progression of the tumor. In this study, we further investigated NK cells, another important antitumor immune cell type, and found that although both EBV‐specific αβ‐CTLs and tumor cytolytic γδ‐CTLs appeared to have been breached, NK cells were indeed preferentially activated in these patients. Their cytotoxicity against NPC cells was also increased, accompanied by impaired antitumor function of γδ T cells, as compared to the NK cells from healthy donors. In contrast, when the tumor has been removed and successfully treated, as reflected in the survivors, the reverse is observed, where γδ‐ and αβ‐CTLs appear to be the dominant antitumor immune cells with increased cytotoxicity towards tumor cells. Our findings suggest a complementary activation of NK cell‐mediated immunity in these NPC patients.
In general, the progression of immune response is sequentially activated from innate to adaptive immunity. NK and γδ T cells, which are broadly cytolytic, initially play dominant roles before target‐specific αβ T cells take over. It is thus probable that the reverse is true when adaptive immunity is breached by tumors, especially in view of the intercommunication between these cells through molecules such as cytokines and chemokines. Patients at earlier stage II of NPC (group P1) had higher γδ‐CTL cytotoxicity towards NPC targets than patients at later stages III and IV (groups P2 and P3). Conversely, their respective NK cell cytotoxicity was lower than their later stage counterparts. These results suggest that γδ‐CTLs were probably recruited first as part of the complementary immune response as the adaptive immunity, that is, specific αβ‐CTLs, was first breached by the tumor cells. With the progression of the tumor disease, the immune response elicited by γδ T cells began to show deficiency. Our current observation that enhanced immune response mediated by NK cells in patients might reflect some potential compensatory mechanisms. In patients at a more progressed disease stage (group P3), γδ T immunity against the tumor targets was further defected, but not accompanied with continually increased NK cell cytolytic activity toward the tumors, which suggest that the remobilized innate immunity would be also exhausted by the tumors at the later stage of the disease.
In the present study, NK cells are expanded by co‐cultures of PBMC from NPC patients with a tumor stimulator, XG‐7. There is evidence that tumor‐cytolytic NK cells can be expanded ex vivo by co‐culture of PBMC obtained from adult and pediatric acute lymphoid leukemia patients with a feeder cell line RPMI‐8866.( 32 ) It is still not clear why NK cells could be expanded in ex vivo cultures of PBMC from these patients. Interestingly, numbers of CD34+/Lin− cells, a precursor of NK cells, were markedly higher in PBMC taken from patients than those from survivors and donors in our study (Fig. 1a). Markedly increased CD34+ cells were also observed in patients with acute myelogenous leukemia.( 33 , 34 , 35 , 36 ) Further study is required to elucidate if the successful ex vivo expansion of NK cells in these patients is associated with the increase numbers of CD34+ cells in their blood circulation.
Although the mechanism leading to this resurgence of NPC cytotoxic NK cells is not clear, cytokines produced in the cultures upon stimulation of tumors seem to be involved in immune regulation. The reduced level of IFN‐γ, an important cytokine for regulating immune response, was observed in cultures of patient groups (Fig. 3a). This is probably attributable to the decreased total numbers of effector cells in the cultures, as IFN‐γ is produced by both T cells and NK cells. Increased levels of IL‐12, IL‐15 and TNF‐α were detected in the patient group, compared to those of the survivors and donors (Fig. 5b–d). As IL‐12 is an activator for both NK cells and T cells,( 37 , 38 , 39 ) the increased level of this cytokine might be a signal indicating T cell immunity failure, thus triggering the response of NK cell activation. On the other hand, IL‐12 receptors on macrophages are primed by IFN‐γ.( 40 ) The reduced level of IFN‐γ in patient groups might also contribute indirectly to the increase of IL‐12 in the cultures by reducing the amount of IL‐12 binding receptor. IL‐15 is known to be important for activation and growth of NK cells, and it is also able to improve cytolytic activity of NK cells.( 41 , 42 ) The rapid expansion of NK cells with higher cytotoxicity to tumor target cells in the cultures from patient groups might be partly attributed to the increased IL‐15 production. The upregulation of TNF‐α might be a result of NK cell proliferation and activation, as it is a product of activated NK cells. Furthermore, this cytokine can promote NK cell‐mediated killing.( 43 , 44 ) Increased levels of TNF‐α in cultures from patient groups might alternatively enhance the cytolytic ability of NK cells purified from these cultures. Distinct cytokine profiles were also observed in three groups of patients with different NPC status, in which patients with earlier stage disease showed a cytokine profile closer to that of healthy donors than those with later stage disease (Fig. 6). Notably, these cytokine profiles were accompanied with lower γδ T and higher NK cell activities in cultures from patient groups, but higher γδ T and lower NK cell activities in cultures from survivors and donors, suggesting that these cytokines might play roles in the complementary regulation between NK cells and T cells.
Although the mechanism of complementary regulation of innate and adaptive immunity remains to be elucidated, we have demonstrated that NK cells can be preferentially activated and expanded ex vivo, when the immune responses mediated by αβ‐ and γδ‐CTLs are breached in NPC patients. Further work is underway to investigate the roles of other immune cells, such as antigen‐presenting cells, NKT cells, and other cytokines, in regulating the immune system to achieve effective immunity against tumors and infections.
This work was supported in parts by grants from Research Grants Council, Hong Kong.
References
- 1. Pardoll DM. Immunology. Stress, NK receptors, and immune surveillance. Science 2001; 294: 534–6. [DOI] [PubMed] [Google Scholar]
- 2. Hellstrom I, Hellstrom KE. T cell immunity to tumor antigens. Crit Rev Immunol 1998; 18: 1–6. [PubMed] [Google Scholar]
- 3. Kabelitz D, Glatzel A, Wesch D. Antigen recognition by human γδ T lymphocytes. Int Arch Allergy Immunol 2000; 122: 1–7. [DOI] [PubMed] [Google Scholar]
- 4. Ferrarini M, Heltai S, Toninelli E, Sabbadini MG, Pellicciari C, Manfredi AA. Daudi lymphoma killing triggers the programmed death of cytotoxic Vγ9/Vδ2 T lymphocytes. J Immunol 1995; 154: 3704–12. [PubMed] [Google Scholar]
- 5. Groh V, Steinle A, Bauer S, Spies T. Recognition of stress‐induced MHC molecules by intestinal epithelial γδ T cells. Science 1998; 279: 1737–40. [DOI] [PubMed] [Google Scholar]
- 6. Diefenbach A, Jensen ER, Jamieson AM, Raulet DH. Rae1 and H60 ligands of the NKG2D receptor stimulate tumour immunity. Nature 2001; 413: 165–71. [DOI] [PMC free article] [PubMed] [Google Scholar]
- 7. Ravetch JV, Lanier LL. Immune inhibitory receptors. Science 2000; 290: 84–9. [DOI] [PubMed] [Google Scholar]
- 8. Flodstrom M, Shi FD, Sarvetnick N, Ljunggren HG. The NK cell – friend or foe in autoimmune disease? Scand J Immunol 2002; 55: 432–41. [DOI] [PubMed] [Google Scholar]
- 9. Yanagisawa M, Kato M, Ikeno K et al. Defective generation of killer cells against spontaneously EBV‐transformed autologous B cells in a fatal EBV infection. Clin Exp Immunol 1987; 68: 251–8. [PMC free article] [PubMed] [Google Scholar]
- 10. Girardi M, Oppenheim DE, Steele CR et al. Regulation of cutaneous malignancy by γδ T cells. Science 2001; 294: 605–9. [PubMed] [Google Scholar]
- 11. Long EO. Tumor cell recognition by NK cells. Semin Cancer Biol 2002; 12: 57–61. [DOI] [PubMed] [Google Scholar]
- 12. Kishi A, Takamori Y, Ogawa K et al. Differential expression of granulysin and perforin by NK cells in cancer patients and correlation of impaired granulysin expression with progression of cancer. Cancer Immunol Immunother 2002; 50: 604–14. [DOI] [PMC free article] [PubMed] [Google Scholar]
- 13. Valiante NM, Uhrberg M, Shilling HG et al. Functionally and structurally distinct NK cell receptor repertoires in the peripheral blood of two human donors. Immunity 1997; 7: 739–51. [DOI] [PubMed] [Google Scholar]
- 14. Banyer JL, Hamilton NH, Ramshaw IA, Ramsay AJ. Cytokines in innate and adaptive immunity. Rev Immunogenet 2000; 2: 359–73. [PubMed] [Google Scholar]
- 15. Brubaker JO, Montaner LJ. Role of IL‐13 in innate and adaptive immunity. Cell Mol Biol 2001; 47: 637–51. [PubMed] [Google Scholar]
- 16. Kaser A, Tilg H. IFN‐α in inflammation and immunity. Cell Mol Biol 2001; 47: 609–17. [PubMed] [Google Scholar]
- 17. Liew FY, McInnes IB. The role of innate mediators in inflammatory response. Mol Immunol 2001; 38: 887–90. [DOI] [PubMed] [Google Scholar]
- 18. Biron CA, Nguyen KB, Pien GC. Innate immune responses to LCMV infections: NK cells and cytokines. Curr Top Microbiol Immunol 2002; 263: 7–27. [DOI] [PubMed] [Google Scholar]
- 19. Luster AD. The role of chemokines in linking innate and adaptive immunity. Curr Opin Immunol 2002; 14: 129–35. [DOI] [PubMed] [Google Scholar]
- 20. Uthaisangsook S, Day NK, Bahna SL, Good RA, Haraguchi S. Innate immunity and its role against infections. Ann Allergy Asthma Immunol 2002; 88: 253–64. [DOI] [PubMed] [Google Scholar]
- 21. Brown MG, Dokun AO, Heusel JW et al. Vital involvement of a NK cell activation receptor in resistance to viral infection. Science 2001; 292: 934–7. [DOI] [PubMed] [Google Scholar]
- 22. Biron CA, Nguyen KB, Pien GC, Cousens LP, Salazar‐Mather TP. NK cells in antiviral defense: function and regulation by innate cytokines. Annu Rev Immunol 1999; 17: 189–220. [DOI] [PubMed] [Google Scholar]
- 23. Kasaian MT, Whitters MJ, Carter LL et al. IL‐21 limits NK cell responses and promotes antigen‐specific T cell activation: a mediator of the transition from innate to adaptive immunity. Immunity 2002; 16: 559–69. [DOI] [PubMed] [Google Scholar]
- 24. Chua D, Huang J, Zheng BJ et al. Adoptive transfer of autologous EBV‐specific cytotoxic T cells for NPC. Int J Cancer 2001; 94: 73–80. [DOI] [PubMed] [Google Scholar]
- 25. Zheng BJ, Ng SP, Chua DT et al. Peripheral γδ T‐cell deficit in NPC. Int J Cancer 2002; 99: 213–7. [DOI] [PubMed] [Google Scholar]
- 26. Ho JH. Stage classification of nasopharyngeal carcinoma: a review. IARC Sci Publ 1978; 20: 99–113. [PubMed] [Google Scholar]
- 27. Zhang XG, Gaillard JP, Robillard N et al. Reproducible obtaining of human myeloma cell lines as a model for tumor stem cell study in human multiple myeloma. Blood 1994; 83: 3654–63. [PubMed] [Google Scholar]
- 28. Zheng BJ, Lam C, Im S et al. Distinct tumour specificity and IL‐7 requirements of CD56− and CD56+ subsets of human γδ T cells. Scand J Immunol 2001; 53: 40–8. [DOI] [PubMed] [Google Scholar]
- 29. Zheng BJ, Chan KW, Im S et al. Anti‐tumor effects of human peripheral γδ T cells in a mouse tumor model. Int J Cancer 2001; 92: 421–5. [DOI] [PubMed] [Google Scholar]
- 30. Wang XM, Terasaki PI, Rankin GW Jr, Chia D, Zhong HP, Hardy S. A new microcellular cytotoxic test based on calcein AM release. Human Immunol 1993; 37: 264–70. [DOI] [PubMed] [Google Scholar]
- 31. Lichtenfels R, Biddison WE, Schulz H, Vogt AB, Martin R. CARE‐LASS (calcein‐release‐assay), an improved fluorescence‐based test system to measure CTL activity. J Immunol Methods 1994; 172: 227–39. [DOI] [PubMed] [Google Scholar]
- 32. Torelli GF, Guarini A, Maggio R, Alfieri C, Vitale A, Foa R. Expansion of natural killer cells with lytic activity against autologous blasts from adult and pediatric acute lymphoid leukemia patients in complete hematologic remission. Haematologica 2005; 90: 785–92. [PubMed] [Google Scholar]
- 33. Kanda Y, Hamaki T, Yamamoto R et al. The clinical significance of CD34 expression in response to therapy of patients with acute myeloid leukemia: an overview of 2483 patients from 22 studies. Cancer 2000; 88: 2529–33. [PubMed] [Google Scholar]
- 34. Hrusak O, Porwit‐MacDonald A. Antigen expression patterns reflecting genotype of acute leukemias. Leukemia 2002; 16: 1233–58. [DOI] [PubMed] [Google Scholar]
- 35. Oyan AM, Bo TH, Jonassen I et al. CD34 expression in native human acute myelogenous leukemia blasts: differences in CD34 membrane molecule expression are associated with different gene expression profiles. Cytometry B Clin Cytom 2005; 64: 18–27. [DOI] [PubMed] [Google Scholar]
- 36. Szczepek AJ, Bergsagel PL, Axelsson L et al. CD34+ cells in the blood of patients with multiple myeloma express CD19 and IgH mRNA and have patient‐specific IgH VDJ gene rearrangements. Blood 1997; 89: 1824–33. [PubMed] [Google Scholar]
- 37. Lopez RD, Waller EK, Lu PH, Negrin RS. CD58/LFA‐3 and IL‐12 provided by activated monocytes are critical in the in vitro expansion of CD56+ T cells. Cancer Immunol Immunother 2001; 49: 629–40. [DOI] [PMC free article] [PubMed] [Google Scholar]
- 38. Ikeda H, Chamoto K, Tsuji T et al. The critical role of type‐1 innate and acquired immunity in tumor immunotherapy. Cancer Sci 2004; 95: 697–703. [DOI] [PMC free article] [PubMed] [Google Scholar]
- 39. Malmgaard L. Induction and regulation of IFNs during viral infections. J Interferon Cytokine Res 2004; 24: 439–54. [DOI] [PubMed] [Google Scholar]
- 40. Grohmann U, Belladonna ML, Vacca C et al. Positive regulatory role of IL‐12 in macrophages and modulation by IFN‐γ. J Immunol 2001; 167: 221–7. [DOI] [PubMed] [Google Scholar]
- 41. Dunne J, Lynch S, O’Farrelly C et al. Selective expansion and partial activation of human NK cells and NK receptor‐positive T cells by IL‐2 and IL‐15. J Immunol 2001; 167: 3129. [DOI] [PubMed] [Google Scholar]
- 42. McInnes IB, Gracie JA. Interleukin‐15: a new cytokine target for the treatment of inflammatory diseases. Curr Opin Pharmacol 2004; 4: 392. [DOI] [PubMed] [Google Scholar]
- 43. Lee RK, Spielman J, Zhao DY, Olsen KJ, Podack ER. Perforin, Fas ligand and tumor necrosis factor are the major cytotoxic molecules used by lymphokine activated killer cells. J Immunol 1996; 157: 1919–25. [PubMed] [Google Scholar]
- 44. Baxevanis CN, Voutsas IF, Tsitsilonis OE, Tsiatas ML, Gritzapis AD, Papamichail M. Compromised anti‐tumor responses in tumor necrosis factor‐α knockout mice. Eur J Immunol 2000; 30: 1957–66. [DOI] [PubMed] [Google Scholar]


