

Abstract
Normal cells irreversibly stop dividing after being exposed to a variety of stresses. This state, called cellular senescence, has recently been demonstrated to act as a tumor‐suppressing mechanism in vivo. A common set of features are exhibited by senescent cells, but the molecular mechanism leading to the state is poorly understood. It has been shown that p38, a stress‐induced mitogen‐activated protein kinase (MAPK), plays a pivotal role in inducing cellular senescence in diverse settings. To better understand the senescence‐inducing pathway, microarray analyses of normal human fibroblasts that ectopically activated p38 were performed. It was found that five genes encoding ESE‐3, inhibin βA, RGS5, SSAT and DIO2 were up‐regulated in senescent cells induced by RasV12, H2O2 and telomere shortening, but not in quiescent or actively growing cells, suggesting that these genes serve as molecular markers for various types of cellular senescence. The ectopic expression of ESE‐3 resulted in retarded growth, up‐regulation of p16INK4a but not of p21, and increased levels of SA‐β‐gal activity. In contrast, RGS5, SSAT and the constitutive active form of the inhibin βA receptor gene did not induce such senescence phenotypes when ectopically expressed. ESE‐3 expression increased the activity of the p16INK4a promoter in a reporter assay, and recombinant ESE‐3 protein bound to the Ets‐binding sequences present in the promoter. These results suggest that ESE‐3 plays a role in the induction of cellular senescence as a downstream molecule of p38. (Cancer Sci 2007; 98: 1468–1475)
Abbreviations:
- EBS
Ets‐binding site
- EDTA
ethylene diamine tetra‐acetic acid
- EGTA
ethylene glycol bis(βaminoethyl ether)‐N,N,N′,N′‐tetra‐acetic acid
- ESE
epithelium‐specific Ets
- EMSA
electrophoretic mobility shift assay
- ETS
E twenty‐six
- FBS
fetal bovine serum
- FCS
fetal calf serum
- GAPDH
glyceraldehyde‐3‐phosphate dehydrogenase
- IL
interleukin
- LOH
loss of heterozygosity
- MAPK
mitogen‐activated protein kinase
- MAPKK
MAPK kinases
- PBS
phosphate‐buffered saline
- PD
population doublings
- RT‐PCR
reverse transcription–polymerase chain reaction
- SA‐β‐gal
senescence‐associated‐β‐galactosidase
- TNF
tumor necrosis factor.
Normal cells undergo irreversible growth arrest, a state referred to as cellular senescence, under various stress‐posing conditions. Most human primary cells lack telomerase activity, and telomere length is reduced every time cells divide due to the end replication problem. Accordingly, after a limited number of cell divisions, the telomere becomes shortened to a critical level, eliciting a form of cellular senescence called replicative senescence.( 1 ) Independent of telomere shortening, cells that experience diverse kinds of stresses, such as sublethal H2O2,( 2 ) activation of Ras( 3 ) and Raf oncogenes( 4 ) and inappropriate culture conditions( 5 ) also show cellular senescence within a relatively short period (reviewed in( 6 )). This form of cellular senescence is called premature senescence or stress‐induced senescence.
Senescent cells show a common set of characteristic phenotypes, including large and flat morphology of cytoplasm, SA‐β‐gal activity( 7 ) altered transcriptomes, increased levels of CDK inhibitors p21 and p16, and of the hypo‐phosphorylated form of Rb. The up‐regulation of p16 encoded by the INK4a gene is one of the critical steps of cellular senescence: the over‐expression and the inactivation of p16INK4a induced and bypassed cellular senescence, respectively.( 8 , 9 ) It has been demonstrated that the up‐regulation of p16INK4a is mediated by transcription factors Ets1 and/or Ets2 in Ras‐induced senescence.( 10 ) Ets1 and Ets2 are known to be phosphorylated by MAPK Erk, one of the downstream effectors of Ras, and bind to the Ets binding sequences present in the p16INK4a promoter to activate its expression. However, it is not clear whether the same mechanism operates in other types of cellular senescence or not.
The authors and others have reported that the stress‐induced MAPK, p38, plays an important role in inducing cellular senescence in diverse conditions.( 11 , 12 , 13 , 14 ) p38 is activated by a variety of stresses including UV light, heat, osmotic stresses, inflammatory cytokines (TNF‐α and IL‐1) and growth factors (CSF‐1; reviewed in( 15 )). In such conditions, p38 is phosphorylated by the dual‐specificity upstream kinases, MAPKK, MKK3 or MKK6, at the threonine and tyrosine residues in the Thr‐Gly‐Tyr (TGY) context contained in the activation loop of the kinase. Activated p38 phosphorylates and activates transcription factors to alter gene expression patterns, and/or phosphorylates other effectors including further downstream kinases, MAPK‐activated protein kinases (reviewed in( 16 )). It has been found that the level of activated p38, but not that of Erk or another stress‐induced MAPK, JNK, is commonly increased in replicative senescence and premature senescence induced by H2O2, activated Ras and inappropriate culture conditions.( 13 , 14 ) The ectopic activation of p38 via the over‐expression of a constitutive active form of the upstream MKK6 led to the induction of all aspects of cellular senescence, including p16INK4a up‐regulation, in young human fibroblasts. Moreover, pharmacological or genetic abrogation of p38 activation resulted in at least partial bypassing of cellular senescence. These results indicate that p38 comprises a common signaling pathway for a variety of cellular senescence, and suggest that the analysis of molecules downstream of p38 would lead to the identification of molecules important for the execution of the cellular senescence program.
In the present study, the authors performed a microarray analysis to identify such molecules in ectopically p38‐activated normal human fibroblasts. ESE‐3, a paralog of ETS genes, was identified as one of the genes up‐regulated commonly in all cases of Ras‐, p38‐, H2O2‐induced premature senescence and replicative senescence. The ectopic expression of ESE‐3 induced some aspects of cellular senescence including p16INK4a up‐regulation. In vitro experiments suggested that ESE‐3 protein activates p16INK4a by direct binding to the promoter region. These results suggest that ESE‐3 is a component of cellular‐senescence‐executing molecules downstream of p38.
Materials and Methods
Cell culture. Normal human fibroblast WI‐38 cells were obtained from Human Science Research Resources Bank (HSRRB; Japan). Cells were grown in Dulbecco's modified Eagle's medium supplemented with 10% FCS (Biowest, France).
Retroviral gene transduction. Retroviral particles were generated and infected to cells as described.( 14 )
Growth curve analysis. Twenty thousand cells were plated in 6‐well dishes. After 2, 4 and 8 days, the cell number was determined.
cDNA microarray analysis. Total RNA and poly (A)+ RNA were isolated from MKK6‐EE‐expressing cells and from mock‐treated cells as a control using an RNeasy mini column (Qiagen, Germany) and an mRNA Purification Kit (GE Healthcare of former Amersham Biosciences, England), respectively. 1 µg of poly (A)+ RNA from the MKK6‐EE‐expressing cells and mock‐treated cells was amplified using an Ampliscribe T7 Transcription Kit (Epicentre Technologies, Madison, WI, USA), and 5 µg of amplified RNA was labeled with Cy5‐dCTP and Cy3‐dCTP, respectively, as described previously.( 17 ) Establishment of the microarray, procedures of hybridization and washing, and photometrical quantification of signal intensities of each spot were done as described previously.( 18 ) Each slide contained 52 housekeeping genes, and the intensity of each hybridization signal was evaluated photometrically by the ArrayVision computer program (GE Healthcare) and normalized to the averaged signals of 52 housekeeping genes. The Cy3:Cy5 ratio for each sample was calculated by averaging spots. A cutoff value for each expression level was automatically calculated according to the background fluctuation. The fluctuation can be estimated as the variance of the log ratio of Cy5:Cy3 minus the variance of the log ratio of Cy5:Cy3 of highly expressed genes (the upper 30%, where the background fluctuation is so small that it could be ignored). Genes with an expression level with a fluctuation less than a critical value (1.0) were used because the other genes (those that have low expression) are embedded in the background fluctuation. If both Cy3 and Cy5 signal intensities were lower than the cut‐off values, the expression level of the corresponding gene in that sample was assessed as low or absent. For other genes we calculated Cy5/Cy3 as a relative expression ratio. We defined the relative expression of each gene (Cy5/Cy3 intensity ratio) into one of four categories: up‐regulated (ratio ≥ 2.0), down‐regulated (ratio ≤ 0.5), unchanged (0.5 < ratio < 2.0), and low or not expressed (under the cut‐off level of detection).
RT‐PCR analysis. RT‐PCR was performed using the following primers: ESE‐3b, 5′‐ATCTCGGTAGTTACGTATTGGGC‐3′ and 5′‐ACTTGTGAAGGCTTGTACGTTTC‐3′; inhibin βA, 5′‐TCCTCTGGTATCATGCCAACTAC‐3′ and 5′‐TCTTCTCTGGACAACTCTTGCTC‐3′; RGS5, 5′‐CCTTGGACCACCTTCATGTTAG‐3′ and 5′‐CTCGATTACCCTCATACATGGC‐3′; SSAT, 5′‐CCTCCTACTGTTCAAGTACAGGG‐3′ and 5′‐CACCACCTTGTTGTTTATCGAA‐3′; DIO2, 5′‐CTCAGACTTAACAGACCCAGCTC‐3′ and 5′‐ATAAGCACACATAGCACTCAGCA‐3′; and GAPDH, 5′‐GCAAATTCCATGGCACCGT‐3′ and 5′‐TCGCCCCACTTGATTTTGG‐3′.
Immunoblotting analysis. Sub‐confluent cells were washed with cold PBS and lyzed with lysis buffer (20 mM Tris‐HCl [pH 7.5], 150 mM NaCl, 0.5% NP‐40, 3 mM EDTA, 3 mM EGTA and 1× Complete as protease inhibitor (Roche, Switzerland). Whole cell extracts were immunoblotted with anti‐ESE‐3 monoclonal antibody (described as clone 5A5.5 in( 19 )), anti‐Ets1 (Santa Cruz Biotechnology, USA; sc‐350), anti‐Ets2 (Santa Cruz Biotechnology; sc‐351), anti‐Rb (Pharmingen BD, USA; 14001A), anti‐p16 (Santa Cruz Biotechnology; sc‐4687), anti‐p21 (Santa Cruz Biotechnology; sc‐817), c‐Raf (Santa Cruz Biotechnology; sc‐228), anti‐H2B (Upstate joins Millipore, USA; #07‐371) or anti‐actin (Chemicon joins Millipore, USA) antibodies.
Luciferase reporter assay. Wild‐type and mutant –247 reporter plasmids( 10 , 20 ) were kind gifts from Dr E. Hara (Tokushima University). They were subcloned into pGL3‐Basic (Promega, USA) and used in this study. WI‐38 cells grown to subconfluence in a 24‐well plate were transfected with 667 ng of a reporter vector, 333 ng of an effector vector (pcDNA3‐based) and 16.7 ng of an internal control vector (phRL‐TK) per unit well. After incubation for 48 h, the luciferase activity was measured with the Dual‐Luciferase Reporter Assay System (Promega).
Preparation of nuclear fraction. WI‐38 cells (2–3 × 10⁶) were washed with cold PBS and suspended in 200 µL of buffer‐A (10 mM HEPES [pH 8.0], 10 mM KCl, 1.5 mM MgCl2, 340 mM sucrose, 10% glycerol, 1 mM DTT and 1× Complete (Roche)). This was followed by the addition of 2 µL of 10% Triton X‐100 to a final concentration of 0.1% and incubation on ice for 5 min. Suspensions were centrifuged at 1500 g for 4 min at 4°C to produce supernatant S1 and precipitant P1. S1 was centrifuged at 13 000 g for 10 min at 4°C to produce supernatant S2 (cytoplasmic fraction). P1 was washed in 200 µL of buffer‐A, followed by centrifugation at 1500 g for 4 min at 4°C. The precipitates were sonicated in 100 µL of lysis buffer (see immunoblotting analysis) and extracted. The suspension was centrifuged at 13 000 g for 10 min at 4°C to produce the supernatant (nuclear fraction).
EMSA. EMSA was performed according to the procedure described previously.( 21 ) 6 µg of nuclear fraction and 40 fmol of biotinylated oligonucleotide probes were incubated in 10 mM HEPES [pH 7.5], 40 mM NaCl, 0.5 mM EDTA, 0.5 mM EGTA, 6 mM MgCl2, 10 mM DTT and 1× Complete (Roche) for 15 min at room temperature and for an additional 15 min on ice. In some experiments, competitor oligonucleotides (4 pmol) or antibodies were incubated with the nuclear fraction at room temperature for 30 min prior to the addition of oligonucleotide probes.
Results
Microarray analyses of MKK6‐EE‐expressing cells. To identify potential target genes that are activated by p38 in senescent cells, the gene expression profile was analyzed using the microarray technique. Normal human fibroblast WI‐38 cells (PD38) were infected with recombinant retroviruses encoding MKK6‐EE or empty vector controls. MKK6‐EE is a mutant of MKK6, an upstream kinase of p38, possessing substitutions of Glu at Ser‐207 and Thr‐211 that lead to the constitutive activation of endogenous p38 but not JNK or Erk.( 22 ) Infected cells were selected by puromycin treatment for 4 days. The culture medium was replaced with a fresh one containing no puromycin on the fifth day and the cells were re‐plated on the sixth day (day 0). The culture was continued until day 6, when the cells were harvested (Fig. 1a).
Figure 1.
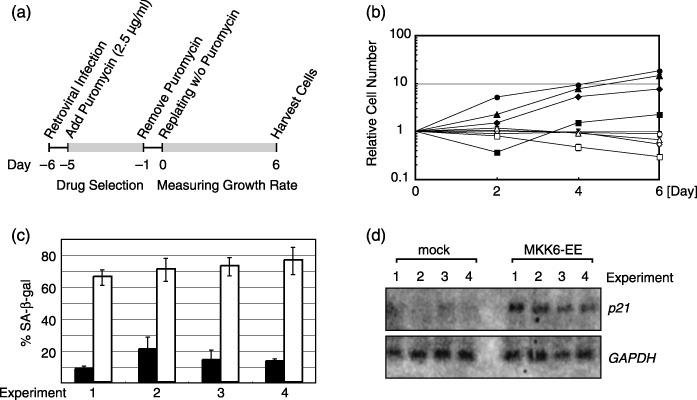
MKK6‐expressing WI‐38 cells used for microarray analyses. (a) Experimental schemes showing sample preparation for microarray. Normal human fibroblast WI‐38 cells were infected with RasV12‐expressing retrovirus or empty vector. Infected cells were selected by puromycin treatment and harvested as indicated. (b) Growth curves of MKK6‐EE‐expressing WI‐38 cells and empty‐vector‐infected cells. Retroviral infections were done four times (represented by triangles, circles, diamonds and squares). Open and filled symbols indicate MKK6‐EE‐expressing and mock‐treated cells, respectively. (c) Percentages of SA‐β‐gal‐positive cells at day 6. White and black bars represent MKK6‐EE‐expressing and mock‐treated cells, respectively. (d) Expression levels of CDK inhibitor p21 and GAPDH in MKK6‐EE‐expressing and mock‐treated cells as revealed by northern blotting analysis.
Four independent experiments were performed to prepare cells for microarray analyses. In all cases, the MKK6‐EE‐expressing cells showed enlarged and flat cytoplasm (data not shown and( 14 )), stopped growing (Fig. 1b), were positive for SA‐β‐gal activity (Fig. 1c) and showed increased p21 mRNA levels (Fig. 1d), as expected. Poly (A)+ RNA was prepared from composite cells obtained from the four experiments and subjected to the microarray analysis as described previously.( 23 ) Among more than 20 000 genes analyzed in the microarray, 463 and 567 genes were significantly up‐regulated and down‐regulated in MKK6‐EE‐expressing cells compared with mock‐treated cells, respectively.
The microarray experiments identified 195 genes that were up‐regulated by more than five‐fold in MKK6‐EE‐expressing cells compared with mock‐treated cells. Among these, 84 genes failed to reproduce the microarray results in RT‐PCR experiments and were excluded from the candidate list. The remaining 111 genes were examined for the relative expression levels in WI‐38 cells undergoing replicative senescence, H2O2‐induced, MKK6‐EE‐induced and Ras‐induced premature senescence, quiescence induced by serum starvation (0.1% FBS for 48 h) or contact inhibition using RT‐PCR, as well as actively growing young control cells. Fifty‐six genes were found to be up‐regulated in the quiescent cells induced by serum starvation or contact inhibition, and were discarded. The RT‐PCR results for the remaining 55 genes that showed increased expressions in at least one of the four senescence‐related conditions, but not in quiescent cells, are fully described in Supplementary Table S1.
It was found that five genes encoding ESE‐3, inhibin βA, RGS5 (regulator of G‐protein signaling 5), SSAT (spermin/spermidine acetyltransferase) and DIO2 (type II iodothyronine deiodinase) were up‐regulated in each replicative senescence and three types of premature senescence, but not in either type of quiescent cells, or in actively growing young cells (Fig. 2). The ESE‐3, RGS5 and SSAT genes were individually over‐expressed in young WI‐38 cells. Only the ESE‐3 over‐expression resulted in inducing senescence phenotypes (see below). Over‐expression of the constitutive active form of ALK4, which encodes the inhibin βA receptor, did not induce cellular senescence, either. The authors therefore focused on ESE‐3 for further investigation.
Figure 2.
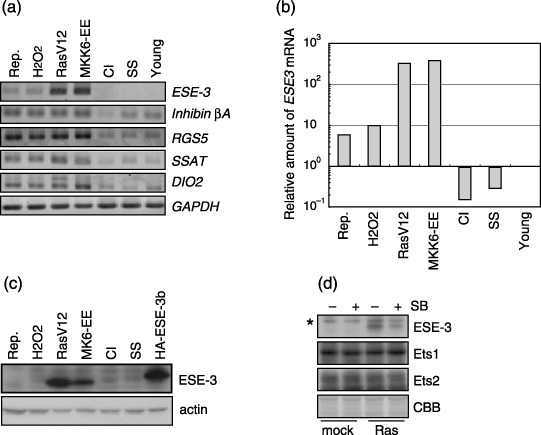
ESE‐3 expression is up‐regulated in senescent cells but not in quiescent cells. (a) Expression levels of ESE‐3 were measured using RT‐PCR in WI‐38 cells exhibiting the following conditions. CI, contact inhibition; H2O2, H2O2‐induced senescence; MKK6‐EE, MKK6‐EE‐induced senescence; RasV12, Ras‐induced senescence; Rep., replicative senescence; SS, serum starvation; Young, actively growing young cells. (b) Quantitative analyses of ESE‐3 mRNA levels as revealed by real‐time PCR. The value obtained for the young cells was set at 1. (c) ESE‐3 proteins as revealed by immunoblotting analyses using 5A5.5. WI‐38 cells retrovirally expressing HA‐ESE‐3b protein were similarly analyzed as control. (d) ESE‐3, Ets1 and Ets2 protein levels as revealed by immunoblotting analyses in mock and RasV12‐expressing cells with or without SB203580 treatment. The band that appears in all lanes (asterisk) is a non‐specific signal. Coomassie Brilliant Blue (CBB) staining indicates that an equal amount of the total protein was loaded in each lane (representative parts of staining where ESE‐3 migrated are shown).
Roles of ESE‐3 in cellular senescence. ESE‐3 encodes an Ets‐domain‐containing transcription factor.( 19 , 24 , 25 ) Together with ESE‐1 and ESE‐2, it comprises the ESE factor family, which is characterized by the restricted expression as a nuclear protein in terminally differentiated and non‐dividing epithelial cells and the presence of the N‐terminal pointed domain and the C‐terminal Ets domain.( 19 ) ESE‐1 or ESE‐2 expression was not detected in Ras‐induced senescent cells using RT‐PCR with various numbers of amplification cycles (data not shown), suggesting that ESE‐3 is specifically expressed in the senescent cells.
The expression level of ESE‐3 mRNA detected using RT‐PCR was highest in Ras‐induced and MKK6‐EE‐induced senescent WI‐38 cells, and was moderate in WI‐38 cells undergoing H2O2‐induced senescence or replicative senescence. It was not detected in quiescent WI‐38 cells induced by contact inhibition or serum starvation, or in actively growing young WI‐38 cells (Fig. 2a). These findings were confirmed by quantitative real‐time RT‐PCR experiments (Fig. 2b). Indeed, ESE‐3 expression levels were down‐regulated in the two types of quiescent cells compared with those in the actively growing young cells (Fig. 2b). Anti‐ESE‐3 monoclonal antibody 5A5.5 detected ESE‐3 protein in Ras‐induced and MKK6‐EE‐induced senescent cells, but not in replicative senescence cells, H2O2‐induced senescent cells or quiescent cells (Fig. 2c). The authors have experienced that the endogenous ESE‐3 protein is physiologically produced at very low levels and is hardly detected by conventional immunoblotting techniques (data not shown). Accordingly, it is thought that the failure of detecting ESE‐3 protein does not exclude the possibility that ESE‐3 plays a role in H2O2‐induced and replicative senescence.
It was reported that the treatment of SB203580, a chemical inhibitor of p38, results in bypassing of the senescence phenotype.( 13 , 14 ) When RasV12‐expressing cells were treated with 10 µM SB203580, the ESE‐3 protein level was significantly reduced, concomitant with the bypassing of the retarded growth and other senescence phenotypes (data not shown and( 14 )), suggesting that p38 activation is required for the up‐regulation of ESE‐3 in RasV12‐expressing cells (Fig. 2d). It was found that neither the Ets1 nor the Ets2 protein level was changed by RasV12 expression or SB203580 treatment (Fig. 2d).
Human ESE‐3 encodes two mRNA through alternative splicing that accordingly produces two ESE‐3 isoforms, ESE‐3a and ESE‐3b.( 25 ) Compared with ESE‐3a, ESE‐3b contains an extra sequence of 23 amino acids between the pointed and Ets domains. In Ras‐induced senescent WI‐38 fibroblasts, ESE‐3b mRNA and protein were detected, but hardly any ESE‐3a mRNA or protein (data not shown). N‐terminally HA‐tagged ESE‐3b cDNA were then expressed constitutively in young WI‐38 cells using a retrovirus vector according to the protocol indicated in Fig. 1a. After the selection of infected cells with puromycin, cell growth was monitored (Fig. 3a). Compared with the mock‐infected cells, ESE‐3b‐expressing cells proliferated slowly. In contrast to RasV12‐expressing cells that stopped growing at day 6; ESE‐3b‐expressing cells continued to grow slowly for 6 days, however. When cells were maintained by regular feeding of fresh media, ESE‐3b‐expressing cells stopped growing significantly earlier than the mock‐treated cells did (Fig. 3b). ESE‐3b‐expressing cells also showed a higher level of SA‐β‐gal‐positive cells than the mock‐infected cells, although to a lesser degree than that shown by the RasV12‐expressing cells (Fig. 3c). Rb protein was largely hypo‐phosphorylated in both cells whereas hyper‐ and hypo‐phosphorylated Rb existed in mock‐treated cells at day 6 (Fig. 3d). The amount of p16 but not that of p21 was increased in ESE‐3b‐expressing cells, while both were increased in RasV12‐expressing cells (Fig. 3d). Taken together, it was concluded that the ectopic expression of ESE‐3b induces some senescence phenotypes, that is, reduced growth rates, early cessation of cell proliferation, increased SA‐β‐gal activity, and increased levels of p16 and hypo‐phosphorylated Rb. However, no increase in p21 level was observed. To investigate the effect of knock‐down of the ESE‐3 gene expression on the senescence phenotypes, multiple retroviruses encoding differently designed ESE‐3‐targeting shRNA were constructed. However, it was observed that when WI‐38 cells were transfected with Ras‐ and shRNA‐expressing retroviruses simultaneously, all cells died from unknown reasons in all cases, which prevented completion of the experiments.
Figure 3.
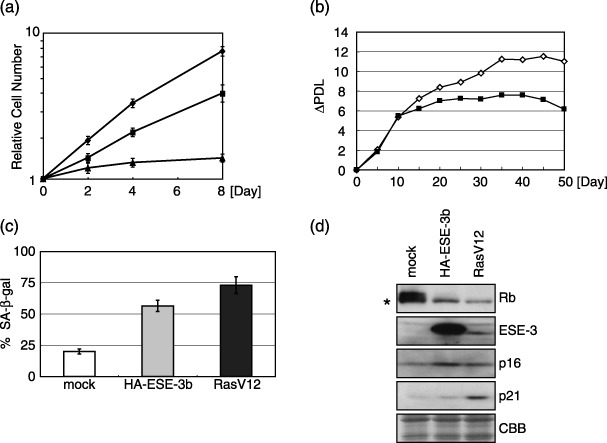
Ectopic expression of ESE‐3b induces cellular senescence phenotypes in WI‐38 cells. (a) Growth curves of HA‐ESE‐3b‐expressing (squares), RasV12‐expressing (triangles) and mock‐infected (diamonds) cells. (b) Increases of population doublings for mock (open diamonds) and HA‐ESE‐3b‐expressing (filled squares) WI‐38 cells. Cells were cultured by feeding medium at intervals. Increases of population doublings after day 6 were calculated and indicated in the vertical axis. (c) Percentages of SA‐β‐gal‐positive cells for mock (white column), HA‐ESE‐3b‐expressing (gray) and RasV12‐expressing (dark gray) WI‐38 cells at day 6. (d) Rb, ESE‐3, p16 and p21 proteins as revealed by immunoblotting analyses in mock, HA‐ESE‐3b‐ and RasV12‐expressing cells at day 6. Hypo‐phosphorylated Rb is indicated by an asterisk. The migration of ESE‐3b in HA‐ESE‐3b‐expressing cells is slower than that in RasV12‐expressing cells due to the presence of an HA tag.
ESE‐3b transactivates p16 promoter. The constitutive activation of p38 through the ectopic expression of MKK6‐EE resulted in up‐regulation of p21 (Fig. 1d) and p16INK4a (data not shown and( 14 )), as well as ESE‐3 (Fig. 2a,b). In contrast, the ectopic expression of ESE‐3 led to activation of p16INK4a but not p21 (Fig. 3d), suggesting the specific role of ESE‐3 in p16INK4a regulation. Because it is well established that Ets1 and Ets2, founding members of the Ets transcription factor family, directly activate the p16INK4a gene promoter during Ras‐induced senescence,( 10 ) the authors were interested in the possibility that ESE‐3 also activates the p16INK4a promoter. It was reported that the p16INK4a promoter construct containing 247 nucleotides upstream of the p16 translation start site (designated –247) is activated by RasV12, MEK, Ets1 or Ets2 through direct binding of Ets1/2 to the Ets‐binding sequence that is conserved between human and mouse (–108~–102 in the human sequence, EBS1 in Fig. 4a).( 10 ) The Ets‐binding motif consists of the core sequence of GGAA. EBS1 contains two tandemly positioned copies of this core sequence. Another potential Ets‐binding sequence present in the human gene but not in the mouse gene was noted (–121~–118, EBS2 in Fig. 4a), but its contribution to Ets2‐induced p16INK4a activation appeared negligible.( 10 ) It was found that ESE‐3b significantly activated the –247 promoter construct as efficiently as Ets2 in young WI‐38 cells (Fig. 4b). Moreover, ESE‐3bΔC, which lacks a region within the C‐terminal DNA‐binding Ets domain (a.a. 258–300, Fig. 4d), did not activate the reporter, suggesting the specificity of the ESE‐3b‐induced activation. In contrast, the Mut1 reporter construct having nucleotide substitutions at EBS1 was activated to a significantly less extent by the wild‐type ESE‐3b, indicating the importance of EBS1 (Fig. 4c). The Mut2 reporter construct having nucleotide substitutions at both EBS1 and EBS2 did not show further reduction in ESE‐3b‐induced activation, suggesting the relatively minor role of EBS2 in this setting as reported for Ets2‐induced p16 activation.( 10 ) Taken together, it was shown that over‐expressed ESE‐3b activates the p16INK4a promoter in a manner dependent on EBS1.
Figure 4.
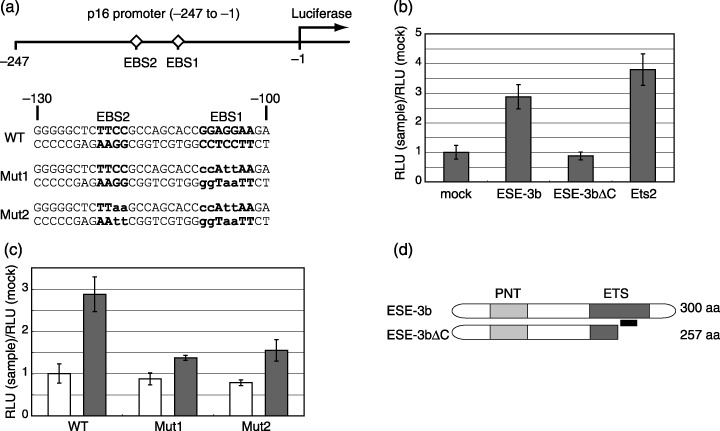
ESE‐3b activates p16INK4a promoter. (a) The p16INK4a promoter construct (–247) was fused with the luciferase gene.( 10 ) Potential Ets‐binding sequences (EBS1 and EBS2) present in the region are indicated by bold letters. Sequences of mutant –247 reporter constructs (Mut1 and Mut2( 10 )) are shown with substituted nucleotides in lowercase. Nucleotide numbers are counted from the translation initiation site. (b) Reporter assays of wild‐type –247 construct in young WI‐38 cells. Empty pcDNA3 (mock), pcDNA3 encoding the wild‐type ESE‐3b (ESE‐3b), the C‐terminally truncated form of ESE‐3b (Ese‐3bΔC), or Ets2 was cotransfected with the –247 reporter plasmid into young WI‐38 cells. Reporter activity was calibrated to the transfection efficiency. The value obtained for the mock experiment was set at 1. RLU, relative luciferase unit. (c) Reporter assays of the wild‐type (WT), Mut1 and Mut2–247 constructs in young WI‐38 cells. Empty pcDNA3 (white bars) or HA‐ESE‐3b‐expressing pcDNA3 was cotransfected with the indicated reporter plasmids into young WI‐38 cells. Reporter activity was calibrated to transfection efficiency, and activity measured by the indicated reporters is shown. (d) Schematic of ESE‐3b (wild‐type) and ESE‐3bΔC (C‐terminal truncated mutant) is shown. Light and dark gray boxes represent PNT (pointed) and Ets domains, respectively. The PNT domain is suggested to function as a protein–protein interaction domain. Black bar indicates a potential nucleotide‐associating site within the Ets domain.
The binding activity of ESE‐3 protein to EBS1 was analyzed using EMSA. WI‐38 cells were infected with LacZ‐expressing or ESE‐3b‐expressing adenoviruses. The adenovirus‐encoded ESE‐3 protein lacks any tag sequence. ESE‐3b protein was found in the nuclear fraction, under the condition that cytoplasmic c‐Raf and nuclear histone H2B proteins were detected in cytoplasmic and nuclear fractions, respectively, as expected (Fig. 5a). A 47‐bp oligonucleotide containing EBS1 and EBS2 (–134~–88) labeled with biotin at both 5′‐termini (Fig. 5b) was incubated with nuclear protein fractions derived from LacZ‐ or ESE‐3b‐expressing WI‐38 cells, and subjected to EMSA as described in the experimental procedures (Fig. 5c). A slowly migrating intense band was observed when nuclear proteins derived from ESE‐3b‐expressing WI‐38 cells (lane 3), but not from LacZ‐expressing cells (lane 1), were used. This band represents the ESE‐3b‐oligonucleotide complex because the addition of anti‐ESE‐3 antibody (lane 4), but not that of anti‐tubulin antibody (lane 5), further retarded the band migration. The signal intensity of the band was significantly reduced when 100‐fold excess of non‐biotinylated probe was included in the reaction (lane 6), further indicating the specificity of the reaction.
Figure 5.
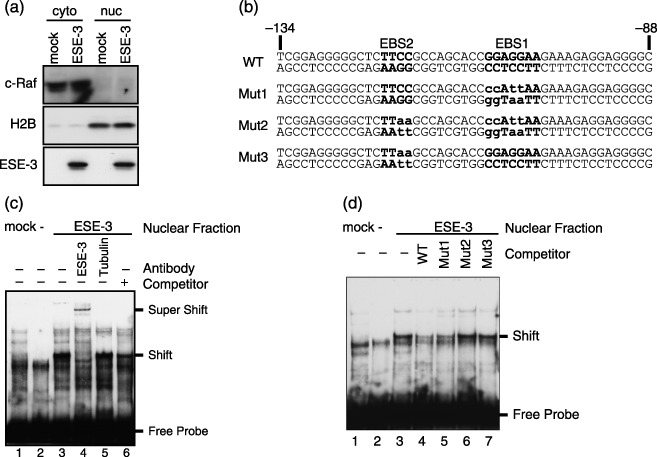
ESE‐3b binds to EBS sequences in the p16INK4a promoter. (a) Adenovirus encoding ESE‐3b produced nuclear ESE‐3b protein in WI‐38 cells. WI‐38 cells were infected with mock or ESE‐3b‐expressing adenoviruses. Cytoplasmic (cyto) and nuclear (nuc) protein fractions were immunoblotted with anti‐c‐Raf, anti‐H2B or 5A5.5 antibodies (right). (b) Oligonucleotide probes used in EMSA. Nucleotide numbers relative to the translation initiation site are indicated. Bold and lower case letters indicate EBS1 and EBS2, and mutated nucleotides, respectively. (c) Wild‐type oligonucleotide probe was incubated with nuclear protein derived from LacZ‐expressing (mock, lane 1) or ESE‐3b‐expressing (ESE‐3. lanes 3–6) WI‐38 cells, or without any nuclear protein (lane 2). The oligonucleotide‐protein complex was subjected to EMSA with or without antibodies or 100‐fold excess of cold wild‐type competitor, as indicated. The positions of the free probe, the oligonucleotide/ESE‐3b complex (Shift) and the complex further retarded for migration by anti‐ESE‐3b incubation (Super Shift) are indicated. (d) The wild‐type probe was subjected to EMSA with ESE‐3b‐containing nuclear protein. 100‐fold excess of unbiotinylated cold competitor of wild‐type (WT), Mut1, Mut2 or Mut3 oligonucleotides was included in the reaction mixture as indicated.
To investigate whether ESE‐3b recognizes EBS1 or EBS2 in the oligonucleotide probe, mutant probes harboring nucleotide substitutions at the core sequence of EBS1 (Mut1), EBS2 (Mut3) or both (Mut2) were prepared (Fig. 5b). It was found that ESE‐3b and Mut1 formed a complex showing mobility indistinguishable from that of the complex formed by ESE‐3b and the wild‐type probe (data not shown and Fig. 5d). This result suggests that ESE‐3b binds to EBS2. To estimate the relative affinity of ESE‐3b to EBS1 and EBS2, the biotinylated wild‐type probe, together with 100‐fold excess of unbiotinylated competitors of either wild‐type, Mut1, Mut2 or Mut3, was incubated with ESE‐3b‐containing nuclear protein fractions (Fig. 5d). The signal intensity of the complex was reduced by the competitors in the order of WT > Mut1 >> Mut2 = Mut3, indicating that the mutations in EBS1 did not result in a large loss of binding between the probe and ESE‐3b, whereas those in EBS2 did. Therefore, the EMSA experiment suggested that although both EBS1 and EBS2 are binding targets of ESE‐3b, EBS2 is preferred to EBS1.
Discussion
It has been argued that cellular senescence plays an adaptive role as a tumor suppressing activity.( 6 , 26 ) However, as most studies have been conducted in culture systems, the question whether it indeed operates in vivo has been left unanswered until very recently, when it was found that cellular senescence actively inhibits progression from premalignant to malignant tumors in vivo. ( 27 , 28 , 29 , 30 , 31 ) Therefore, it is important to understand the molecular pathways leading to cellular senescence, because the genes involved in such pathways likely function as tumor‐suppressors and are subject to a selective pressure to be mutated during tumor progression.
Premature senescence is elicited by a number of stimuli, among which the Ras‐induced senescence has been most frequently studied. Ras provokes several distinct downstream pathways. Among them, it is well established that the Ras–MAPK (Raf–Mek–Erk) pathway is responsible for the induction of Ras‐induced senescence.( 9 ) It has been demonstrated that Ets1 and/or Ets2, which are known to be phosphorylated and activated by Erk( 32 ) bind to the p16INK4a promoter to induce p16 in Ras‐induced senescence.( 10 ) Together, it is believed that the MAPK–Ets–p16 pathway plays a central role in p16INK4a induction in Ras‐induced cellular senescence. However, it remains to be examined whether this scenario is relevant to other types of senescence such as those induced by inappropriate culture conditions or oxidative stress.
The authors analyzed the expression profile of normal human fibroblasts in which p38 was constitutively activated. Because p38 is activated in most, if not all, cases of cellular senescence, and is involved in cellular senescence induction, we expected to identify molecules commonly involved in the diverse forms of cellular senescence. It has been previously reported that eight genes are up‐regulated in MEK1 (MAPKK in the Ras‐MAPK pathway)‐induced cellular senescence but not in transformed cells.( 27 ) Among these, five genes were analyzed in the present microarray experiment: One (MCL1) was up‐regulated whereas the remaining four (CST1, CDKN2B, BHLHB2 and NFYA) were not detected for expression in either mock‐treated or MKK6‐EE‐expressing fibroblasts. These results suggest that most of these genes are indeed specifically up‐regulated in oncogene‐induced cellular senescence (OIS). Consistently, it was argued that none of the eight genes were found to be up‐regulated in a microarray study on replicative senescence.( 27 ) The authors would like to propose that the five genes identified in this study serve as molecular markers commonly positive for various types of cellular senescence, as a complement to the OIS‐specific markers identified by Collado et al. Future studies are necessary to investigate whether they are positive in senescent cells in vivo or not.
Among the five genes, it was found that ectopic expression of ESE‐3, but not of RGS5, SSAT or the effector gene of inhibin βA, induced cellular senescence phenotypes. The human Ets family consists of approximately 30 transcription factors characterized by the presence of a wHTH (winged helix‐turn‐helix)‐type DNA‐binding domain called the Ets domain (reviewed in( 33 , 34 )). The Ets domain binds to the GGAA/T core sequence. Ets1 and Ets2 are phosphorylated by MAPK Erk at threonines 38 and 72, respectively, to induce their transcriptional activation capability.( 32 ) Besides the post‐translation modification, it is known that Ets family proteins are regulated by associating with themselves (homodimerization) and other transcription factors belonging to the Ets family or other families. Some members are ubiquitously expressed (for example, Ets2), whereas others are tissue‐ and differentiation‐stage‐specific (for example, Ets1 in lymphoid organs and vascular endothelium). The members are proposed to regulate various aspects of cellular processes, including angiogenesis, lymphoid organ development, and apoptosis.
ESE‐3 is an Ets family member belonging to the ESE subgroup. Although the precise physiological function is not known, it is assumed that ESE factors are involved in epithelial cell differentiation. ESE‐3 is expressed in terminally differentiated epithelial cells in various organs including salivary gland, prostate, trachea, lung, colon, stomach, mammary gland, pancreas, kidney and bladder, but not in proliferating epithelial cells at the basal layer.( 19 , 24 ) ESE‐3 is located at 11p12, which is known as a hot spot for LOH in lung, breast and prostate carcinomas( 35 , 36 ) that originate from ESE‐3‐expressing tissues. Moreover, ESE‐3 expression levels were found to be relatively reduced in the advanced stages of tumors compared with those in the early stages.( 19 , 24 ) These observations led to the proposal that ESE‐3 functions as a tumor‐suppressor gene. The findings in the present study that ESE‐3 expression induces cellular senescence phenotypes, including retarded cellular proliferation, are consistent with the notion that ESE‐3 has a tumor‐suppressing function in vivo, and is inactivated during the transition from premalignant to malignant tumors, a hypothesis that should be tested in the future. Recently, it has been reported that siRNA‐mediated knockdown of ESE‐3/EHF resulted in premature senescence in mouse embryonal fibroblast cells and several cancer cell lines.( 37 ) It is possible that ESE‐3 shows pleiotropic effects on senescence in different cell types and/or species.
p16INK4a up‐regulation by Ets1 and Ets2 in Ras‐induced senescence is well established.( 10 ) However, ETS1 expression levels have been reported to be higher in more advanced stages of tumors (reviewed in( 33 , 34 )), an observation inconsistent with the simple hypothesis that Ets1 functions as a tumor suppressor via the induction of cellular senescence. Therefore, the relative contributions of Ets family members, including ESE‐3, to cellular senescence appear complicated and probably depend on tissue type and tumor stage. The phenotypes observed in the present study for ectopically ESE‐3‐expressing normal human fibroblasts appear relatively modest compared with those reported for ETS1‐ and ETS2‐expressing cells. It was reported that ETS1‐ or ETS2‐expressing normal human fibroblasts completely stopped growing before reaching confluence.( 10 ) Although ESE‐3b‐expressing cells showed significantly slower growth than mock‐treated cells, they did not stop growing. Similarly, ESE‐3‐expressing cells exhibited mild and partial senescence phenotypes compared with the full‐blown phenotypes found in RasV12‐expressing cells in the same experimental system used in the present study. ESE‐3b‐expressing cells showed a small number of SA‐β‐gal positive cells and induced p16 but not p21 up‐regulation. These results suggest that although ESE‐3 comprises a component of the cellular senescence‐executing pathway, it is not the sole one. Given that the Ets family proteins are activated by various post‐translational modifications and protein–protein interactions, proper modification and/or physically interacting partners may be missing in the ESE‐3b‐expressing WI‐38 cells.
The amino acid sequences around the threonine residues of Ets1 and Ets2 that are phosphorylated by MAPK Erk agree well with the proposed MAPK phosphorylation target sequences (PLLS/TP). In contrast, ESE‐3 protein does not possess such a consensus sequence, and is not phosphorylated by Erk in vitro. ( 19 ) It has been reported that the transactivation activity of Ets1 and Ets2 to the p16INK4a promoter was enhanced by cotransfection of RasV12 or MEK. ( 10 ) RasV12 expression did not cooperate with the transactivation by ESE‐3b (data not shown), further suggesting that ESE‐3 is not a direct downstream molecule of the Ras‐MAPK pathway. It has been reported that Ku70/Ku86 physically interacts with ESE‐1, the closest paralog of ESE‐3, and that this interaction reduces the DNA‐binding activity of ESE‐1.( 38 ) Future studies are required to elucidate how ESE‐3 is post‐translationally activated in senescent cells.
Supporting information
The following supplementary material is available for this article: Table S1. ESE‐3 expressions examined by the RT‐PCR experiments for the 195 genes This material is available as part of the online article from: http://www.blackwell‐synergy.com/doi/abs/10.1111/j.1349‐7006.2007.00543.x <>(This link will take you to the article abstract). Please note: Blackwell Publishing are not responsible for the content or functionality of any supplementary materials supplied by the authors. Any queries (other than missing material) should be directed to the corresponding author for the article.
Acknowledgments
We are grateful to Drs E. Nishida and Y. Goto for human MKK6 and MKK6‐EE, Dr T. Kitamura for pMX‐puro and pMX‐neo, Dr G.P. Nolan for φNX cells, Dr K. Miyazono for ALK4 and Dr E. Hara for p16INK4a promoter constructs. We thank Drs A. Nabetani and H. Iwasa for experimental support, discussions and suggestions. The excellent secretarial work of F. Nakayama, K. Saito, A. Orii, A. Katayama, M. Sakamoto and M. Sasaki is also acknowledged. This work is supported by Grant‐in‐Aid for Cancer Research from the Ministry of Education, Culture, Sports, Science and Technology, Japan.
References
- 1. Harley CB. Telomere loss: mitotic clock or genetic time bomb? Mutat Res 1991; 256: 271–82. [DOI] [PubMed] [Google Scholar]
- 2. Chen QM, Bartholomew JC, Campisi J, Acosta M, Reagan JD, Ames BN. Molecular analysis of H2O2‐induced senescent‐like growth arrest in normal human fibroblasts: p53 and Rb control G1 arrest but not cell replication. Biochem J 1998; 332: 43–50. [DOI] [PMC free article] [PubMed] [Google Scholar]
- 3. Serrano M, Lin AW, McCurrach ME, Beach D, Lowe SW. Oncogenic ras provokes premature cell senescence associated with accumulation of p53 and p16INK4a . Cell 1997; 88: 593–602. [DOI] [PubMed] [Google Scholar]
- 4. Zhu J, Woods D, McMahon M, Bishop JM. Senescence of human fibroblasts induced by oncogenic Raf. Genes Dev 1998; 12: 2997–3007. [DOI] [PMC free article] [PubMed] [Google Scholar]
- 5. Sherr CJ, DePinho RA. Cellular senescence: mitotic clock or culture shock? Cell 2000; 102: 407–10. [DOI] [PubMed] [Google Scholar]
- 6. Campisi J. Senescent cells, tumor suppression, and organismal aging: good citizens, bad neighbors. Cell 2005; 120: 513–22. [DOI] [PubMed] [Google Scholar]
- 7. Dimri GP, Lee X, Basile G et al . A biomarker that identifies senescent human cells in culture and in aging skin in vivo. Proc Natl Acad Sci USA 1995; 92: 9363–7. [DOI] [PMC free article] [PubMed] [Google Scholar]
- 8. McConnell BB, Starborg M, Brookes S, Peters G. Inhibitors of cyclin‐dependent kinases induce features of replicative senescence in early passage human diploid fibroblasts. Curr Biol 1998; 8: 351–4. [DOI] [PubMed] [Google Scholar]
- 9. Lin AW, Barradas M, Stone JC, Van Aelst L, Serrano M, Lowe SW. Premature senescence involving p53 and p16 is activated in response to constitutive MEK/MAPK mitogenic signaling. Genes Dev 1998; 12: 3008–19. [DOI] [PMC free article] [PubMed] [Google Scholar]
- 10. Ohtani N, Zebedee Z, Huot TJ et al . Opposing effects of Ets and Id proteins on p16INK4a expression during cellular senescence. Nature 2001; 409: 1067–70. [DOI] [PubMed] [Google Scholar]
- 11. Deng Q, Liao R, Wu BL, Sun P. High intensity ras signaling induces premature senescence by activating p38 pathway in primary human fibroblasts. J Biol Chem 2004; 279: 1050–9. [DOI] [PubMed] [Google Scholar]
- 12. Jung MS, Jin DH, Chae HD et al . Bcl‐xL and E1B‐19K proteins inhibit p53‐induced irreversible growth arrest and senescence by preventing reactive oxygen species‐dependent p38 activation. J Biol Chem 2004; 279: 17765–71. [DOI] [PubMed] [Google Scholar]
- 13. Wang W, Chen JX, Liao R et al . Sequential activation of the MEK‐extracellular signal‐regulated kinase and MKK3/6‐p38 mitogen‐activated protein kinase pathways mediates oncogenic ras‐induced premature senescence. Mol Cell Biol 2002; 22: 3389–403. [DOI] [PMC free article] [PubMed] [Google Scholar]
- 14. Iwasa H, Han J, Ishikawa F. Mitogen‐activated protein kinase p38 defines the common senescence‐signalling pathway. Genes Cells 2003; 8: 131–44. [DOI] [PubMed] [Google Scholar]
- 15. Olson JM, Hallahan AR. p38 MAP kinase: a convergence point in cancer therapy. Trends Mol Med 2004; 10: 125–9. [DOI] [PubMed] [Google Scholar]
- 16. Roux PP, Blenis J. ERK and p38 MAPK‐activated protein kinases: a family of protein kinases with diverse biological functions. Microbiol Mol Biol Rev 2004; 68: 320–44. [DOI] [PMC free article] [PubMed] [Google Scholar]
- 17. Ono K, Tanaka T, Tsunoda T et al . Identification by cDNA microarray of genes involved in ovarian carcinogenesis. Cancer Res 2000; 60: 5007–11. [PubMed] [Google Scholar]
- 18. Nishidate T, Katagiri T, Lin ML et al . Genome‐wide gene‐expression profiles of breast‐cancer cells purified with laser microbeam microdissection: identification of genes associated with progression and metastasis. Int J Oncol 2004; 25: 797–819. [PubMed] [Google Scholar]
- 19. Tugores A, Le J, Sorokina I et al . The epithelium‐specific ETS protein EHF/ESE‐3 is a context‐dependent transcriptional repressor downstream of MAPK signaling cascades. J Biol Chem 2001; 276: 20397–406. [DOI] [PubMed] [Google Scholar]
- 20. Hara E, Smith R, Parry D, Tahara H, Stone S, Peters G. Regulation of p16CDKN2 expression and its implications for cell immortalization and senescence. Mol Cell Biol 1996; 16: 859–67. [DOI] [PMC free article] [PubMed] [Google Scholar]
- 21. Tugores A, Alonso MA, Sanchez‐Madrid F, De Landazuri MO. Human T cell activation through the activation‐inducer molecule/CD69 enhances the activity of transcription factor AP‐1. J Immunol 1992; 148: 2300–6. [PubMed] [Google Scholar]
- 22. Raingeaud J, Whitmarsh AJ, Barrett T, Derijard B, Davis RJ. MKK3‐ and MKK6‐regulated gene expression is mediated by the p38 mitogen‐activated protein kinase signal transduction pathway. Mol Cell Biol 1996; 16: 1247–55. [DOI] [PMC free article] [PubMed] [Google Scholar]
- 23. Ashida S, Nakagawa H, Katagiri T et al . Molecular features of the transition from prostatic intraepithelial neoplasia (PIN) to prostate cancer: genome‐wide gene‐expression profiles of prostate cancers and PINs. Cancer Res 2004; 64: 5963–72. [DOI] [PubMed] [Google Scholar]
- 24. Kleinbaum LA, Duggan C, Ferreira E, Coffey GP, Buttice G, Burton FH. Human chromosomal localization, tissue/tumor expression, and regulatory function of the ets family gene EHF. Biochem Biophys Res Commun 1999; 264: 119–26. [DOI] [PubMed] [Google Scholar]
- 25. Kas K, Finger E, Grall F et al . ESE‐3, a novel member of an epithelium‐specific ets transcription factor subfamily, demonstrates different target gene specificity from ESE‐1. J Biol Chem 2000; 275: 2986–98. [DOI] [PubMed] [Google Scholar]
- 26. Lowe SW, Cepero E, Evan G. Intrinsic tumour suppression. Nature 2004; 432: 307–15. [DOI] [PubMed] [Google Scholar]
- 27. Collado M, Gil J, Efeyan A et al . Tumour biology: senescence in premalignant tumours. Nature 2005; 436: 642. [DOI] [PubMed] [Google Scholar]
- 28. Braig M, Lee S, Loddenkemper C et al . Oncogene‐induced senescence as an initial barrier in lymphoma development. Nature 2005; 436: 660–5. [DOI] [PubMed] [Google Scholar]
- 29. Lazzerini Denchi E, Attwooll C, Pasini D, Helin K. Deregulated E2F activity induces hyperplasia and senescence‐like features in the mouse pituitary gland. Mol Cell Biol 2005; 25: 2660–72. [DOI] [PMC free article] [PubMed] [Google Scholar]
- 30. Michaloglou C, Vredeveld LC, Soengas MS et al . BRAFE600‐associated senescence‐like cell cycle arrest of human naevi. Nature 2005; 436: 720–4. [DOI] [PubMed] [Google Scholar]
- 31. Chen Z, Trotman LC, Shaffer D et al . Crucial role of p53‐dependent cellular senescence in suppression of Pten‐deficient tumorigenesis. Nature 2005; 436: 725–30. [DOI] [PMC free article] [PubMed] [Google Scholar]
- 32. Yang BS, Hauser CA, Henkel G et al . Ras‐mediated phosphorylation of a conserved threonine residue enhances the transactivation activities of c‐Ets1 and c‐Ets2. Mol Cell Biol 1996; 16: 538–47. [DOI] [PMC free article] [PubMed] [Google Scholar]
- 33. Oikawa T. ETS transcription factors: possible targets for cancer therapy. Cancer Sci 2004; 95: 626–33. [DOI] [PMC free article] [PubMed] [Google Scholar]
- 34. Dittmer J. The biology of the Ets1 proto‐oncogene. Mol Cancer 2003; 2: 29. [DOI] [PMC free article] [PubMed] [Google Scholar]
- 35. Mitelman F, Mertens F, Johansson B. A breakpoint map of recurrent chromosomal rearrangements in human neoplasia. Nat Genet 1997; 15 Spec No: 417–74. [DOI] [PubMed] [Google Scholar]
- 36. Dahiya R, McCarville J, Lee C et al . Deletion of chromosome 11p15, p12, q22, q23‐24 loci in human prostate cancer. Int J Cancer 1997; 72: 283–8. [DOI] [PubMed] [Google Scholar]
- 37. Park C, Lee I, Kang WK. Influence of small interfering RNA corresponding to ets homologous factor on senescence‐associated modulation of prostate carcinogenesis. Mol Cancer Ther 2006; 5: 3191–6. [DOI] [PubMed] [Google Scholar]
- 38. Wang H, Fang R, Cho JY, Libermann TA, Oettgen P. Positive and negative modulation of the transcriptional activity of the ETS factor ESE–1 through interaction with p300, CREB‐binding protein, and Ku 70/86. J Biol Chem 2004; 279: 25241–50. [DOI] [PubMed] [Google Scholar]
Associated Data
This section collects any data citations, data availability statements, or supplementary materials included in this article.
Supplementary Materials
The following supplementary material is available for this article: Table S1. ESE‐3 expressions examined by the RT‐PCR experiments for the 195 genes This material is available as part of the online article from: http://www.blackwell‐synergy.com/doi/abs/10.1111/j.1349‐7006.2007.00543.x <>(This link will take you to the article abstract). Please note: Blackwell Publishing are not responsible for the content or functionality of any supplementary materials supplied by the authors. Any queries (other than missing material) should be directed to the corresponding author for the article.