

Abstract
CpG island hypermethylation is frequently found during gastric carcinogenesis. We investigated methylation profiles of p16, LOX, HAND1, THBD, p41ARC, and APC along multistep gastric carcinogenesis and determined their association with Helicobacter pylori infection. Methylation levels in these six genes were evaluated in noncancerous gastric biopsy specimens using quantitative methylation‐specific PCR in 459 patients with gastric cancer (GC), 137 with dysplasia, and 248 controls. Controls were divided into four subgroups sorted by current H. pylori infection status (active vs past or negative infection) and the presence of intestinal metaplasia (IM). In controls, active H. pylori infection significantly increased methylation levels in THBD, LOX, and HAND1 (all P < 0.001), and hypermethylation of THBD, HAND1, and APC was associated with IM. Aberrant DNA hypermethylation was correlated well with activity of H. pylori‐associated gastritis. However, methylation levels in LOX, HAND1, THBD, and p41ARC remained increased in cases with past H. pylori infection compared to those that were H. pylori negative (all P < 0.05). Hypermethylation of THBD, and possibly p16, was significantly associated with GC, regardless of the status of current H. pylori infection (all P < 0.05). These results suggest that aberrant DNA hypermethylation caused by H. pylori‐associated gastritis occurs in a gene‐specific manner along gastric carcinogenesis, which can be persistent even after the disappearance of H. pylori. Aberrant methylation of THBD might provide a link between H. pylori infection and development of GC. (Cancer Sci 2010)
Promoter CpG island (CGI) hypermethylation is an important mechanism for the silencing of tumor suppressor genes, and has been identified among the earliest and most common alterations in human cancers.( 1 ) Gastric cancer (GC) is known to be associated with tumor‐suppressor or tumor‐related genes that are inactivated more frequently by CGI hypermethylation than by mutations.( 2 ) CGI hypermethylation has also been found in the adjacent noncancerous tissues of patients with GC and in non‐neoplastic gastric mucosa of subjects without GC.( 3 )
It is now generally accepted that Helicobacter pylori infection is an important etiological risk factor for GC. Gastric carcinogenesis is regarded as a multistep process with a postulated intestinal metaplasia (IM)‐dysplasia‐invasive carcinoma sequence that occurs during morphologic progression;( 4 ) this “Correa cascade” is promoted by H. pylori infection which causes a chronic active inflammation with severe oxidative damage of the gastric mucosa.( 5 ) Several reports have suggested association of H. pylori infection with specific gene promoter methylation,( 6 , 7 ) and H. pylori‐associated active inflammation seems to be responsible for the promoter CGI hypermethylation.( 2 , 8 , 9 ) However, it is still unclear whether aberrant DNA hypermethylation remains persistent even after active H. pylori infection discontinues.
In this study, we used quantitative profiling of DNA methylation states in a panel of six GC‐associated genes (p16, LOX, HAND1, THBD, p41ARC, and APC) in a large case–control study. Among them, p16, LOX, and APC are tumor‐suppressor genes.( 2 ) Although the p16 core region is resistant to methylation,( 10 ) hypermethylation in this region was reported to be critical for p16 silencing and is associated with H. pylori infection in gastric precancerous lesions.( 11 ) In addition, LOX, HAND1, and THBD genes have been reported to be frequently methylated in GC, which were silenced by CGI hypermethylation.( 12 ) p41ARC and APC have been also reported frequently methylated in GC.( 13 , 14 ) This study was performed to investigate the methylation profiles of p16, LOX, HAND1, THBD, p41ARC, and APC along multistep gastric carcinogenesis in the condition of current H. pylori infection (positive for endoscopy‐based tests) or a past one (H. pylori serology‐positive only), to find a link between H. pylori infection and development of GC.
Materials and Methods
Subjects. Enrollment of 459 patients with primary GC, 137 patients with dysplasia, and 248 controls was carried out at Seoul National University Bundang Hospital from 2003 to 2008. All subjects were of Korean origin. Most of them had undergone a standard gastroscopy as part of a screening program for premalignant gastric mucosal lesions or GC. All GC or dysplasia patients were histologically confirmed to have gastric adenocarcinoma or dysplasia, respectively. When the endoscopy did not show any evidence of GC, dysplasia, mucosa‐associated lymphoid tissue lymphoma, esophageal cancer, or peptic ulcer, the subjects were enrolled as controls. Next, the controls were divided into four subgroups sorted by the status of current H. pylori infection (active vs past or negative infection) and the presence of IM for further analysis. If there was histological evidence of IM in either the antral or body biopsy specimens, the subject was defined as IM positive. The study protocol was approved by the Ethical Committee at Seoul National University Bundang Hospital. All subjects, who provided informed consent, were asked to complete a questionnaire, which included questions regarding demographic information (age and gender) and socioeconomic habits (smoking and drinking). Patients with a history of H. pylori eradication were excluded from the study.
Helicobacter pylori testing and histology. To determine the presence of a current H. pylori infection, 10 biopsy specimens were obtained for three types of H. pylori testing (histology, the Campylobacter‐like organism [CLO] test, and culture). Among them, two from the greater curvature side of the antrum and two from the body were fixed in formalin to assess the presence of H. pylori (by modified Giemsa staining) and the degree of inflammatory cell infiltration, atrophy, and IM (all determined by hematoxylin–eosin staining). These histologic features of the gastric mucosa were recorded using the updated Sydney scoring system (i.e. 0 = none, 1 = slight, 2 = moderate, and 3 = marked).( 15 ) One specimen from each, the lesser curvature of the antrum and the body, was used for rapid urease testing (CLOtest; Delta West, Bentley, Australia), and two specimens from the antrum and from the body, respectively, were used for culture, and the organisms present were identified as H. pylori by Gram staining, colony morphology, and positive oxidase, catalase, and urease reactions. In addition, anti‐H. pylori immunoglobulin G was determined qualitatively using an enzyme‐linked immunosorbent assay (Genedia H. pylori ELISA; Green Cross Medical Science, Eumseong, Korea). If the H. pylori serology was positive but no bacteria were found on the histology or CLO test or culture, the diagnosis was a past H. pylori infection without evidence of current ongoing infection. The remaining biopsy specimens were immediately frozen at −70°C until DNA extraction.
DNA preparation. Genomic DNA was extracted directly from noncancerous antral biopsy specimens. Briefly, specimens were homogenized in proteinase K solution (20 mmol/L Tris–HCl [pH 8.0], 10 mmol/L ethylenediaminetetraacetic acid, 0.5% sodium dodecyl sulfate, and 10 mg/mL proteinase K) using a sterile micropestle, and then incubated for 3 h at 52°C. DNA was isolated from homogenates by phenol/chloroform extraction and ethanol precipitation.
Sodium bisulfite modification of DNA and quantitative methylation‐specific PCR. DNA was subjected to sodium bisulfite modification.( 16 ) In summary, 1 μg of DNA was denatured with 1 M NaOH, followed by treatment with 550 μL bisulfite/hydroquinone solutions for 16–18 h at 55°C. Following purification using a JETSORB gel extraction kit (Genomed, Bad Oeynhausen, Germany), the DNA was treated with 3 M NaOH and precipitated with three volumes of 100% ethanol and a one‐third volume of 7.5 M ammonium acetate at −20°C. The precipitated DNA was washed with 70% ethanol and was dissolved in distilled water. The six genes (p16, LOX, HAND1, THBD, p41ARC, and APC) were analyzed for their methylation status. For the p16, LOX, HAND1, and APC genes, core regions of their promoter CGIs were measured. For THBD, the noncore region of its promoter CGI was evaluated because the core region was not methylated.( 13 ) For p41ARC, we analyzed its exon CGI (exon 8), which was frequently methylated in GC.( 12 ) For the APC gene, among two promoters identified (1A and 1B), we analyzed the methylation of the APC 1A promoter,( 17 ) because no methylation of the APC 1B promoter has ever been detected in the stomach.( 14 ) The primer sequences and PCR conditions are shown in Table 1. An aliquot of 2 μL was used for real‐time PCR with a primer set specific to methylated or unmethylated sequences, with a specific annealing temperature of 53–66°C. Real‐time PCR was performed using 2× SYBR Premix Ex Taq (Takara Bio, Shiga, Japan) and the ABI Prism 7000 Sequence Detection System (Applied Biosystems, Foster, CA, USA). Standard DNA was prepared by cloning PCR products into the pGEM‐T Easy vector (Promega, Madison, WI, USA), or was kindly provided by Professor T. Ushijima’s laboratory (National Cancer Center Research Institute, Tokyo, Japan). The number of molecules in a test sample was determined by comparing the amplification with those of standard samples containing a known number of molecules (106 − 101). The number of methylated and unmethylated molecules was measured separately, and the methylation level was calculated as following: (Methylation level) = (Number of methylated molecules)/{Total number of DNA molecules (methylated + unmethylated molecules)}.
Table 1.
Primer sequences and PCR conditions for real‐time methylation‐specific PCR
| Genes | Primer sequence | Size (bp) | AT (°C) | ||
|---|---|---|---|---|---|
| Forward (5′–3′) | Reverse (5′–3′) | ||||
| p16 | M | 5′‐TTG GTA GTT AGG AAG GTT GTA TCG C‐3′ | 5′‐TCC CTA CTC CCA ACC GCG‐3′ | 126 | 66 |
| UM | 5′‐GGT AGT TAG GAA GGT TGT ATT GT‐3′ | 5′‐TCC CTA CTC CCA ACC ACA‐3′ | 124 | 60 | |
| LOX | M | 5′‐ATA AAT AGT TGA GGG GCG GTC‐3′ | 5′‐CGA CAA TCC CGA AAA ACG‐3′ | 120 | 61 |
| UM | 5′‐ATA AAT AGT TGA GGG GTG GTT‐3′ | 5′‐ACA ACA ATC CCA AAA AAC A‐3′ | 121 | 58.5 | |
| HAND1 | M | 5′‐ATA GTT TAG GGC GTT GGT C‐3′ | 5′‐CTA CTC TAC GAA CTT AAA AAA ACG‐3′ | 100 | 57 |
| UM | 5′‐AAT AGT TTA GGG TGT TGG TT‐3′ | 5′‐CTA CTC TAC AAA CTT AAA AAA ACA‐3′ | 101 | 55 | |
| THBD | M | 5′‐CGT TCG TTT TTA TTC GGC GTC‐3′ | 5′‐GCC AAA CCC CAT CTC ATC G‐3′ | 118 | 60 |
| UM | 5′‐ATG TGT TTG TTT TTA TTT GGT GTT‐3′ | 5′‐CAA ACC CCA TCT CAT CAA A‐3′ | 119 | 56 | |
| p41ARC | M | 5′‐CGT GTT TTT AAT TCG TTG CGT C‐3′ | 5′‐CGA CCT CTA CCG ACC TCC G‐3′ | 133 | 64 |
| UM | 5′‐GGT GTG TTT TTA ATT TGT TGT GTT‐3′ | 5′‐CAA CCT CTA CCA ACC TCC A‐3′ | 135 | 60 | |
| APC | M | 5′‐TAT TGC GGA GTG CGG GTC‐3′ | 5′‐TCA ACG AAC TCC CGA CGA‐3′ | 98 | 62 |
| UM | 5′‐GTG TTT TAT TGT GGA GTG TGG GTT‐3′ | 5′‐CCA ATC AAC AAA CTC CCA ACA A‐3′ | 108 | 62 | |
AT, annealing temperature; bp, base pair; M, methylated sequence; UM, unmethylated sequence.
The reproducibility of the methylation proportions obtained by quantitative methylation‐specific PCR was analyzed for the HAND1 and p16 CGIs, following a Japanese study.( 18 ) Briefly, test DNA samples were prepared by mixing the DNA that was completely methylated by SssI methylase with that of samples where no methylation was detected with methylation ratios (60%, 6%, 4.5%, 3%, 1.5%, and 0.8%). The same DNA was modified by bisulfite on two different dates, and each group was analyzed in triplicates. The methylation levels were fairly reliable (Supporting information, Fig. S1).
Statistical analysis. Initially, univariate analysis was performed to evaluate whether any significant difference was present in demographic or clinical features among the study groups. Then, the methylation levels of the genes under study were compared between the study groups. As most of the data on methylation profiles were skewed and in some cases heterogeneity of variances was observed, rank‐transformed anova was used to compare the four subgroups in controls sorted by the absence or presence of current H. pylori infection and IM; it was also used to compare the methylation levels in the six genes with regard to the three categorized H. pylori infection statuses (negative, current, and past). The Bonferroni method was applied for multiple comparisons. In addition, unconditional multivariate logistic regression analysis stratified for the status of current H. pylori infection was performed to compare the methylation levels in the six genes between controls and patients with dysplasia or GC, adjusted for age, gender, and smoking and drinking habits. For this analysis, the methylation levels in each gene were binomially categorized. For the analysis of the match‐paired samples, we used the Wilcoxon’s sign paired test. Differences were considered significant when the P‐values were <0.05. All analyses were performed using the statistical software package SAS (version 9.1; SAS Institute, Cary, NC, USA) or spss (version 12.0; SPSS, Chicago, IL, USA).
Results
Subject characteristics. The distribution of selected demographic variables in controls, patients with dysplasia, and GC patients are shown in Table 2. When controls were categorized based on the presence of IM and H. pylori infection, there was no significant difference in demographic and clinical variables among the four groups, except for age (P < 0.001). That is, subjects with IM were significantly older than those without IM. On the other hand, there were marked demographic and clinical differences between controls and the patients with GC. Therefore, controls were randomly sampled to match the GC cases by age (within ± 5 years) and gender for the comparison between the two groups, stratified for the status of current H. pylori infection. There were 56 H. pylori‐negative and 140 H. pylori‐positive case–control pairs matched to investigate the role of methylation in the gastric carcinogenesis.
Table 2.
Characteristics of subjects
| No. of subjects (%) | |||||||
|---|---|---|---|---|---|---|---|
| Controls (n = 248) | Patients with dysplasia | GC patients | |||||
| IM negative* | IM positive* | P‐values‡ | |||||
| Hp negative† | Hp positive† | Hp negative† | Hp positive† | ||||
| Group A | Group B | Group C | Group D | ||||
| (n = 76) | (n = 65) | (n = 30) | (n = 77) | (n = 137) | (n = 459) | ||
| Females | 57 (75.0) | 41 (63.1) | 19 (63.3) | 49 (63.6) | 0.358 | 36 (26.3) | 154 (33.6) |
| Age (years, mean ± SD) | 48.8 ± 12.8 | 50.4 ± 12.1 | 57.6 ± 9.5§ | 55.9 ± 11.2¶ | < 0.001 | 63.1 ± 9.0 | 59.5 ± 11.7 |
| Hp status | 123 (89.8) | 398 (86.7) | |||||
| Hp negative | 58 (76.3) | 0 (0.0) | 19 (63.3) | 0 (0.0) | 23 (16.8) | 59 (12.9) | |
| Current active infection | 0 (0.0) | 65 (100.0) | 0 (0.0) | 77 (100.0) | 92 (67.2) | 327 (71.2) | |
| Past infection | 18 (23.7) | 0 (0.0) | 11 (36.7) | 0 (0.0) | 22 (16.1) | 73 (15.9) | |
| Diffuse type | – | – | – | – | – | 197 (42.9) | |
| Smoking | (n = 236) | (n = 131) | (n = 434) | ||||
| Nonsmoker | 54 (75.0) | 44 (68.8) | 18 (66.7) | 50 (68.5) | 0.772 | 44 (33.6) | 155 (35.7) |
| Current/ex‐smoker | 18 (25.0) | 20 (31.3) | 9 (33.3) | 23 (31.5) | 87 (66.4) | 279 (64.3) | |
| Drinking | (n = 228) | (n = 130) | (n = 434) | ||||
| Never/rare drinker | 14 (20.0) | 16 (26.2) | 5 (18.5) | 15 (21.4) | 0.800 | 69 (53.1) | 223 (51.4) |
| Current/ex‐drinker | 56 (80.0) | 45 (73.8) | 22 (81.5) | 55 (78.6) | 61 (46.9) | 211 (48.6) | |
| Intestinal metaplasia | |||||||
| Antrum | (n = 248) | (n = 135) | (n = 451) | ||||
| None | 76 (100.0) | 65 (100.0) | 9 (30.0) | 15 (19.5) | – | 29 (21.5) | 140 (31.0) |
| Mild | 0 (0.0) | 0 (0.0) | 9 (30.0) | 29 (37.7) | 40 (29.6) | 123 (27.3) | |
| Moderate/severe | 0 (0.0) | 0 (0.0) | 12 (40.0) | 33 (42.9) | 66 (48.9) | 188 (41.7) | |
| Corpus | (n = 248) | (n = 135) | (n = 449) | ||||
| None | 76 (100.0) | 65 (100.0) | 12 (40.0) | 32 (41.6) | – | 46 (34.1) | 229 (51.0) |
| Mild | 0 (0.0) | 0 (0.0) | 10 (33.3) | 23 (29.9) | 36 (26.7) | 96 (21.4) | |
| Moderate/severe | 0 (0.0) | 0 (0.0) | 8 (26.7) | 22 (28.6) | 53 (39.3) | 124 (27.6) | |
Counts within categories may not be the sum of the total shown at the top of the table owing to missing data. *IM positive denotes any histological evidence of intestinal metaplasia in either the antrum or body. †Hp positive refers to a current active Helicobacter pylori infection, and Hp negative includes those with a past H. pylori infection (H. pylori serology‐positive only, as well as those negative to all H. pylori tests (CLOtest, histology, culture, and serology). ‡P‐values for chi‐squared test or one‐way anova analysis for the comparison of variables across groups. Post‐hoc HSD‐Turkey test for pair‐wise comparisons between groups; §P = 0.003 for Group A versus Group C; ¶P = 0.030 for Group B versus Group D. Current infection refers to positivity for any one of the endoscopy‐based H. pylori tests, and past infection positive for H. pylori serology only. Hp, H. pylori; IM, intestinal metaplasia.
Aberrant methylation in gastric mucosa with regard to Helicobacter pylori infection and intestinal metaplasia. In controls, the methylation levels in the six genes were analyzed in the four subgroups sorted by the status of H. pylori infection (active vs negative or past infection) and the presence of IM (Fig. 1). For LOX (Fig. 1b), HAND1 (Fig. 1c), and THBD (Fig. 1d), methylation levels in H. pylori‐positive cases were significantly increased compared to the levels in H. pylori‐negatives (P < 0.001). IM significantly increased the methylation levels in HAND1 and THBD among H. pylori‐negative cases (Group A vs Group C, defined in Fig. 1, P < 0.05). On the other hand, methylation levels in APC (Fig. 1f) were significantly decreased with H. pylori among IM‐negative cases (Group A vs Group B, P = 0.016), but were increased with IM, especially in the presence of H. pylori (Group B vs Group D, P = 0.004). For p16 (Fig. 1a) and p41ARC (Fig. 1e), there was no significant association of their methylation levels with H. pylori infection and/or IM.
Figure 1.
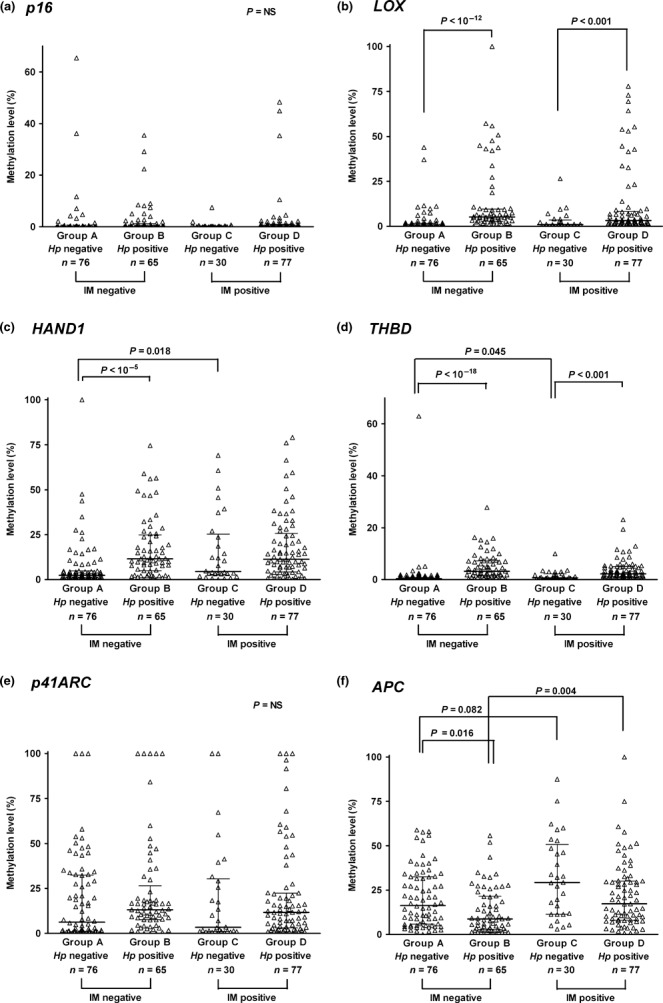
Methylation levels in the six genes: p16 (a), LOX (b), HAND1 (c), THBD (d), p41ARC (e), and APC (f) according to the presence of current active Helicobacter pylori (Hp) infection and intestinal metaplasia (IM) in controls (n = 248). “Hp positive” refers to a current active H. pylori infection, and “Hp negative” includes those with a past H. pylori infection (serology‐positive only), as well as negatives to all H. pylori tests (CLOtest, histology, culture, and serology). “IM positive” denotes any histological evidence of IM in either the antrum or body. Results are given as median and interquartile range. Helicobacter pylori significantly increased methylation in LOX, HAND1, and THBD, and IM was associated with hypermethylation in HAND1, THBD (in the absence of current H. pylori infection, P < 0.05), and APC (especially in the presence of H. pylori, P = 0.003).
Persistent DNA hypermethylation caused by Helicobacter pylori after the Helicobacter pylori‐associated gastritis discontinues. In the overall study population, we evaluated the association between histologic grades of H. pylori‐associated gastritis and aberrant DNA hypermethylation in the six genes under study (Table 3). All genes except for APC were positively correlated with H. pylori density, polymorphous nuclear cell (PMN), and mononuclear cell infiltration in histology. Intriguingly, hypermethylation of the APC gene was negatively correlated with H. pylori density, as well as PMN and mononuclear cell infiltration. In addition, HAND1, THBD, and APC genes were positively correlated with the grade of IM.
Table 3.
Correlations between methylation levels in p16, LOX, HAND1, THBD, p41ARC, and APC genes, and histologic grades of Helicobacter pylori‐associated gastritis and/or intestinal metaplasia
| Histologic findings | n | Methylation level (median, %) | |||||
|---|---|---|---|---|---|---|---|
| p16 | LOX | HAND1 | THBD | p41ARC | APC | ||
| Density of H. pylori (n = 839) | |||||||
| 0 | 471 | 0.07 | 1.09 | 5.50 | 1.81 | 10.41 | 21.83 |
| 1 | 141 | 0.31 | 2.35 | 12.94 | 7.44 | 16.55 | 18.53 |
| 2 | 162 | 0.19 | 4.04 | 11.92 | 5.54 | 14.75 | 15.33 |
| 3 | 65 | 0.10 | 4.35 | 11.59 | 7.16 | 16.94 | 13.25 |
| ρ† | 0.087* | 0.265**** | 0.168**** | 0.292**** | 0.169**** | −0.160**** | |
| Polymorphous nuclear cell infiltration (n = 837) | |||||||
| 0 | 283 | 0.00 | 0.91 | 4.37 | 1.31 | 8.35 | 20.56 |
| 1 | 212 | 0.16 | 1.54 | 8.18 | 3.15 | 13.20 | 23.24 |
| 2 | 307 | 0.21 | 3.00 | 11.75 | 6.10 | 15.50 | 14.83 |
| 3 | 35 | 0.21 | 5.57 | 10.76 | 7.42 | 23.42 | 10.56 |
| ρ† | 0.108** | 0.231**** | 0.196**** | 0.309**** | 0.220**** | −0.123*** | |
| Mononuclear leukocyte infiltration (n = 836) | |||||||
| 0 or 1‡ | 218 | 0.00 | 0.56 | 3.00 | 1.21 | 9.41 | 20.95 |
| 2 | 559 | 0.18 | 2.40 | 10.58 | 4.76 | 13.61 | 18.48 |
| 3 | 59 | 0.25 | 5.52 | 11.75 | 5.55 | 16.40 | 17.49 |
| ρ† | 0.115*** | 0.265**** | 0.233**** | 0.281**** | 0.151**** | −0.071* | |
| Grade of IM (n = 834) | |||||||
| 0 | 334 | 0.07 | 1.98 | 5.71 | 2.13 | 13.89 | 16.33 |
| 1 | 201 | 0.19 | 1.97 | 9.75 | 4.54 | 14.68 | 19.73 |
| 2 | 224 | 0.13 | 1.92 | 11.02 | 4.09 | 12.48 | 21.84 |
| 3 | 75 | 0.08 | 1.61 | 10.04 | 4.81 | 10.41 | 24.89 |
| ρ† | 0.019 | −0.007 | 0.125*** | 0.091** | −0.027 | 0.143**** | |
Sum of counts within categories may not be same as the number of overall study subjects (n = 844) owing to missing data. The histologic scores of the gastric mucosa were recorded following the updated Sydney scoring system (0 = none, 1 = slight, 2 = moderate, and 3 = marked). †Spearman correlation coefficient. ‡Only two cases had no mononuclear cell infiltration (0 score) in histology. Bold style indicates statistical significance. *P < 0.05, **P < 0.01, ***P < 0.001, ****P < 0.00001. IM, intestinal metaplasia.
In the next, we investigated methylation levels in the six genes under study with regard to the three categorized H. pylori infection statuses (H. pylori negative, current and past infection, Fig. 2). Methylation levels in all genes but APC showed a decrease after active H. pylori infection discontinued; in particular, methylation levels in THBD were significantly decreased (P < 0.001). However, compared to H. pylori negatives, aberrant DNA hypermethylation in LOX (Fig. 2b), HAND1 (Fig. 2c), THBD (Fig. 2d), and p41ARC (Fig. 2e) remained significantly increased in past H. pylori‐infected cases (all P < 0.05).
Figure 2.
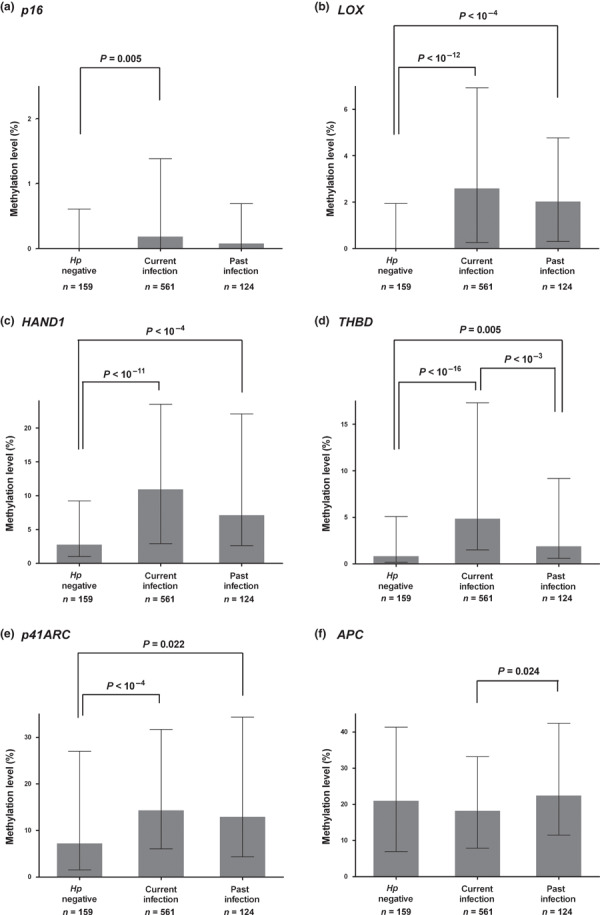
Methylation levels in the six genes: p16 (a), LOX (b), HAND1 (c), THBD (d), p41ARC (e), and APC (f) with regard to the Helicobacter pylori infection status. “Current infection” refers to positivity for any one of the endoscopy‐based active H. pylori tests, and “past infection” positive for H. pylori serology only. Results are given as median and interquartile range. Aberrant DNA hypermethylation decreased as H. pylori‐associated active infection resolved. However, methylation levels in LOX, HAND1, THBD, and p41ARC remained significantly increased in the subjects with past infection compared to those with H. pylori negativity (all P < 0.05).
Association of high methylation levels with the precancerous gastric lesions or cancer. The methylation levels in the six genes were compared between controls and patients with dysplasia or GC with reference to the status of H. pylori infection, adjusted for age, gender, and smoking and drinking habits (Table 4). When controls and patients with dysplasia were compared, the methylation profiles did not significantly differ in all six genes. However, methylation levels in specific genes were significantly elevated in GC patients. Among H. pylori‐negative subjects (n = 263), the samples with higher levels of methylation (% of methylation, ≥1% for p16 and ≥5% for LOX, HAND1, and THBD) had an increased risk for GC compared to those with lower levels of methylation (% of methylation, <1% for p16, <5% for LOX, HAND1, and THBD): 4.66‐fold (p16), 3.32‐fold (LOX), 2.66‐fold (HAND1), and 24.59‐fold (THBD). However, among H. pylori‐positive subjects (n = 525), the methylation levels in p16, LOX, and HAND1 were not different between controls and GC cases.
Table 4.
Methylation level of p16, LOX, HAND1, THBD, p41ARC, and APC genes in normal controls, and patients with dysplasia and gastric cancer patients with respect to Helicobacter pylori infection status
| Gene (methylation level, %) | No. of subjects (%) | OR† (95% CI) | P‐values† | OR‡ (95% CI) | P‐values‡ | ||
|---|---|---|---|---|---|---|---|
| Controls | DYS | GC | |||||
| Helicobacter pylori negative or past infection (n = 263) | (n = 97) | (n = 42) | (n = 124) | ||||
| P16 (≥1%) | 11 (11.3) | 4 (9.5) | 37 (29.8) | 2.03 (0.42–9.88) | 0.379 | 4.66 (1.83–11.85) | 0.001 |
| LOX (≥5%) | 13 (13.4) | 8 (19.0) | 31 (25.0) | 1.24 (0.35–4.42) | 0.738 | 3.32 (1.31–8.39) | 0.011 |
| HAND1 (≥5%) | 30 (30.9) | 16 (38.1) | 71 (57.3) | 0.88 (0.33–2.35) | 0.793 | 2.66 (1.30–5.44) | 0.007 |
| THBD (≥5%) | 3 (3.1) | 8 (19.0) | 69 (55.6) | 2.55 (0.50–12.95) | 0.260 | 24.59 (6.78–89.26) | <0.001 |
| p41ARC (≥10%) | 44 (45.4) | 20 (47.6) | 68 (54.8) | 1.63 (0.63–4.20) | 0.313 | 1.93 (0.97–3.82) | 0.061 |
| APC (≥10%) | 66 (68.0) | 24 (57.1) | 96 (77.4) | 0.48 (0.18–1.25) | 0.131 | 1.42 (0.67–3.01) | 0.368 |
| Current active H. pylori infection (n = 525) | (n = 132) | (n = 87) | (n = 306) | ||||
| P16 (≥1%) | 31 (23.5) | 16 (18.4) | 100 (32.7) | 0.84 (0.39–1.78) | 0.641 | 1.56 (0.95–2.55) | 0.080 |
| LOX (≥5%) | 58 (43.9) | 27 (31.0) | 103 (33.7) | 0.64 (0.33–1.25) | 0.195 | 0.72 (0.46–1.13) | 0.152 |
| HAND1 (≥5%) | 96 (72.7) | 50 (57.5) | 199 (65.0) | 0.60 (0.31–1.19) | 0.145 | 0.75 (0.47–1.20) | 0.231 |
| THBD (≥5%) | 41 (31.1) | 19 (21.8) | 202 (66.0) | 0.82 (0.39–1.72) | 0.604 | 5.37 (3.31–8.70) | <0.001 |
| p41ARC (≥10%) | 76 (57.6) | 45 (51.7) | 213 (69.6) | 0.83 (0.44–1.57) | 0.562 | 1.90 (1.20–3.00) | 0.006 |
| APC (≥10%) | 75 (56.8) | 57 (65.5) | 225 (73.5) | 1.24 (0.64–2.41) | 0.526 | 2.02 (1.27–3.19) | 0.003 |
Analyses were performed in 788 subjects because of the missing data for some variables. All ORs and P‐values were calculated using logistic regression model adjusted for age, gender and smoking and drinking habits. †ORs and P‐values of normal controls versus patients with dysplasia. ‡ORs and P‐values of normal controls versus gastric cancer patients. Bold style indicates statistical significance. DYS, patients with dysplasia; GC, patients with gastric cancer; OR, odds ratio.
The similar tendency was observed when the analysis was carried out between the cases and their age and gender‐matched controls (Fig. 3). The methylation levels in p16 (Fig. 3a) and THBD (Fig. 3d) were significantly elevated in GC patients, regardless of H. pylori infection (all P < 0.05). Among active H. pylori‐infected cases, the methylation levels in APC (Fig. 3f) were significantly elevated with GC (P = 0.001). For LOX (Fig. 3b), its methylation profile was quite different depending on the status of H. pylori infection. That is, among H. pylori‐negative subjects, the methylation levels in LOX were significantly increased with GC (Fig. 3b, P = 0.021); however, they were decreased with GC among H. pylori‐positive cases (P = 0.002). In addition, methylation levels in HAND1 (Fig. 3c) and p41ARC (Fig. 3e) did not differ significantly between controls and GC patients. Furthermore, when methylation levels of the six genes under study were compared according to the histologic type of GC (intestinal vs diffuse type), the difference was not statistically different (data not shown).
Figure 3.
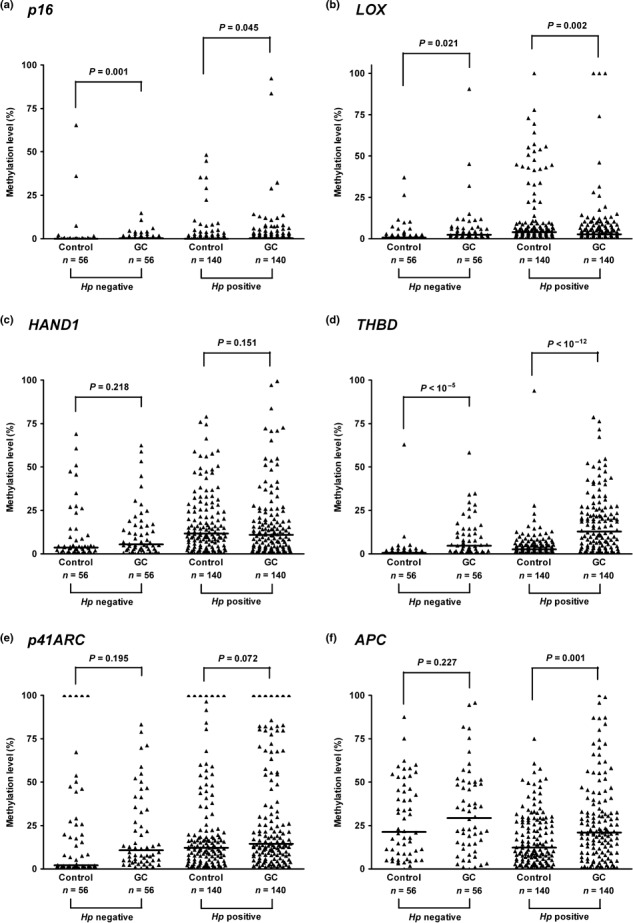
Methylation levels of the six genes: p16 (a), LOX (b), HAND1 (c), THBD (d), p41ARC (e), and APC (f) in the gastric cancer (GC) cases and their age‐ and gender‐matched controls according to the presence of current active Helicobacter pylori infection (H. pylori negative, n = 56; H. pylori positive, n = 140). Bar represents median. Methylation levels in p16 and THBD significantly increased in patients of GC (all P‐values <0.05), whereas the methylation levels in HAND1 and p41ARC did not. Hp, Helicobacter pylori; GC, patients with gastric cancer.
Discussion
In the present study, the methylation levels in the six genes (p16, LOX, HAND1, THBD, p41ARC, and APC) were evaluated from non‐neoplastic gastric mucosae using quantitative real‐time PCR after bisulfite modification. Previously, a Japanese group reported that hypermethylation of eight selected genes (p16 core, p16 noncore, HRASLS, LOX, HAND1, THBD, p41ARC, and FLNc) was associated with both H. pylori infection and GC.( 18 ) In addition, we investigated the methylation profiles of the six genes at variable stages of gastric carcinogenesis including IM and dysplasia in relation to H. pylori infection. Furthermore, a systematic analysis was performed taking into consideration three statuses of H. pylori infection (negative, current active, and past) using both invasive tests (culture, histology, and CLOtest) and serology testing; a past H. pylori infection could be distinguished, at least in part, from a current active one. The association of APC methylation with H. pylori infection and precancerous gastric lesions was also evaluated, and it showed a distinct pattern from the other five genes under study.
In controls, the univariate analysis showed that methylation levels in THBD and APC, but not the other four genes evaluated in this study, were significantly correlated with aging (Spearman’s rank correlation test; P = 0.039 and 0.001 for THBD and APC respectively); this finding favors the notion that susceptibility to age‐related CGI methylation differs among genes and tissues.( 19 ) On the other hand, gender, alcohol drinking, and smoking history did not affect the methylation level in any of the six genes significantly (data not shown), which implies that these factors play a minor, if any, role in inducing epigenetic changes in noncancerous gastric mucosae.( 6 ) Methylation levels in LOX, HAND1, and THBD were significantly higher in the cases with active H. pylori infection than those with H. pylori‐negative or past infection (Fig. 2). Of note was that APC gene promoter CGI methylation increased with IM, but decreased with H. pylori infection (Fig. 1f). A few studies have reported that promoter methylation of APC is often found in biopsies with histologically normal mucosa, and that such alterations were found in normal mucosa adjacent to IM.( 14 , 20 ) In addition, a recent study has shown that APC 1A methylation was observed in similar levels (20–40%) in both normal gastric mucosae of healthy volunteers and noncancerous gastric mucosae of GC patients and that H. pylori infection did not affect its methylation.( 21 ) Negative correlation between APC methylation and H. pylori infection appears to be plausible because the histologic grade of IM was negatively correlated with H. pylori density in our study population (Spearman’s rank correlation test; ρ = −0.182, P < 0.001). Overall, hypermethylation of APC appears to be associated with IM, but H. pylori infection does not induce its methylation.
Two types of aberrant DNA methylation have been postulated; one a temporary methylation induced in progenitor or differentiated cells and the other a permanent methylation induced in stem cells.( 22 ) The former fluctuates during the course of H. pylori infection and decreases after active inflammation resolves and new epithelial cells are supplied from unmethylated stem cells. On the other hand, the latter gradually increases during active infection and persists even after H. pylori is no longer present.( 2 ) Helicobacter pylori is thought to induce aberrant DNA methylation in both temporary and permanent components.( 23 ) Our results demonstrated that methylation levels in all genes but APC were positively correlated with both density of H. pylori and histologic grade of gastritis (Table 3), which is consistent with previous studies.( 11 , 24 ) In addition, methylation level was decreased in those who had undergone H. pylori infection before (past infection or serology‐positive only) compared to those with current active infection; this probably originates from a decrease in temporary methylation (Fig. 2). However, we found the methylation levels in such genes as LOX, HAND1, THBD, and p41ARC were significantly increased in the subjects with past H. pylori infection compared to those without evidence of H. pylori infection (Fig. 2); this supports the notion that methylation profiles induced by H. pylori infection can be persistent even after discontinuation of active infection.( 2 , 23 , 24 )
Hypermethylation of HAND1, APC, and THBD were positively correlated with the grade of IM (Table 3). Among the cases without evidence of active H. pylori infection, the methylation profiles of the six genes under study showed an increasing tendency with the progression of gastric carcinogenesis (Supporting information Fig. S2). However, among cases with active H. pylori infection, their methylation profiles were different depending on the susceptibility to H. pylori‐induced CGI hypermethylation (Table 4 and Supporting information Fig. S3). CGI hypermethylation of THBD, and possibly p16, was significantly associated with GC, regardless of active H. pylori infection (Table 4 and Figs 3, S2, S3). However, the association of the methylation levels in LOX and HAND1 with GC appears to be more dependent on active H. pylori infection. Methylation profiles obtained from noncancerous gastric mucosae could be affected by the activity of H. pylori‐associated gastritis. Thus, methylation levels during current active H. pylori infection do not necessarily reflect the future risk for GC.( 23 ) We postulated that CGI hypermethylation in such genes as LOX and HAND1 is closely related to the activity of H. pylori‐induced gastritis; thus, their methylation profiles are more affected by H. pylori infection itself than by the stage in multistep gastric carcinogenesis. We could not identify any significant difference in the methylation levels in the six genes in the comparisons between controls and patients with dysplasia (Table 4), which is in part due to relatively small sample size in dysplasia cases. Overall, all of these findings are consistent with the concept that aberrant DNA hypermethylation induced by H. pylori occurs in a gene‐specific manner, with different methylation susceptibility, during the multistep carcinogenesis.
It has been suggested that gene promoter hypermethylation could be used as a marker to predict the future risk for GC.( 22 , 23 , 25 ) In this study, aberrant DNA hypermethylation in THBD was not only closely linked to H. pylori infection, but also accumulated with the progression of gastric carcinogenesis. Thrombomodulin, which is important for anticoagulant activity, is also known to be involved in various physiologic and pathologic processes including thrombosis, arteriosclerosis, inflammation, and carcinogenesis.( 26 ) Hypermethylation and silencing of THBD have been frequently observed in ovarian cancer,( 27 ) pancreatic cancer,( 28 ) and melanoma,( 29 ) as well as in GC.( 12 , 18 ) The duration of H. pylori exposure and the epigenetic alterations induced by H. pylori, not the H. pylori infection status itself, are known to be closely associated with the future risk for GC;( 18 , 30 ) the methylation level of specific genes such as THBD might be a useful marker associated with the methylation fingerprint of H. pylori infection and the risk for GC.( 31 )
The limitations of this study include the following. In this study, the profiles of aberrant CGI hypermethylation were obtained from antral biopsy specimens, although different sites of gastric mucosae (antrum or corpus) may have different methylation profiles.( 6 , 23 ) However, one study has reported no significant difference in methylation levels between the corpus and antrum;( 18 ) therefore, biopsy site(s) may not have affected our results substantially. Second, some of those who were classified as H. pylori negative possibly had a remote H. pylori infection; one study has shown the seroconversion rate was 45% at 18 months after H. pylori eradication in Koreans.( 32 ) This may attenuate the differences in methylation levels between the two groups categorized as H. pylori negative and past H. pylori infection, and may result in the reduction of the statistical power.
In conclusion, aberrant DNA methylation was found to occur in a gene‐specific manner during the multistep gastric carcinogenesis, and H. pylori infection status was closely associated with promoter methylation of specific genes. Furthermore, the aberrant hypermethylation induced by H. pylori was persistent even after H. pylori infection disappeared. Hypermethylation of specific genes such as THBD has been found to be associated with both H. pylori infection and the development of GC, and thus might provide a link between H. pylori infection and development of GC.
Disclosure Statement
The authors have no conflict of interest.
Supporting information
Fig. S1. Reproducibility of methylation levels for HAND1 (a) and p16 (b) CGIs. Two independent bisulfite modifications, with the methylation ratios of 60%, 6%, 4.5%, 3%, 1.5%, and 0.8%, were performed on two different dates (Groups 1 and 2; Groups 3 and 4). Each group was analyzed by quantitative real‐time PCRs in triplicate (a, b, c). The resultant methylation levels were highly reliable.
Fig. S2. Methylation profiles of the six genes from non‐neoplastic gastric mucoase at various stages of gastric carcinogenesis among the cases with Helicobacter pylori negativity or past infection (n = 283). The methylation levels of the six genes showed an increasing tendency along gastric carcinogenesis. Specifically, hypermethylation of HAND1 (c) and THBD (d) was associated with IM (P < 0.05) and dysplasia (P < 0.01), respectively. Results are given as median and interquartile range. All P‐values were calculated using rank anova analysis, and the Bonferroni method for multiple comparisons was applied. CG, subjects with normal gastric mucosa or chronic gastritis only; DYS, patients with dysplasia; GC, patients with gastric cancer; IM, subjects with intestinal metaplasia. *P < 0.05, **P < 0.01, ***P < 0.001.
Fig. S3. Methylation profiles of the six genes from non‐neoplastic gastric mucoase at various stages of gastric carcinogenesis in active Helicobacter pylori‐infected cases (n = 559). The methylation profiles showed a difference with genes. For p16 (a), THBD (d), and APC (f), their methylation profiles showed an increase with the progression of gastric carcinogenesis. For LOX (b), however, its methylation levels showed a decrease with the progression of the gastric carcinogenesis. Results are given as median and interquartile range. All P‐values were calculated using rank anova analysis, and the Bonferroni method for multiple comparisons was applied. CG, subjects with normal gastric mucosa or chronic gastritis only; DYS, patients with dysplasia; GC, patients with gastric cancer; IM, subjects with intestinal metaplasia. *P < 0.05, **P < 0.01, ***P < 0.001.
Please note: Wiley‐Blackwell are not responsible for the content or functionality of any supporting materials supplied by the authors. Any queries (other than missing material) should be directed to the corresponding author for the article.
Supporting info item
Supporting info item
Supporting info item
Acknowledgments
This work was supported by a Korea Research Foundation Grant funded by the Korean Government (KRF‐2008‐313‐E00433). In addition, part of this study was supported by the Korean Liver Research Foundation in 2008.
References
- 1. Jones PA, Baylin SB. The epigenomics of cancer. Cell 2007; 128: 683–92. [DOI] [PMC free article] [PubMed] [Google Scholar]
- 2. Ushijima T. Epigenetic field for cancerization. J Biochem Mol Biol 2007; 40: 142–50. [DOI] [PubMed] [Google Scholar]
- 3. Kang GH, Shim YH, Jung HY et al. CpG island methylation in premalignant stages of gastric carcinoma. Cancer Res 2001; 61: 2847–51. [PubMed] [Google Scholar]
- 4. Correa P, Shiao YH. Phenotypic and genotypic events in gastric carcinogenesis. Cancer Res 2006; 12: 198–95. [PubMed] [Google Scholar]
- 5. Correa P. Helicobacter pylori and gastric carcinogenesis. Am J Surg Pathol 1995; 19 (Suppl 1): S37–43. [PubMed] [Google Scholar]
- 6. Perri F, Cotugno R, Piepoli A et al. Aberrant DNA methylation in non‐neoplastic gastric mucosa of H. pylori infected patients and effect of eradication. Am J Gastroentrol 2007; 102: 1361–71. [DOI] [PubMed] [Google Scholar]
- 7. Kaise M, Yamasaki T, Yonezawa K et al. CpG island hypermethylation of tumor‐suppressor genes in H. pylori‐infected non‐neoplastic gastric mucosa is linked with gastric cancer risk. Helicobacter 2008; 13: 35–41. [DOI] [PubMed] [Google Scholar]
- 8. Chan AO, Peng JZ, Lam SK et al. Eradication of Helicobacter pylori infection reverses E‐cadherin promoter hypermethylation. Gut 2006; 55: 463–8. [DOI] [PMC free article] [PubMed] [Google Scholar]
- 9. Qian X, Huang C, Cho CH et al. E‐cadherin promoter hypermethylation induced by interleukin‐1beta treatment of H. pylori infection in human gastric cancer cell lines. Cancer Lett 2008; 263: 107–13. [DOI] [PubMed] [Google Scholar]
- 10. Ushijima T. Detection and interpretation of altered methylation patterns in cancer cells. Nat Rev Cancer 2005; 5: 223–31. [DOI] [PubMed] [Google Scholar]
- 11. Dong CX, Deng DJ, Pan KF et al. Promoter methylation of p16 associated with Helicobacter pylori in precancerous gastric lesions: a population‐based study. Int J Cancer 2009; 124: 434–9. [DOI] [PubMed] [Google Scholar]
- 12. Takeda A, Kaminishi M, Yanagihara K et al. Identification of silencing of nine genes in human gastric cancers. Cancer Res 2002; 62: 6645–50. [PubMed] [Google Scholar]
- 13. Kaneda A, Kaminishi M, Nakanishi Y et al. Reduced expression of the insulin‐induced protein 1 and p41 Arp2/3 complex genes in human gastric cancers. Int J Cancer 2002; 100: 57–62. [DOI] [PubMed] [Google Scholar]
- 14. Tsuchiya T, Tamura G, Sato K et al. Distinct methylation patterns of two APC gene promoters in normal and cancerous gastric epithelia. Oncogene 2000; 19: 3642–6. [DOI] [PubMed] [Google Scholar]
- 15. Dixon MF, Genta RM, Yardley JH et al. Classification and grading of gastritis. The updated Sydney System. International Workshop on the Histopathology of Gastritis, Houston 1994. Am J Surg Pathol 1996; 20: 1161–81. [DOI] [PubMed] [Google Scholar]
- 16. Herman JG, Graff KR, Myöhänen S et al. Methylation‐specific PCR: a novel PCR assay for methylation status of CpG islands. Proc Natl Acad Sci USA 1996; 93: 9821–6. [DOI] [PMC free article] [PubMed] [Google Scholar]
- 17. Zysman M, Saka A, Millar A et al. Methylation of Adenomatous polyposis coli in endometrial cancer occurs more frequently in tumors with microsatellite instability phenotype. Cancer Res 2002; 62: 3663–6. [PubMed] [Google Scholar]
- 18. Maekita T, Nakazawa K, Mihara M et al. High levels of aberrant DNA methylation in Helicobacter pylori‐infected gastric mucosae and its possible association with gastric cancer risk. Clin Cancer Res 2006; 12: 989–95. [DOI] [PubMed] [Google Scholar]
- 19. Kang GH, Lee HJ, Hwang KS et al. Aberrant CpG island hypermethylation of chronic gastritis, in relation to aging, gender, intestinal metaplasia, and chronic inflammation. Am J Pathol 2003; 163: 1551–6. [DOI] [PMC free article] [PubMed] [Google Scholar]
- 20. Clement G, Bosman FT, Fontolliet C et al. Monoallelic methylation of the APC promoter is altered in normal gastric mucosa associated with neoplastic lesions. Cancer Res 2004; 64: 6867–73. [DOI] [PubMed] [Google Scholar]
- 21. Hosoya K, Yamashita S, Ando T et al. Adenomatlous polyposis coli 1A is likely to be methylated as a passenger in human gastric carcinogenesis. Cancer Lett 2009; 285: 182–9. [DOI] [PubMed] [Google Scholar]
- 22. Ushijima T, Nakajima T, Maekita T. DNA methylation as a marker for the past and future. J Gastroenterol 2006; 41: 401–7. [DOI] [PubMed] [Google Scholar]
- 23. Nakajima T, Maekita T, Oda I et al. Higher methylation levels in gastric mucosae significantly correlate with higher risk of gastric cancers. Cancer Epidemiol Biomarkers Prev 2006; 15: 2317–21. [DOI] [PubMed] [Google Scholar]
- 24. Nakajima T, Enomoto S, Yamashita S et al. Persistence of a component of DNA methylation in gastric mucosae after Helicobacter pylori eradication. J Gastroenterol 2010; 45: 37–44. [DOI] [PubMed] [Google Scholar]
- 25. Tahara T, Arisawa T, Shibata T et al. Risk prediction of gastric cancer by analysis of aberrant DNA methylation in non‐neoplastic gastric epithelium. Digestion 2007; 15: 54–61. [DOI] [PubMed] [Google Scholar]
- 26. Weiler H, Isermann BH. Thrombomodulin. J Thromb Haemost 2003; 1: 1515–24. [DOI] [PubMed] [Google Scholar]
- 27. Imura M, Yamashita S, Cai L et al. Methylation and expression analysis of 15 genes and three normally methylated genes in 13 ovarian cancer cell lines. Cancer Lett 2006; 241: 213–20. [DOI] [PubMed] [Google Scholar]
- 28. Hagihara A, Miyamoto K, Furuta J et al. Identification of 27 5’ CpG islands aberrantly methylated and 13 genes silenced in human pancreatic cancers. Oncogene 2004; 23: 8705–10. [DOI] [PubMed] [Google Scholar]
- 29. Furuta J, Kaneda A, Umebayashi Y et al. Silencing of the thrombomodulin gene in human malignant melanoma. Melanoma Res 2005; 15: 15–20. [DOI] [PubMed] [Google Scholar]
- 30. Watabe H, Mitsushima T, Yamaji Y et al. Predicting the development of gastric cancer from combining Helicobacter pylori antibodies and serum pepsinogen status: a prospective endoscopic cohort study. Gut 2005; 54: 764–8. [DOI] [PMC free article] [PubMed] [Google Scholar]
- 31. Nakajima T, Yamashita S, Maekita T et al. The presence of a methylation fingerprint of Helicobacter pylori infection in human gastric mucosae. Int J Cancer 2009; 124: 905–10. [DOI] [PubMed] [Google Scholar]
- 32. Lee JH, Kim N, Chung JI et al. Long‐term follow up of Helicobacter pylori IgG serology after eradication and reinfection rate of H. pylori in South Korea. Helicobacter 2008; 13: 288–94. [DOI] [PubMed] [Google Scholar]
Associated Data
This section collects any data citations, data availability statements, or supplementary materials included in this article.
Supplementary Materials
Fig. S1. Reproducibility of methylation levels for HAND1 (a) and p16 (b) CGIs. Two independent bisulfite modifications, with the methylation ratios of 60%, 6%, 4.5%, 3%, 1.5%, and 0.8%, were performed on two different dates (Groups 1 and 2; Groups 3 and 4). Each group was analyzed by quantitative real‐time PCRs in triplicate (a, b, c). The resultant methylation levels were highly reliable.
Fig. S2. Methylation profiles of the six genes from non‐neoplastic gastric mucoase at various stages of gastric carcinogenesis among the cases with Helicobacter pylori negativity or past infection (n = 283). The methylation levels of the six genes showed an increasing tendency along gastric carcinogenesis. Specifically, hypermethylation of HAND1 (c) and THBD (d) was associated with IM (P < 0.05) and dysplasia (P < 0.01), respectively. Results are given as median and interquartile range. All P‐values were calculated using rank anova analysis, and the Bonferroni method for multiple comparisons was applied. CG, subjects with normal gastric mucosa or chronic gastritis only; DYS, patients with dysplasia; GC, patients with gastric cancer; IM, subjects with intestinal metaplasia. *P < 0.05, **P < 0.01, ***P < 0.001.
Fig. S3. Methylation profiles of the six genes from non‐neoplastic gastric mucoase at various stages of gastric carcinogenesis in active Helicobacter pylori‐infected cases (n = 559). The methylation profiles showed a difference with genes. For p16 (a), THBD (d), and APC (f), their methylation profiles showed an increase with the progression of gastric carcinogenesis. For LOX (b), however, its methylation levels showed a decrease with the progression of the gastric carcinogenesis. Results are given as median and interquartile range. All P‐values were calculated using rank anova analysis, and the Bonferroni method for multiple comparisons was applied. CG, subjects with normal gastric mucosa or chronic gastritis only; DYS, patients with dysplasia; GC, patients with gastric cancer; IM, subjects with intestinal metaplasia. *P < 0.05, **P < 0.01, ***P < 0.001.
Please note: Wiley‐Blackwell are not responsible for the content or functionality of any supporting materials supplied by the authors. Any queries (other than missing material) should be directed to the corresponding author for the article.
Supporting info item
Supporting info item
Supporting info item