

Abstract
Madder color (MC), a food coloring extracted from roots of Rubia tinctorum L., has been proven to exert carcinogenicity in the rat kidney and liver. Furthermore, it induces DNA adducts in the kidney, liver, and colon. MC is in fact composed of anthraquinones such as lucidin‐3‐O‐primeveroside and alizarin. To clarify which of these might be responsible for the carcinogenicity, a rat medium‐term multi‐organ carcinogenesis bioassay was performed focusing on the kidney, liver, and colon. Male 6‐week‐old F344 rats after receiving five different carcinogens were fed a diet containing either 0.008% or 0.04% of alizarin or rubiadin, a metabolite of lucidin‐3‐O‐primeveroside, for 23 weeks. Treatment with 0.04% rubiadin significantly increased atypical renal tubules/hyperplasias and induced renal cell adenomas and carcinomas. Renal cell tumors were also increased with 0.04% alizarin, although at lower incidence than with rubiadin. In addition, glutathione S‐transferase placental form‐positive liver cell foci and large intestinal dysplasias were significantly increased with 0.04% rubiadin. These results indicate that both rubiadin and alizarin can increase renal preneoplastic lesions, the potential of the latter being weaker. Rubiadin may also target the liver and large intestine, suggesting a major role in madder color‐induced carcinogenicity. (Cancer Sci 2009; 100: 2261–2267)
We have reported that madder color (MC), extracted from the madder root plant named Rubia tinctorum L., is toxic to liver, kidney, and blood cells while increasing development of glutathione S‐transferase placental form (GST‐P)‐positive hepatocellular altered foci, atypical renal tubules, or renal cell adenomas in subchronic or chronic toxicity studies.( 1 , 2 ) A 2‐year carcinogenicity study using F344 rats has also provided evidence that MC is fully carcinogenic to the kidney and liver.( 3 ) Previously, a number of genotoxicity studies( 4 , 5 , 6 , 7 , 8 , 9 , 10 , 11 , 12 , 13 ) demonstrated positive results for MC, suggesting that the carcinogenicity is based on genotoxicity. Indeed, madder root causes DNA adducts in the kidney, liver, and colon of rats.( 12 )
Major constituents of the MC used in Japan are anthraquinones, such as alizarin (Alz), lucidin‐3‐O‐primeveroside (LuP), and ruberythric acid. These have been reported to have different genotoxicity profiles. For example, LuP was positive, but Alz and ruberythric acid were negative, for mutations in Salmonella typhimurium,( 8 ) the Drosophia wing spot test,( 14 ) and an in vivo DNA adduct formation test.( 13 ) Oral administration of LuP to rats results in the excretion of lucidin (Luc) and rubiadin (Rub),( 7 ) both of which have proved strongly positive in in vitro mutation tests such as the Ames and unscheduled DNA synthesis assays.( 6 , 7 , 8 , 9 ) Additionally, Luc forms DNA adducts in vitro and in vivo.( 13 )
Recently, we investigated potent renal carcinogenicity in rats treated with Alz, LuP, Luc, or Rub for up to 26 weeks.( 15 ) Since Rub induced karyomegaly, a frequently observed lesion with renal carcinogens, and atypical renal tubules, a possible preneoplastic lesion in the outer medulla, in addition to increase of proliferating cell nuclear antigen (PCNA)‐positive indices, Rub is suggested to be a suspect anthraquinone for renal carcinogenesis. However, both Alz and LuP induce cortical degeneration and oxidative DNA damage in the kidney, and their relative contributions to renal carcinogenesis have remained unclear. The carcinogenic potential of these chemicals in the liver and colon are also unknown.
In the present study, since anthraquinones such as Alz and Rub are also contained in foodstuffs, dyeing baths for textiles, and wool treated with madder root,( 16 ) they were therefore selected as test substances for assessment of carcinogenicity. In addition to the fact that ruberythric acid, a minor component of MC, proved to be difficult to extract or synthesize, lucidin failed to induce renal histopathological changes in our previous short‐term study.( 15 ) Therefore, these two components were not included in the present study; however, it would be worthy to assess their carcinogenicity when available. For this purpose, we chose a rat medium‐term multi‐organ carcinogenesis model allowing detection of target organs based on tumor‐promotion effects in a short period,( 17 ) and mainly examined focusing on the kidney, liver, and large intestine as possible main targets of Alz and Rub.
Materials and Methods
Chemicals. N‐Diethylnitrosamine (DEN), N‐butyl‐N‐(4‐hydroxybutyl)nitrosamine (BBN), and 1,2‐dimethylhydrazine (DMH) were obtained from Tokyo Kasei Kogyo (Tokyo, Japan), and 2,2′‐dihydroxy‐di‐n‐propylnitrosamine (DHPN) from Nacalai Tesque (Kyoto, Japan). N‐Methyl‐N‐nitrosourea (MNU) and Alz were purchased from Sigma‐Aldrich Japan (Tokyo, Japan). Rub was synthesized at ALPS Pharmaceutical (Gifu, Japan). The purities of Alz and Rub were 97% and 99.9%, respectively. These compounds were well mixed with the powdered basal diet CRF‐1 (Oriental Yeast, Tokyo, Japan) at concentrations of 0.008% and 0.04% for both. The doses were chosen based on the results of toxicity and carcinogenicity studies reported previously.( 1 , 2 ) Since 0.06% Rub significantly decreased final body weight in an earlier short‐term study,( 15 ) the highest dose of Rub was here set at 0.04%. The lower dose for Alz and Rub was chosen to be one‐fifth of this.
Animals. Male F344/DuCrj rats at 5 weeks of age, purchased from Charles River Japan (Kanagawa, Japan), were used in the present study. They received basal dietary pellet CRF‐1 and tap water ad libitum during the 1‐week acclimation period, and were housed three or four per polycarbonate cage with sterilized softwood chips as bedding in a barrier‐sustained animal room conditioned at 23–25°C and 50–60% humidity, and on a 12‐h light/dark cycle.
Experimental design. The experimental protocol is shown in Figure 1. The animals were randomly divided into five groups consisting of 20–25 animals each. All of the animals received five carcinogens during the first 4 weeks (DMBDD treatment) as follows: (1) a single i.p. injection of 100 mg/kg body weight of DEN on the first day of the experiment; (2) four i.p. injections of 20 mg/kg body weight of MNU with 0.05% BBN p.o. treatment in the drinking water in the first 2 weeks; (3) four s.c. injections of 40 mg/kg body weight of DMH with 0.1% DHPN p.o. treatment in the drinking water in the following 2 weeks. Group 1 received basal dietary powdered CRF‐1 throughout the experimental period. Until week 5, groups 2–5 were given the same basal diet. From week 5, groups 2 and 3 received 0.008% and 0.04% Alz containing diet and groups 4 and 5 were given 0.008% and 0.04% Rub, respectively, for 23 weeks. Diets and drinking water were available ad libitum. The animals were observed daily for clinical signs and mortality and at week 28, all survivors were anesthetized with ether, weighed, and euthanized by exsanguination from the abdominal aorta and subjected to complete autopsy. Kidneys and livers were weighed, and the entire colon and rectum of each animal were excised, opened longitudinally, and stretched flat with needles on styrofoam boards. All collected organs were fixed with 10% neutral buffered formalin solution.
Figure 1.
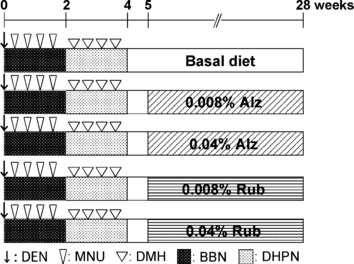
Experimental design of the present study. Alz, alizarin; BBN, N‐butyl‐N‐(4‐hydroxybutyl)nitrosamine; DEN, N‐diethylnitrosamine; DHPN, 2,2′‐dihydroxy‐di‐n‐propylnitrosamine; DMH, 1,2‐dimethylhydrazine; MNU, N‐methyl‐N‐nitrosourea; Rub, rubiadin.
The animal protocols were reviewed and approved by the Animal Care and Use Committee of the National Institute of Health Sciences, Japan.
Histopathological assessment. Histopathological assessment was performed for all surviving animals. Liver and bilateral kidneys were dissected and divided into three (two left and one median lobe) and eight (four vertical slices per each) parts, respectively. After the analysis of aberrant crypt foci (ACF), the large intestines were cut into three equal lengths, each longitudinally divided into two and then further cut longitudinally into three, including gross lesions, for processing. After being fixed in 10% buffered formalin for an additional 2 days and routinely embedded in paraffin, sections were stained with hematoxylin–eosin.
In the light‐microscopic analysis, all preneoplastic and neoplastic lesions in all sections of the kidney, liver, and large intestine were evaluated. For the kidneys, since proximal tubule cells in the outer medulla are the known target sites of MC carcinogenesis, preneoplastic and neoplastic lesions of renal tubule cells were evaluated separately in the cortex and outer medulla. Histopathological classification of renal lesions followed a previous report.( 18 )
Immunohistochemical evaluation of GST‐P‐positive hepatocellular foci. To evaluate potential carcinogenic activity in the liver, two slices from the left lobe and a single slice from the median lobe (total three slices) were subjected to immunohistochemical staining for GST‐P. In brief, deparaffinized sections were treated to block endogenous peroxidase activity. After masking with normal goat serum, sections were exposed to rabbit antirat GST‐P antibodies (1:1000; Medical & Biological Laboratories, Nagoya, Japan) in 0.5% casein/0.01 m phosphate‐buffered saline (pH 7.4) overnight at 4°C. Immunodetection was carried out with the horseradish peroxidase–avidin–biotin complex method using a Vectastain Elite ABC Kit (Vector Laboratories, Burlingame, CA, USA) following the manufacturer’s protocol with 3, 3′‐diaminobenzidine as the chromogen. Sections were then counterstained with hematoxylin and cover‐slipped for microscopic examination. The numbers and areas of GST‐P‐positive foci larger than 0.2 mm in diameter and total areas of the liver sections were measured with a video image processor, the so‐called Image Processor for Analytical Pathology (IPAP‐WIN; Sumika Technoservice, Osaka, Japan), as detailed previously.( 19 )
Analysis of aberrant crypt foci (ACF). The fixed entire colons and rectums were stained with 0.2% methylene blue in PBS for about 3 min. The numbers of ACF per large intestine, the numbers of aberrant crypts per focus, and the distributions of ACF were then counted in three parts of large intestine, proximal, middle, and distal ends under a stereoscope (SZX7; Olympus, Tokyo, Japan). Since decreasing tendencies for ACF in the treated groups were consistent on preliminary analysis using half of the numbers of animals in each group, final analysis was performed with 10 and 15 animals in both the Alz and Rub groups, respectively.
Localization of β‐catenin in preneoplastic/neoplastic intestinal lesions. To evaluate β‐catenin localization in preneoplastic and/or neoplastic lesions of the large intestine, antigen retrieval in non‐serial sections having preneoplastic and/or neoplastic lesions was performed in an autoclave for 15 min at 121°C in 10 mM citrate buffer (pH 6.0), and sections were exposed to a monoclonal antibody against β‐catenin (clone 14, 1:500, BD Transduction Laboratories, Lexington, KY, USA). A peroxidase‐labeled amino acid polymer method (Histofine simple stain rat MAX‐PO; Nichirei Bioscience, Tokyo, Japan) was applied to determine the expression and localization of β‐catenin. Visualization and counterstaining were conducted as for GST‐P described above. Localization (cell membrane, cytoplasm, or nuclei) of β‐catenin in preneoplastic and neoplastic cells in the large intestine was evaluated.
Statistics. Variances in data for body, kidney, and liver weights, food intake and water consumption, and numbers and areas of GST‐P‐positive hepatocellular foci were checked for homogeneity by Bartlett’s procedure. If the variance was homogeneous, the data were assessed by one‐way ANOVA. If not, the Kruskal–Wallis test was applied. When statistically significant differences were indicated, the Dunnett’s multiple test was employed for comparison between the control and treatment groups. With histopathological changes, incidences were compared using Fisher’s exact probability test and multiplicity was analyzed with the Mann–Whitney U‐test.
Results
Until week 28, some animals in each group died or became moribund due to the development of tumors. Thus, the animals that survived until week 28 were included as effective numbers. The final survival rates were 55%, 90%, 85%, 84%, and 80% in control; 0.008% Alz, 0.04% Alz, 0.008% Rub, and 0.04% Rub groups, respectively. During the experimental period, no significant differences in body weight, food consumption, and DHPN‐ or BBN‐containing water intake were found in any groups (data not shown).
Final body and organ weights (Table 1): There were no significant differences between the controls and each treated group in the body, kidney, and liver weights except for kidney weights in the 0.04% Alz group, in which one animal developed large renal nodules, 4 cm and 1 cm in diameter.
Table 1.
Final body, alsolute and relative kidneys and liver weight of rats treated with Alz or Rub in a medium‐term multi‐organ carcinogenesis bioassay
| Control | 0.008% Alz | 0.04% Alz | 0.008% Rub | 0.04% Rub | |
|---|---|---|---|---|---|
| n‡ | 11 | 18 | 17 | 21 | 20 |
| Final BW (g) | 287.2 ± 21.4† | 287.1 ± 18.4 | 278.0 ± 16.7 | 279.0 ± 20.6 | 283.2 ± 17.8 |
| Kidneys | |||||
| Absolute (g) | 1.91 ± 0.27 | 1.99 ± 0.30 | 3.75 ± 6.53* | 1.98 ± 0.30 | 2.04 ± 0.32 |
| Relative (g/100 g BW) | 0.67 ± 0.09 | 0.69 ± 0.09 | 1.37 ± 2.42** | 0.71 ± 0.08 | 0.72 ± 0.11 |
| Liver | |||||
| Absolute (g) | 7.54 ± 0.91 | 7.32 ± 0.92 | 7.01 ± 0.69 | 7.08 ± 0.69 | 7.97 ± 0.98 |
| Relative (g/100 g BW) | 2.62 ± 0.22 | 2.54 ± 0.25 | 2.52 ± 0.14 | 2.54 ± 0.16 | 2.81 ± 0.23 |
*, **P < 0.05 and P < 0.01 versus controls, respectively. †Mean ± SD. ‡Effective number of animals. Alz, alizarin; BW, body weight; Rub, rubiadin.
Preneoplastic/neoplastic lesions in the kidney (Table 2): In the outer medulla, incidence and multiplicity of both atypical tubules and atypical hyperplasias (Fig. 2a–d) increased significantly in the 0.04% Rub group, and incidence and multiplicity of atypical tubules showed a tendency for increase in the 0.008% Rub group. In the same tubular area, the incidence of atypical hyperplasias was also increased significantly in the 0.04% Alz group. Renal cell adenomas (Fig. 2e) and carcinomas (Fig. 2f) were not observed in the control group, but adenomas were observed with both doses of Rub and 0.04% Alz, and carcinomas were evident in the 0.04% Alz and Rub groups. In the cortex, atypical tubules, and atypical hyperplasias of the proximal tubule cells, renal cell adenomas or carcinomas were also detected in all treated groups, but they did not show dose‐related or significant increase. In addition to the lesions of proximal tubule cells, renal mesenchymal tumors (RMTs) and transitional cell hyperplasias and carcinomas were observed in the kidneys. The incidence of RMTs was significantly increased in the 0.008% Rub group, but there was no dose relation.
Table 2.
Incidences and multiplicity of preneoplastic and neoplastic lesions in the kidneys of rats treated with Alz or Rub in a medium‐term multi‐organ carcinogenesis bioassay
| Lesion | Incidence (%) | Multiplicity (/animal) | ||||||||
|---|---|---|---|---|---|---|---|---|---|---|
| Control | Alz (%) | Rub (%) | Control | Alz (%) | Rub (%) | |||||
| 0.008 | 0.04 | 0.008 | 0.04 | 0.008 | 0.04 | 0.008 | 0.04 | |||
| n‡ | 11 | 18 | 17 | 21 | 20 | 11 | 18 | 17 | 21 | 20 |
| Proximal tubule cells | ||||||||||
| Cortex | ||||||||||
| Atypical tubule | 100.0 | 100.0 | 94.1 | 100.0 | 95.0 | 4.5 ± 2.9† | 5.4 ± 2.4 | 2.9 ± 1.9 | 3.4 ± 2.4 | 4.7 ± 3.2 |
| Atypical hyperplasia | 36.4 | 33.3 | 64.7 | 23.8 | 45.0 | 0.5 ± 0.7 | 0.4 ± 0.6 | 1.2 ± 1.4 | 0.2 ± 0.4 | 0.8 ± 1.0 |
| Renal cell adenoma | 9.1 | 16.7 | 17.6 | 33.3 | 25.0 | 0.1 ± 0.3 | 0.2 ± 0.4 | 0.2 ± 0.6 | 0.4 ± 0.6 | 0.3 ± 0.4 |
| Renal cell carcinoma | 0 | 5.6 | 0 | 4.8 | 0 | 0.00 ± 0.00 | 0.06 ± 0.24 | 0.00 ± 0.00 | 0.05 ± 0.22 | 0.00 ± 0.00 |
| Outer medulla | ||||||||||
| Atypical tubule | 36.4 | 72.2 | 29.4 | 71.4 | 85.0* | 0.6 ± 0.9 | 1.2 ± 1.1 | 0.5 ± 0.9 | 1.2 ± 1.0 | 3.5 ± 2.7** |
| Atypical hyperplasia | 45.5 | 27.8 | 88.2* | 47.6 | 95.0** | 1.1 ± 1.5 | 0 ± 0 | 2.4 ± 1.5 | 0.6 ± 0.7 | 3.9 ± 2.5** |
| Renal cell adenoma | 0 | 0 | 5.9 | 23.8 | 15.0 | 0 ± 0 | 0 ± 0 | 0.1 ± 0.2 | 0.2 ± 0.4 | 0.2 ± 0.4 |
| Renal cell carcinoma | 0 | 0 | 5.9 | 0 | 10.0 | 0 ± 0 | 0 ± 0 | 0.1 ± 0.2 | 0 ± 0 | 0.1 ± 0.3 |
| Renal mesenchymal tumor | 63.6 | 83.3 | 94.1 | 95.2* | 90.0 | 1.6 ± 1.5 | 1.8 ± 1.3 | 2.4 ± 1.4 | 2.0 ± 1.0 | 2.1 ± 1.4 |
| Transitional cell hyperplasia | 18.2 | 0 | 5.9 | 9.5 | 15.0 | 0.2 ± 0.4 | 0 ± 0 | 0.1 ± 0.2 | 0.1 ± 0.3 | 0.2 ± 0.4 |
| Transitional cell carcinoma | 0 | 5.6 | 11.8 | 0 | 0 | 0 ± 0 | 0.1 ± 0.2 | 0.1 ± 0.3 | 0 ± 0 | 0 ± 0 |
*, **: P < 0.05 and P < 0.01 versus controls, respectively. †Mean ± SD. ‡Effective number of animals. Alz, alizarin; Rub, rubiadin.
Figure 2.
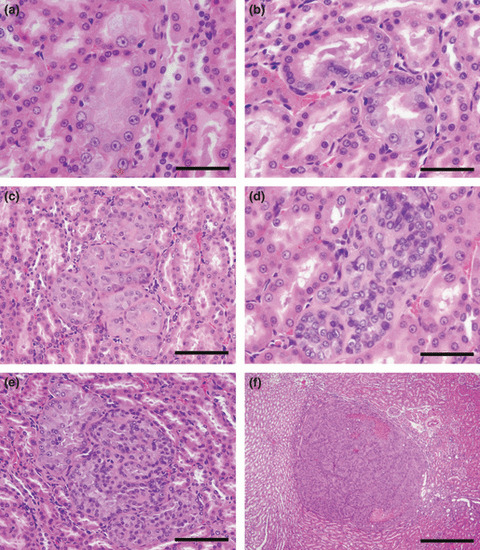
Representative preneoplastic/neoplastic lesions observed in the outer medulla of kidneys. (a,b) Atypical tubules are normal in size, but consist of epithelial cells showing atypia. Bar = 50 μm. (c,d) Atypical hyperplasias are composed of up to 10 tubules containing single‐ or multilayered atypical cells. Bars = 100 μm and 50 μm for (c) and (d), respectively. (e) A renal cell adenoma compressing surrounding tissue. Bar = 100 μm. (f) A renal cell carcinoma with focal necrosis. Bar = 500 μm.
Proliferative liver lesions and GST‐P‐positive hepatocelullar foci (Table 3; 3, 4): Various types of altered hepatocellular foci were observed in all animals of all groups, including the carcinogen controls. However, nodular hepatocellular hyperplasias (Fig. 3a) developed only in the 0.04% Rub group. Hepatocellular adenomas (Fig. 3b) were observed only in the Rub groups, albeit without significant increase in incidence. A few cases developed hemangiosarcoma and cholangiocellular hyperplasias in the liver, but there were no dose‐related or significant differences between the control and treated groups. Results of quantitative analysis of GST‐P‐positive hepatocellular foci are shown in Table 4. Numbers were significantly increased only in the 0.04% Rub group, but a tendency for increase was also observed with 0.04% Alz.
Table 3.
Incidences (%) of proliferative lesions in the livers of rats treated with Alz or Rub in a medium‐term multi‐organ carcinogenesis bioassay
| Lesion | Control | Alz | Rub | ||
|---|---|---|---|---|---|
| 0.008% | 0.04% | 0.008% | 0.04% | ||
| n† | 11 | 18 | 17 | 21 | 20 |
| Nodular hepatocellular hyperplasia | 0 | 0 | 0 | 0 | 10 |
| Altered hepatocellular focus | 100 | 100 | 100 | 100 | 100 |
| Hepatocellular adenoma | 0 | 0 | 0 | 4.8 | 5 |
| Hemangiosarcoma | 0 | 0 | 0 | 4.8 | 0 |
| Cholangiocellular hyperplasia | 9.1 | 11.1 | 0 | 0 | 0 |
†Effective number of animals. Alz, alizarin; Rub, rubiadin.
Figure 3.
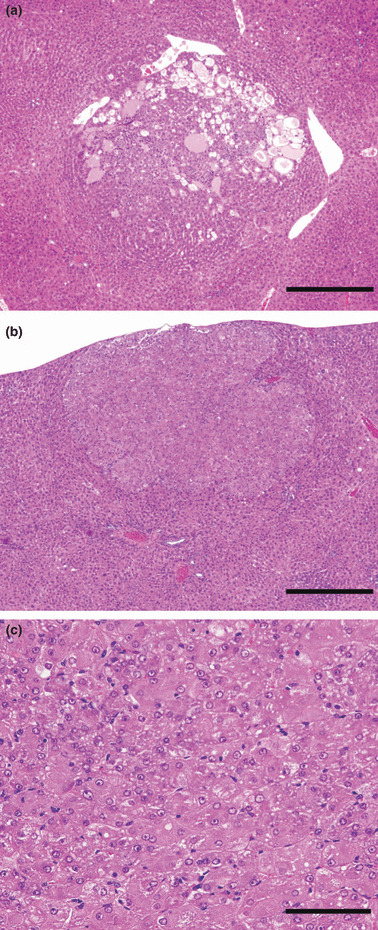
Representative lesions observed in the liver. (a) Nodular hepatocellular hyperplasia observed only in the 0.04% Rub group. Bar = 500 μm. (b) Hepatocellular adenoma in a 0.04% Rub group rat. (c) Note frequent cellular atypia. Bars = 500 μm and 100 μm for (b) and (c), respectively.
Figure 4.
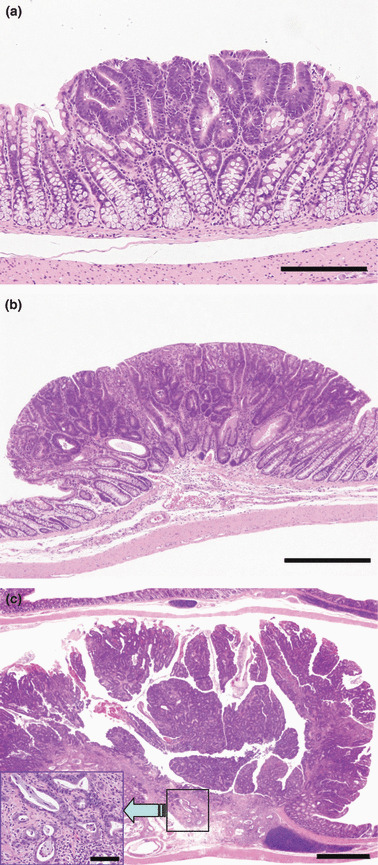
Representative preneoplastic/neoplastic lesions in the large intestine. (a) Dysplasia (Bar = 200 μm); (b) adenoma (Bar = 500 μm); and (c) adenocarcinoma (Bar = 1 mm). In the adenocarcinoma, invasion of neoplastic cells to lamina propria mucosae is evident (insert; Bar = 50 μm).
Table 4.
Numbers and areas of GST‐P‐positive hepatocellular foci in the liver of rats treated with Alz or Rub in a medium‐term multi‐organ carcinogenic assay
| Control | Alz (%) | Rub (%) | |||
|---|---|---|---|---|---|
| 0.008 | 0.04 | 0.008 | 0.04% | ||
| n‡ | 11 | 18 | 17 | 21 | 20 |
| Number/area (cm2) | 7.59 ± 1.7† | 7.997 ± 2.486 | 9.814 ± 3.939 | 7.05 ± 2.52 | 11.16 ± 2.82* |
| Area/area (mm2/cm2) | 0.043 ± 0.017 | 0.033 ± 0.008 | 0.040 ± 0.015 | 0.045 ± 0.013 | 0.038 ± 0.014 |
*P < 0.01 versus controls. †Mean ± SD. ‡Effective number of animals. Alz, alizarin; GST‐P, glutathione S‐transferase placental form; Rub, rubiadin.
ACF, β‐catenin, and preneoplastic/neoplastic lesions in the large intestine (5, 6): While numbers of crypts per focus did not show any significant differences between groups, multiplicity of foci and total number of crypts were rather decreased in all treated groups, with or without significant differences, as compared to controls. Localization of β‐catenin in preneoplastic and neoplastic cells was evaluated in the large intestine. In almost all dysplasias, β‐catenin was located in cell membranes, and it was also located in both cell membranes and nuclei of adenoma or adenocarcinoma cells. There were no chemical‐ and dose‐related changes in the localization including accumulation of β‐catenin in the nuclei, nor in neoplastic cells (data not shown). The histopathological appearance of proliferative lesions in the large intestine is illustrated in Figure 4. As preneoplastic/neoplastic epithelial lesions, dysplasias (Fig. 4a), ademomas (Fig. 4b), and adenocarcinomas (Fig. 4c) were observed in all groups, including the carcinogen controls. Incidence and multiplicity of dysplasias in the 0.04% Rub group were significantly increased, and those of adenomas and adenocarcinomas were also increased, albeit without statistical significance. In addition, leiomyosarcomas were observed in the 0.008% Rub group at low incidence, but without statistical significance.
Table 5.
Quantitative analysis of ACF and crypts in the large intestines of rats treated with Alz or Rub in a medium‐term multi‐organ carcinogenesis bioassay
| Group | No. of animals examined | Sum of multiplicity of foci | Total no. of crypts | Crypts/foci | ||
|---|---|---|---|---|---|---|
| <4 | ≥4 | Total | ||||
| Proximal | ||||||
| Control | 11 | 24.2 ± 10.1† | 3.5 ± 2.4 | 27.6 ± 10.8 | 60.4 ± 23.2 | 2.24 ± 0.43 |
| 0.008% Alz | 10 | 12.1 ± 7.9* | 3.4 ± 6.7 | 15.5 ± 13 | 41.7 ± 46.3 | 2.33 ± 0.59 |
| 0.04% Alz | 10 | 10.3 ± 4.7** | 0.9 ± 1.3 | 11.2 ± 5.7* | 21.1 ± 10.4** | 1.91 ± 0.22 |
| 0.008% Rub | 15 | 15.3 ± 10.4 | 2.1 ± 4.6 | 17.4 ± 14 | 39 ± 46.6* | 2.00 ± 0.62 |
| 0.04% Rub | 15 | 14.8 ± 12.5 | 1.5 ± 2.1 | 16.3 ± 13 | 35.9 ± 29.5 | 2.28 ± 1.12 |
| Middle | ||||||
| Control | 11 | 50.5 ± 19.3 | 39.0 ± 21.4 | 89.5 ± 37.1 | 329.9 ± 150.2 | 3.64 ± 0.51 |
| 0.008% Alz | 10 | 25.6 ± 13.3** | 22.3 ± 8.8* | 47.9 ± 21.6** | 191.6 ± 71.0* | 4.21 ± 0.67 |
| 0.04% Alz | 10 | 23.8 ± 9.8** | 28.3 ± 11.2 | 52.1 ± 19.7* | 212.9 ± 79.0* | 4.14 ± 0.47 |
| 0.008% Rub | 15 | 33.7 ± 17.0* | 22.6 ± 11.9* | 56.3 ± 26.9* | 197.5 ± 95.0** | 3.53 ± 0.48 |
| 0.04% Rub | 15 | 35.4 ± 18.2 | 24.1 ± 13.3* | 59.5 ± 27.9* | 206.4 ± 100.7* | 3.49 ± 0.52 |
| Distal | ||||||
| Control | 11 | 86.6 ± 32.2 | 49.6 ± 21.4 | 136.3 ± 43 | 438.8 ± 141 | 3.22 ± 0.30 |
| 0.008% Alz | 10 | 37.6 ± 21.1** | 31.4 ± 26.1 | 69.0 ± 44.7** | 256.8 ± 181.3 | 3.25 ± 1.28 |
| 0.04% Alz | 10 | 56.0 ± 24.7 | 34.1 ± 18.8 | 90.1 ± 36.9 | 298.1 ± 132.7 | 3.31 ± 0.40 |
| 0.008% Rub | 15 | 67.9 ± 30.6 | 44.6 ± 34 | 112.5 ± 60.9 | 379.6 ± 235.3 | 3.31 ± 0.32 |
| 0.04% Rub | 15 | 65.7 ± 29.6 | 25.3 ± 18 | 90.9 ± 39.7 | 265.3 ± 132.9 | 2.85 ± 0.54 |
*P < 0.05 and **P< 0.01 versus controls, respectively. †Mean ± SD. ACF, aberrant crypt foci; Alz, alizarin; Rub, rubiadin.
Table 6.
Incidences and multiplicity of proliferative lesions in the large intestine of rats treated with Alz or Rub in a medium‐term multi‐organ carcinogenesis bioassay
| Group | No. of animals examined | Incidence (%) | Multiplicity | Leiomyosarcoma (Incidence) | ||||
|---|---|---|---|---|---|---|---|---|
| Dysplasia | Adenoma | Adenocarcinoma | Dysplasia | Adenoma | Adenocarcinoma | |||
| Control | 11 | 18.2 | 27.3 | 27.3 | 0.18 ± 0.60† | 0.27 ± 0.47 | 0.55 ± 1.21 | 0 |
| 0.008% Alz | 18 | 27.8 | 38.9 | 22.2 | 0.28 ± 0.57 | 0.44 ± 0.62 | 0.33 ± 0.70 | 0 |
| 0.04% Alz | 17 | 53 | 47.1 | 35.3 | 0.82 ± 1.24 | 0.47 ± 0.62 | 0.41 ± 0.80 | 0 |
| 0.008% Rub | 21 | 23.8 | 47.6 | 42.9 | 0.24 ± 0.54 | 0.62 ± 0.80 | 0.52 ± 0.98 | 2 |
| 0.04% Rub | 20 | 75.0* | 60 | 65 | 1.00 ± 1.03* | 0.85 ± 1.26 | 0.90 ± 0.91 | 0 |
*P < 0.01 versus controls. †Mean ± SD. Alz, alizarin; Rub, rubiadin.
In the other organs including the thyroid, lungs, and urinary bladder, there was no modification by test chemicals of tumorigenesis histopathologically (data not shown).
Discussion
In the present study, Rub and Alz demonstrated carcinogenic potential in the kidney, liver, and large intestine, and the kidney, respectively. These carcinogenicity profiles are coincident with the results of our recent 26‐week study except for the case of the large intestine.( 15 ) Rub increased renal cell adenomas and carcinomas in the outer medulla of the kidney, as well as preneoplastic lesions such as atypical tubules and atypical hyperplasias in the same area, indicating clear targeting of proximal tubule cells for renal tumor induction. Rub has been reported to exert strong genotoxicity,( 7 ) and in our previous study with 26‐week treatment of rats caused atypical tubules of proximal tubule cells in the outer medulla,( 15 ) suggesting that Rub plays a critical role as an initiator as well as a promoter of renal carcinogenesis by MC. Rub treatment also induced karyomegaly and increased cell proliferative activity in the proximal tubule cells of outer medulla in a previous short‐term assay, without significant increase of 8‐hydroxydeoxyguanosine (8‐OHdG) level in the kidney,( 15 ) suggesting that all the changes in the outer medulla observed with Rub treatment might be due to direct DNA damage rather than oxidation events.
The increase in atypical hyperplasias and tendency for increase of renal cell adenomas and carcinomas in the outer medulla in the 0.04% Alz group suggest that Alz may exert promoting, but not potent initiating, effects because of its non‐genotoxic property.( 8 , 13 , 14 ) However, we previously found Alz to increase 8‐OHdG levels in kidneys and cell proliferative activity in the proximal tubule cells of the outer medulla in rats after 1 week or 26 weeks of treatment.( 15 ) Thus, the two components of MC might act by different mechanisms. Recently, renal tumor‐promoting effects were detected in a rat medium‐term multi‐organ carcinogenesis assay in rats initiated with DEN, MNU, and DHPN( 20 ) and it has been suggested that MC may act by inducing both direct and oxidative DNA damage in the kidneys.( 12 ) Thus, Alz and Rub might respectively be involved in renal carcinogenesis through oxidative and direct DNA damage.
In the liver, increase in hepatocellular foci in the 0.04% Rub group indicates enhancing potential, albeit weaker than in the kidney, consistent with the results of our 2‐year carcinogenicity study.( 3 ) On the other hand, Rub has been reported to be an antioxidant with hepatoprotective effects against carbon tetrachroride‐induced hepatic damage in rats.( 21 , 22 ) Further investigations of oxidative stress in the liver with Alz or Rub would appear warranted.
The high dose of Rub also significantly increased dysplasias and showed a tendency to increase adenomas and adenocarcinomas in the large intestine in the present study. MC is reported to cause DNA adducts in the colon( 12 ) and this could conceivably be due to Rub. However, in our 2‐year study of MC, no preneoplastic/neoplastic lesions were observed in the large intestine,( 3 ) suggesting that the effect of Rub derived from metabolized LuP, one of the MC components, on the large intestine could be weak and the carcinogenic potential might be detectable only in the present sensitive assay.( 17 ) Furthermore, results of ACF analysis in the present study showed decreased incidence and multiplicity in both the Alz and Rub groups. Generally, it is considered that ACF are putative preneoplastic lesions in both rodents and humans,( 23 , 24 , 25 ) so that decrease should reflect the inhibitory effects of chemicals. The situation is complicated, however, and β‐catenin‐accumulated crypts (BCAC) have been suggested as more reliable biomarkers and premalignant lesions in the colon.( 26 , 27 , 28 ) Cholic acid, a well known promotor of colon carcinogenesis, suppressed the formation of ACF, whereas it enhanced the development of BCAC.( 28 ) In the present study, analysis in the proliferating lesions of the large intestine showed that Rub or Alz itself does not affect β‐catenin localization.
In conclusion, the results in the present study demonstrate that, in addition to the kidney, the liver and large intestine are also targets of Rub carcinogenicity with significant roles for the compound as both an initiator as well as a promoter. Alz also exerts promotor potential in the kidney, but the effects are much weaker than with Rub. The present study thus indicates that Rub is the major contributor to MC‐induced carcinogenicity and should be dealt carefully as a significant carcinogen against human.
Acknowledgments
We thank Ms Tomomi Morikawa and Ms Ayako Kaneko for their technical assistance in conducting the animal study. This work was supported by a Grant‐in‐Aid for Research on Food Safety (no. H18‐Shokuhin‐Ippan‐007) from the Ministry of Health, Labor and Welfare of Japan.
References
- 1. Inoue K, Shibutani M, Masutomi N et al. A 13‐week subchronic toxicity study of madder color in F344 rats. Food Chem Toxicol 2008; 46: 241–52. [DOI] [PubMed] [Google Scholar]
- 2. Inoue K, Shibutani M, Masutomi N et al. One‐year chronic toxicity of madder color in F344 rats – induction of preneoplastic/neoplastic lesions in the kidney and liver. Food Chem Toxicol 2008; 46: 3303–10. [DOI] [PubMed] [Google Scholar]
- 3. Inoue K, Yoshida M, Takahashi M et al. Induction of kidney and liver cancers by the natural food additive madder color in a two‐year rat carcinogenicity study. Food Chem Toxicol 2009; 47: 184–91. [DOI] [PubMed] [Google Scholar]
- 4. Hachiya N, Takizawa Y, Kawamura T et al. A review of acute toxicity and genotoxicity data on natural food additives (in Japanese). Toxicol Forum 1985; 8: 91–105. [Google Scholar]
- 5. Asanoma M, Miyabe M, Sakabe Y. Mutagenicity of natural food additives in Salmonella typhimurium. Report no. II (in Japanese). Ann Rep Nagoya City Public Health Res Inst 1984; 30: 53–7. [Google Scholar]
- 6. Brown JP, Dietrich PS. Mutagenicity of anthraquinone and benzanthrone derivatives in the Salmonella/microsome test: activation of anthraquinone glycosides by enzymic extracts of rat cecal bacteria. Mutat Res 1979; 66: 9–24. [DOI] [PubMed] [Google Scholar]
- 7. Blömeke B, Poginsky B, Schmutte C, Marquardt H, Westendorf J. Formation of genotoxic metabolites from anthraquinone glycosides, present in Rubia tinctorum L. Mutat Res 1992; 265: 263–72. [DOI] [PubMed] [Google Scholar]
- 8. Kawasaki Y, Goda Y, Yoshihira K. The mutagenic constituents of Rubia tinctorum . Chem Pharm Bull 1992; 40: 1504–9. [DOI] [PubMed] [Google Scholar]
- 9. Yasui Y, Takeda N. Identification of a mutagenic substance, in Rubia tinctorum L. (madder) root, as lucidin. Mutat Res 1983; 121: 185–90. [DOI] [PubMed] [Google Scholar]
- 10. Westendorf J, Poginsky B, Marquardt H, Groth G, Marquardt H. The genotoxicity of lucidin, a natural component of Rubia tinctorum L. and lucidinethylether, a component of ethanolic Rubia extracts. Cell Biol Toxicol 1988; 4: 225–39. [DOI] [PubMed] [Google Scholar]
- 11. Westendorf J, Marquardt H, Poginsky B, Dominiak M, Schmidt J, Marquardt H. Genotoxicity of naturally occurring hydroxyanthraquinones. Mutat Res 1990; 240: 1–12. [DOI] [PubMed] [Google Scholar]
- 12. Westendorf J, Pfau W, Schulte A. Carcinogenicity and DNA adduct formation observed in ACI rats after long‐term treatment with madder root, Rubia tinctorum L. Carcinogenesis 1998; 19: 2163–8. [DOI] [PubMed] [Google Scholar]
- 13. Poginsky B, Westendorf J, Blömeke B et al. Evaluation of DNA‐binding activity of hydroxyanthraquinones occurring in Rubia tinctorum L. Carcinogenesis 1991; 12: 1265–71. [DOI] [PubMed] [Google Scholar]
- 14. Marec F, Kollarova I, Jegorov A. Mutagenicity of natural anthraquinones from Rubia tinctorum in the Drosophila wing spot test. Planta Med 2001; 67: 127–31. [DOI] [PubMed] [Google Scholar]
- 15. Inoue K, Yoshida M, Takahashi M et al. Possible contribution of rubiadin, a metabolite of madder color, to renal carcinogenesis in rats. Food Chem Toxicol 2009; 47: 752–9. [DOI] [PubMed] [Google Scholar]
- 16. Jager I, Hafner C, Welsch C, Schneider K, Iznaguen H, Westendorf J. The mutagenic potential of madder root in dyeing processes in the textile industry. Mutat Res 2006; 605: 22–9. [DOI] [PubMed] [Google Scholar]
- 17. Ito N, Hasegawa R, Imaida K, Hirose M, Shirai T. Medium‐term‐liver and multiorgan carcinogenesis bioassays for carcinogens and chemopriventive agents. Exp Toxicol Pathol 1996; 48: 113–9. [DOI] [PubMed] [Google Scholar]
- 18. Dietrich DR, Swenberg JA. Preneoplastic lesions in rodent kidney induced spontaneously or by non‐genotoxic agents: predictive nature and comparison to lesions induced by genotoxic carcinogens. Mutat Res 1991; 248: 239–60. [DOI] [PubMed] [Google Scholar]
- 19. Imaida K, Tatematsu M, Kato T, Tsuda H, Ito N. Advantages and limitations of stereological estimation of placental glutathione S‐transferase‐positive rat liver cell foci by computerized three‐dimensional reconstruction. Jpn J Cancer Res 1989; 80: 326–30. [DOI] [PMC free article] [PubMed] [Google Scholar]
- 20. Yokohira M, Yamakawa K, Hosokawa K et al. Promotion potential of madder color in a medium‐term multi‐organ carcinogenesis bioassay model in F344 rats. J Food Sci 2008; 73: T26–32. [DOI] [PubMed] [Google Scholar]
- 21. Tripathi YB, Sharma M, Manickam M. Rubiadin, a new antioxidant from Rubia cordifolia . Indian J Biochem Biophys 1997; 34: 302–6. [PubMed] [Google Scholar]
- 22. Rao GM, Rao CV, Pushpangadan P, Shirwaikar A. Hepatoprotective effects of rubiadin, a major constituent of Rubia cordifolia Linn. J Ethnopharmacol 2006; 103: 484–90. [DOI] [PubMed] [Google Scholar]
- 23. Bird RP. Role of aberrant crypt foci in understanding the pathogenesis of colon cancer. Cancer Lett 1995; 93: 55–71. [DOI] [PubMed] [Google Scholar]
- 24. Roncucci L, Stamp D, Medline A, Cullen JB, Bruce WR. Identification and quantification of aberrant crypt foci and microadenomas in the human colon. Human Pathol 1991; 22: 287–94. [DOI] [PubMed] [Google Scholar]
- 25. Pretlow TP, Barrow BJ, Ashton WS et al. Aberrant crypts: putative preneoplastic foci in human colonic mucosa. Cancer Res 1991; 51: 1564–7. [PubMed] [Google Scholar]
- 26. Yamada Y, Yoshimi N, Hirose Y et al. Sequential analysis of morphological and biological properties of beta‐catenin‐accumulated crypts, provable premalignant lesions independent of aberrant crypt foci in rat colon carcinogenesis. Cancer Res 2001; 61: 1874–8. [PubMed] [Google Scholar]
- 27. Hata K, Yamada Y, Kuno T et al. Tumor formation is correlated with expression of ß‐catenin‐accumulated crypts in azoxymethane‐induced colon carcinogenesis in mice. Cancer Sci 2004; 95: 316–20. [DOI] [PMC free article] [PubMed] [Google Scholar]
- 28. Hirose Y, Kuno T, Yamada Y et al. Azoxymethane‐induced beta‐catenin‐accumulated crypts in colonic mucosa of rodents as an intermediate biomarker for colon carcinogenesis. Carcinogenesis 2003; 24: 107–11. [DOI] [PubMed] [Google Scholar]