

Abstract
We analyzed relationships between histological subtypes of pulmonary adenocarcinomas and three gene alterations (p53, K‐ras, and epidermal growth factor receptor gene), or thyroid transcription factor‐1 (TTF‐1) expression, and also studied prognoses by the subtypes, with or without combined multiple gene mutation status. Our purpose was to clearly determine pathogenesis, along with the best predictive value for biology and therapy‐related traits. A total of 223 consecutively resected pulmonary adenocarcinomas were sub‐classified using either the World Health Organization (WHO) or our five‐cell type (FCT) classification system (hobnail, columnar/cuboidal, mixed, polygonal/oval, and goblet cell types). DNAs extracted from frozen samples of the adenocarcinomas were examined for gene alterations, and TTF‐1 expressions were determined using immunohistochemistry. Next, relationships among the various data and clinicopathological factors were analyzed. The most striking result was: while almost 70% of adenocarcinomas were sub‐classified as a mixed subtype by WHO, the FCT classified many of them as other cell subtypes. The FCT closely reflected differences in etiological factors, cellular lineages, and frequencies of gene mutations; and whether the data from combined gene mutations were used or not, differences among the cell types in postoperative survivals appeared. In contrast, subtypes of WHO did not show any association with the gene alteration or prognosis, and the FCT more suitably indicated sensitivity to gefitinib therapy than did WHO. The FCT combined with multiple gene mutation status appears to be useful in indicating pathogenesis and predicting the biological nature of pulmonary adenocarcinomas, and it could facilitate development of new therapies for each subtype. (Cancer Sci 2010)
Adenocarcinomas of the lung are the most common histological type in Japan, and show markedly different biological behavior from case to case.( 1 ) Therefore, if we could predict the malignant potential of an adenocarcinoma and make a prognosis for chemo‐ or radiation‐therapy from cytology, biopsy, and/or operation specimens, it would lead to better treatment options. To better satisfy predictive requirements, sub‐classifications by gene expression profiling have been proposed.( 2 , 3 , 4 , 5 ) However, emerging evidence showed that gene expression lists selected for these classifications vary considerably from study to study, making it difficult to reconcile findings or reach any definite conclusions.( 6 , 7 ) Moreover, a recent paper suggested that an integrated approach using gene expression together with associated clinical, pathological, and other available information may be more promising for future work.( 8 ) Thus, the importance of pathological data integration for prognoses has been established.
There is a high correlation between a gene expression profile and tumor histological phenotype. So we suspected that if we analyzed gene alterations by subtypes of histology, it would be possible to get more reliable data for predictive requirements. So far only a few reports have studied prognosis bases on gene mutations by the subtypes,( 2 , 9 ) and there has been no study on prognosis and other predictive requirements combined with multiple gene mutations.
For histological sub‐classification of adenocarcinomas, the 1999 World Health Organization (WHO) classification has been widely used.( 10 ) However, since most cases are actually adenocarcinomas with mixed subtypes, this classification system cannot effectively predict malignant potential and prognosis. Only a few studies using modified WHO sub‐classifications have reported correlation between prognosis and subtypes.( 9 , 11 )
In sub‐classification of lung adenocarcinomas by gene expression profiling analysis, the importance of cellular lineage have been stressed.( 12 , 13 ) Histologically, the cellular lineage can be determined by looking to the morphologic resemblance of tumor cells to epithelial cells in the pulmonary tissue. It was thus suspected that a sub‐classification of adenocarcinomas based on such cytological features would better reflect the cellular lineage. Toward this end, we previously presented a system for sub‐classification of adenocarcinomas referring to the cellular lineage based on resemblance to cells constituting the bronchial or bronchiolo‐alveolar epithelium.( 1 )
The p53, K‐ras, and epidermal growth factor receptor (EGFR) genes are thought to play important roles in the genesis and progression of lung cancers, and EGFR may be related to sensitivity to gefitinib therapy. Furthermore, mutation statuses of those three genes may not always be appropriately identified by expression profiling analysis.
We therefore examined not only relationships between histological subtypes of adenocarcinomas by WHO or our cell type classification system and those three gene alterations, but also the impact on prognosis by subtypes with or without combined multiple gene mutations: we were seeking the best predictive value for biological nature and therapy‐related traits.
Materials and Methods
Tumor samples, clinicopathological data, and smoking history. We examined a large number, 223, of lung adenocarcinomas, of which 113 had been examined for p53 mutation spectra previously.( 1 ) None of the carcinomas were accompanied by other primary malignancies and all had been resected consecutively from 1989 to 1995 at the Cancer Institute Hospital, Tokyo, Japan. All patients had undergone operations as described previously.( 1 ) None had received chemotherapy or radiotherapy before surgery, but 66 patients had postoperative chemo‐ and/or radio‐therapy. Histopathological sub‐classification of adenocarcinomas was done by three of the authors (E.T., Y.I., and A.O.) according to the 1999 WHO classification of lung tumors,( 10 ) and our original five‐cell type (FCT) sub‐classification: (i) hobnail; (ii) columnar/cuboidal (col/cub); (iii) polygonal/oval (po/ov); (iv) goblet; and (v) mixed cell (Fig. 1), defined previously.( 1 ) This classification was performed based on the predominant cell type occupying more than 70% of the area, except with the mixed type, for which the cut‐off for each cell type was occupation of more than 30% of the area. Polygonal/oval (po/ov) cells were diagnosed only when the areas proliferating in sheets made up more than 95% of the tumor. In the cases classified by WHO, the existence of bronchioloalveolar (BA) spread was also determined.
Figure 1.
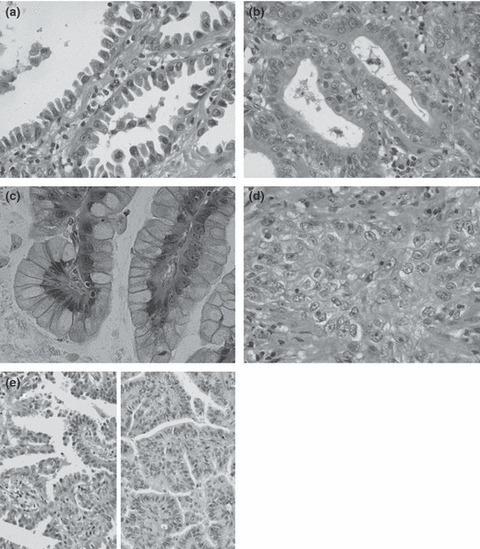
Cell types of adenocarcinomas. (a) Hobnail cell type: epithelial cells look like Clara or type II pneumocyte cells. Apical portions protrude or bulge into the lumen. Note hobnail‐ or tadpole‐shaped cells. (b) Columnar/cuboidal (col/cub) cell type: characterized by rather large columnar or cuboidal cells with flat apices, resembling ciliated cells of bronchial epithelium; cytoplasmic mucus is usually absent, and even when present, is scanty and located near the free cell surface. (c) Goblet cell type: cells have abundant mucus in the cytoplasm, very similar to goblet cells. (d) Polygonal/oval (po/ov) cell type: composed of polygonal or oval cells with or without mucus in the cytoplasm, proliferating in sheets or nests. (e) Mixed cell type: showing a mixture of hobnail (left) and col/cub cells (right) forming a papillary structure. This type usually consists of two from types (a) to (c). Hematoxylin–eosin staining; original magnification: (a–d) ×400; (e) ×200.
Data for other clinicopathological parameters, pathological stages (p‐stages) and the patient’s smoking status are shown in Table 1. The p‐stages were determined using the International Union Against Cancer TNM staging system.( 14 ) A patient’s smoking history was obtained as described previously.( 1 ) All patients were followed up for more than 5 years. The study was approved by the institutional review board of the Cancer Institute Hospital and Kanagawa Cancer Center Research Institute.
Table 1.
p53, K‐ras, and EGFR mutations by clinicopathological parameters
| Total | No. of cases (%) | ||||||
|---|---|---|---|---|---|---|---|
| p53 status | K‐ras status | EGFR statusa | |||||
| Wild type | Mutated | Wild type | Mutated | Wild type | Mutated | ||
| All cases | 223 | 127 (57) | 96 (43) | 205 (92) | 18 (8) | 128 (58) | 94 (42) |
| Age at surgery (years) | |||||||
| Mean ± SD | 61 ± 11 | 61 ± 11 | 61 ± 11 | 61 ± 10 | 63 ± 12 | 61 ± 10 | 61 ± 12 |
| Sex | |||||||
| Male | 124 (56) | 63 (51) | 61 (49)¶** | 112 (90) | 12 (10) | 88 (72) | 35 (28)¶* |
| Female | 99 (44) | 64 (65) | 35 (35) | 93 (94) | 6 (6) | 40 (40) | 59 (60) |
| Pathological stage | |||||||
| I | 110 (49) | 72 (65) | 38 (35)¶** | 97 (88) | 13 (12)¶** | 59 (54) | 50 (46) |
| II | 17 (8) | 9 (53) | 8 (47) | 17 (100) | 0 | 11 (65) | 6 (35) |
| III | 90 (40) | 43 (48) | 47 (52) | 86 (96) | 4 (4) | 54 (60) | 36 (40) |
| IV | 6 (3) | 3 (50) | 3 (50) | 5 (83) | 1 (17) | 4 (67) | 2 (33) |
| Smoking status | |||||||
| Non‐smokers | 98 (44) | 65 (66) | 33 (34)¶** | 94 (96) | 4 (4)¶*** | 40 (41) | 58 (59)¶* |
| Smokers | 125 (56) | 62 (50) | 63 (50) | 111 (89) | 14 (11) | 88 (71) | 36 (29) |
| Cell type classification | |||||||
| Hobnail cell type | 102 (46) | 72 (71) | 30 (29) | 101 (99) | 1 (1) | 36 (36) | 65 (64)‡* |
| Mixed cell type | 49 (22) | 29 (59) | 20 (41) | 47 (96) | 2 (4) | 31 (63) | 18 (37) |
| Columnar/cuboidal cell type | 44 (20) | 14 (32) | 30 (68)○*†* | 38 (86) | 6 (14)○* | 36 (82) | 8 (18)†* |
| Polygonal/oval cell type | 19 (8) | 7 (37) | 12 (63)○*†** | 17 (89) | 2 (11)○*** | 16 (84) | 3 (16)†*** |
| Goblet cell type | 7 (3) | 4 (57) | 3 (43) | 0 | 7 (100)‡ | 7 (100) | 0††† |
| Unclassified | 2 (1) | 1 | 1 | 2 | 0 | 1 | 1 |
| WHO classification | |||||||
| Acinar | 33 (15) | 9 (27) | 24 (73) | 30 (91) | 3 (9) | 28 (85) | 5 (15) |
| Papillary | 27 (12) | 17 (63) | 10 (37)§*#*** | 26 (96) | 1 (4) | 15 (56) | 12 (44)§** |
| Bronchioloalveolar carcinoma | 2 (1) | 1 (50) | 1 (50) | 1 (50) | 1 (50) | 1 (50) | 1 (50) |
| Solid adenocarcinoma with mucin | 10 (4) | 3 (30) | 7 (70) | 9 (90) | 1 (10) | 7 (70) | 3 (30) |
| Adenocarcinoma with mixed subtypes | 149 (67) | 95 (64) | 54 (36)§*#** | 137 (92) | 12 (8) | 75 (51) | 73 (49)§* |
| Unclassified | 2 (1) | 2 | 0 | 2 | 0 | 2 | 0 |
| Bronchioloalveolar spreadb | |||||||
| + | 86 (39) | 60 (70) | 26 (30)¶* | 81 (94) | 5 (6) | 34 (40) | 51 (60)¶* |
| − | 137 (61) | 67 (49) | 70 (51) | 124 (91) | 13 (9) | 94 (69) | 43 (31) |
○ vs hobnail cell type; †vs mixed cell type; ‡vs all other cell types; §vs acinar; #vs solid adenocarcinoma with mucin; ¶Male vs female; pathological stage I vs II–IV; non‐smokers vs smokers; or bronchioloalveolar spread + vs−. The number of symbols, *, **, ***, express P‐values; *P < 0.01, **P < 0.05, ***P < 0.1, respectively, by chi‐squared test or Fisher’s exact test. a EGFR mutation was not examined for one case. b+, with bronchioloalveolar spread; −, without bronchioloalveolar spread. EGFR, epidermal growth factor receptor; WHO, World Health Organization.
DNA preparation and gene analyses. Genomic DNAs preparation, polymerase chain reaction‐single strand conformation polymorphism (PCR‐SSCP), and sequencing for p53 were performed as described previously.( 1 , 15 ) The point to emphasize here is that samples which did not show p53 mutation in our earlier study, as well as those collected after publication of the paper, amounting to one‐half of all analyzed cases, were microdissected.
Only point mutations of codon 12 for the K‐ras gene were analyzed, since more than 90% of K‐ras gene mutations are reported to involve this codon.( 16 ) The mutant‐allele‐specific amplification (MASA) method was used for samples documented in a previous paper( 16 ) and for the remaining samples, almost half of all cases, the MASA method with nested‐PCR was performed as described previously, with DNAs extracted from microdissected tissue.( 17 )
We analyzed the EGFR hotspot mutation L858R in exon 21 and in‐frame deletions of exon 19 that account for approximately 91% of EGFR kinase domain mutations using the loop‐hybrid mobility shift assay (LH‐MSA) developed by Matsukuma et al. ( 18 , 19 , 20 ) (Fig. S1).
Immunohistochemical staining. Thyroid transcription factor‐1 (TTF‐1) expression is considered to be a lineage marker of small‐sized bronchioles and pneumocytes (SBP), termed the terminal respiratory unit (TRU).( 21 ) Therefore, we examined its expression by immunohistochemistry. Sections (4‐μm thick) of formalin‐fixed, paraffin‐embedded tissue, including large cut surfaces of adenocarcinomas, were immunohistochemically stained by the avidin–biotin peroxidase complex method, according to the manufacturer’s instruction. TTF‐1 (8G7G3; Dako, Copenhagen, Denmark), a mouse monoclonal antibody, was used as the first antibody. The reaction intensity was evaluated using four categories – none, weak, moderate, and strong – and the latter two categories were considered as positive. The extent of positive cells was also semi‐quantitatively categorized as follows: 0–25%, negative; 26–50%, 1+ positive; 51–75%, 2+; ≥76%, 3+.
Statistical analysis. To search for any correlations between three gene mutation statuses and clinicopathological data, the chi‐squared test or Fisher’s exact probability test were used. In addition, we used discriminant analysis to estimate which sub‐classification could differentiate the presence of the mutation with greatest accuracy. The 5‐year survival rates for patients were examined using the Kaplan–Meier method, and differences were determined by the log‐rank test for univariate analysis. All statistical analyses were performed with SPSS for Windows (version 10.1; SPSS, Chicago, IL, USA). Differences were considered to be significant with a P‐value <0.05.
Results
Case distributions by WHO and FCT classifications of adenocarcinomas and relationships between the two are presented in 1, 2, respectively. With the former, almost two‐thirds of the tumors were classified as adenocarcinomas with mixed subtypes, while with the latter, about half of the tumors were of hobnail type. Using our system, not only does each cell type show a rather consistent one‐on‐one correspondence with WHO pure subtypes – such as hobnail to papillary, col/cub to acinar, and po/ov to solid – but cases classified as a mixed subtype can be markedly reduced. There were five exceptional cases which were classified as acinar or papillary subtypes by WHO, but as mixed by FTC, and these consisted of both hobnail and col/cub cells. A representative figure for them is presented in Figure 1(e). Most carcinomas with BA spread (79%) were of hobnail cell type. Both the distribution patterns with the two classification systems and the correlations were almost the same as in our previous study.( 1 )
Table 2.
Relationships between cell type and WHO classification or bronchioloalveolar spread of lung adenocarcinomas
| No. of cases (%) | ||||||
|---|---|---|---|---|---|---|
| Cell type classification | ||||||
| Hobnail | Mixed | Col/cub | Po/ov | Goblet | Unclassified | |
| WHO classification | ||||||
| Acinar | 0 | 2 (6) | 26 (79) | 5 (15) | 0 | 0 |
| Papillary | 22 (81) | 3 (11) | 0 | 1 (4) | 0 | 1 |
| Bronchioloalveolar carcinoma | 1 (50) | 0 | 0 | 0 | 1 (50) | 0 |
| Solid adenocarcinoma with mucin | 0 | 0 | 0 | 10 (100) | 0 | 0 |
| Adenocarcinoma with mixed subtypes | 78 (52) | 44 (30) | 18 (12) | 3 (2) | 6 (4) | 0 |
| Unclassified | 1 | 0 | 0 | 0 | 0 | 1 |
| Bronchioloalveolar spread | ||||||
| + | 68 (79) | 15 (17) | 0 | 0 | 3 (4) | 0 |
| − | 34 (25) | 34 (25) | 44 (32) | 19 (14) | 4 (3) | 2 |
+, with bronchioloalveolar spread; −, without bronchioloalveolar spread; Col/cub, columnar/cuboidal; Po/ov, polygonal/oval; WHO, World Health Organization.
Reproducibility using the FCT classification was high. One of the authors (A.O.) was a thoracic surgeon with no experience of histopathological diagnosis of lung carcinomas who had been trained in classification by a veteran pathologist (E.T.): he classified 107 consecutive cases, and 85% coincided with the diagnosis made by the pathologist, a reproducibility equivalent to that in the previous study.( 1 )
Relationships between TTF‐1 staining and FCTs. The distribution of 205 TTF‐1 examined cases is shown in Table 3. We then divided TTF‐1 expression into two groups – <50% (negative and 1+) and more than 51% (2+ and 3+) – and analyzed relationships of the expression to FCT classification. Almost all hobnail cell cases were ≥51%, followed by mixed, but less than half of the cases were ≥51% for other types with significant differences between the hobnail and mixed, and between each former type and each other type. Thus, the cell types were divided into three groups: (i) hobnail cells with very high TTF‐1 positivity; (ii) mixed type with high positivity; and (iii) col/cub, po/ov, and goblet with rather low positivity.
Table 3.
Relationships between TTF‐1 expression and cell type classification system
| No. of cases (%) | Total | ||||
|---|---|---|---|---|---|
| TTF‐1 expression | |||||
| Negative | 1+ | 2+ | 3+ | ||
| Hobnail* | 1 (1) | 5 (5) | 8 (8) | 83 (86) | 97 |
| Mixed* | 5 (11) | 6 (13) | 9 (19) | 27 (57) | 47 |
| Columnar/cuboidal | 18 (46) | 4 (10) | 6 (15) | 11 (28) | 39 |
| Polygonal/oval | 8 (50) | 2 (13) | 2 (13) | 4 (25) | 16 |
| Goblet | 5 (83) | 0 | 1 (17) | 0 | 6 |
| Total | 37 (18) | 17 (8) | 26 (13) | 125 (61) | 205 |
For statistical analysis, thyroid transcription factor‐1 (TTF‐1) expression statuses were compiled into two groups, negative and 1+, and 2+ and 3+, and then frequencies of the statuses were compared among the subtypes by chi‐squared test or Fisher’s exact test. *vs each other type; P < 0.01, respectively.
Smoking status in relation to FCTs. The percentages of smokers with col/cub and po/ov lesions were significantly higher than those with hobnail and mixed cell types. The goblet cell type showed a tendency to be less frequent than that of col/cub cells (P < 0.1) (Table 4). By WHO classifications, the acinar and solid adenocarcinomas showed higher frequencies of smokers than the mixed subtypes and the papillary adenocarcinomas, with significant differences.
Table 4.
p53 mutational spectra and smoking status for subtypes by cell type and WHO classifications
| Subtypes | No. of cases | No. of p53 mutations (%) | Smoking status | ||||
|---|---|---|---|---|---|---|---|
| All mutations | Point mutation | Deletion/insertion | No. of smokers (%) | ||||
| CpG to CpA transition | G to T transversion | Others | |||||
| All cases | 223 | 100 (45) | 22 (22) | 26 (26) | 29 (29) | 23 (23) | 125 (56) |
| Cell type classification | |||||||
| Hobnail type | 102 | 30 (29) | 14 (47) | 6 (20)‡*** | 5 (17) | 5 (17)†** | 42 (41) |
| Mixed cell type | 49 | 20 (41) | 1 (5)○* | 2 (10)‡** | 8 (40)○*** | 9 (45) | 24 (49) |
| Columnar/cuboidal cell type | 44 | 33 (75) | 4 (12)○* | 13 (39) | 9 (27) | 7 (21) | 38 (86)○*†* |
| Polygonal/oval cell type | 19 | 12 (63) | 3 (25) | 3 (25) | 5 (42)○*** | 1 (8)†** | 16 (84)○*†* |
| Goblet type | 7 | 3 (43) | 0 | 0 | 2 (67) | 1 (33) | 4 (57)‡ |
| Unclassified | 2 | 2 | 0 | 2 | 0 | 0 | 1 (50) |
| WHO classification | |||||||
| Acinar | 33 | 24 (73) | 4 (17) | 8 (33) | 7 (29) | 5 (21) | 29 (88) |
| Papillary | 27 | 11 (41) | 3 (27) | 5 (45)¶*** | 1 (9) | 2 (18) | 18 (67)§**¶*** |
| Bronchioloalveolar carcinoma | 2 | 1 (50) | 0 | 0 | 1 (100) | 0 | 0§**#*** |
| Solid adenocarcinoma with mucin | 10 | 7 (70) | 2 (29) | 2 (29) | 3 (43) | 0 | 8 (80) |
| Adenocarcinoma with mixed subtypes | 149 | 57 (38) | 13 (23) | 11 (19) | 17 (30) | 16 (28) | 70 (47)§*#** |
| Unclassified | 2 | 0 | 0 | 0 | 0 | 0 | 0 |
○ vs hobnail cell type; †vs mixed cell type; ‡vs columnar/cuboidal cell type; §vs acinar; #vs solid adenocarcinoma with mucin; ¶vs adenocarcinoma with mixed subtypes. The number of symbols *, **, ***, express P‐values; *P < 0.01, **P < 0.05, ***P < 0.1, respectively, by chi‐squared test or Fisher’s exact test. WHO, World Health Organization.
p53 mutation.
p53 mutation frequency.
Mutations of the p53 gene were detected in 96 of 223 lesions (43%) (Table 1, Table S1). By FCT classification, the highest frequencies of mutations were observed in the col/cub and po/ov cell types, followed by the goblet, mixed, and hobnail cell types, in order, with significant differences between col/cub or po/ov and hobnail, and between col/cub and mixed cell types. By WHO classification, the frequencies of the mutations were high in acinar adenocarcinomas and solid adenocarcinomas with mucin, and low in papillary adenocarcinomas and adenocarcinomas with mixed subtypes, with statistically significant differences between acinar and papillary or mixed, and between solid and mixed.
p53 mutational spectra (Table 4).
We divided p53 mutations into: CpG to CpA transitions (CpG→A TS), G:C to T:A transversions (G→T TV), other transversions and transitions, and deletions/insertions. Following the FCT classification, the hobnail type featured many CpG→A TS and fewer G→T TV than the col/cub cell type. Furthermore, we here found that: (i) the mixed type showed fewer CpG→A TS and more deletions/insertions than the hobnail cell type, and fewer G→T TV than the col/cub types, with significant differences; (ii) the po/ov cell type had fewer deletions/insertions in comparison with the mixed type. In contrast, WHO classification revealed no significant links between subtypes and mutation spectra.
K‐ras mutation. A point mutation of codon 12 was observed in 18 lesions (8%) (Table 1, Table S1). By FCT classification, all cases of the goblet cell type had a point mutation, the 100% incidence being statistically significant compared with the rather infrequent occurrence of mutations in all other cell types. The frequencies in the col/cub and po/ov cell types were low, but still higher than those of the hobnail and mixed cell types, with significant differences between the col/cub and hobnail types. Using WHO classification, all subtypes except BAC showed almost the same low mutation frequencies. No significant differences in frequencies were observed among these groups.
EGFR mutation. From the total 222 patients, 94 EGFR mutations (42%) were detected – 38 L858R hotspot mutations in exon 21, 55 in‐frame deletions in exon 19, and one duplication/insertion (Table 1, Table S1). Mutation frequencies were highest in the hobnail cell type, followed by mixed, col/cub, po/ov, and goblet, in that order, with significant differences between the hobnail and every other cell type, and between mixed and col/cub types. When the mixed type was further sub‐classified into two groups, hobnail cells and other cell type predominant, the mutation frequencies were the same (37% each; 11/30 for the former and 7/19 for the latter) in both groups, the same as that of non‐sub‐classified cases. Using WHO classification, the mutation frequencies for papillary, BAC, and adenocarcinoma with mixed subtypes were very similar, followed by solid adenocarcinoma with mucin, and lastly acinar, with significant differences between acinar and mixed or papillary. The mutation frequency of adenocarcinomas with BA spread was 60%, significantly higher than that without BA spread (31%). On comparison of mutations by discriminant analysis, FCT classification proved more useful to estimate the presence of EGFR mutations than the WHO system, as shown in Table 5.
Table 5.
Sensitivity, specificity, and accuracy of the WHO and cell type classification for presence of EGFR mutation by discriminant analysis
| Sub‐classification | Sensitivity (%) | Specificity (%) | Accuracy (%) |
|---|---|---|---|
| WHO | 91.5 | 28.9 | 55.4 |
| Cell type | 69.1 | 71.9 | 70.7* |
*vs WHO classification, P < 0.01 (by chi‐squared test). EGFR, epidermal growth factor receptor; WHO, World Health Organization.
Relationships among p53, K‐ras, and EGFR mutations. With one exception, no cases with EGFR mutation had a K‐ras mutation, these mutations being significantly mutually exclusive. p53 mutations were less frequent in EGFR‐mutated cases than in the non‐mutated cases with borderline significant difference (P = 0.068). In contrast, p53 and K‐ras mutations appeared to be independent of each another (Table 6). These results are consistent with earlier reports.( 22 , 23 )
Table 6.
Relationships between p53, K‐ras, and EGFR mutations
| Genes | Mutations | No. of cases (%) | |||
|---|---|---|---|---|---|
| K‐ras mutations | p53 mutations | ||||
| + | − | + | − | ||
| EGFR | + | 1 (1) | 93 (99)* | 34 (36) | 60 (64)‡ |
| − | 17 (13) | 111 (87) | 62 (48) | 66 (52) | |
| p53 | + | 6 (6) | 90 (94) | ||
| − | 12 (10) | 114 (90) | |||
*P < 0.01 (by Fisher’s exact test). ‡P < 0.1 (by chi‐squared test). EGFR, epidermal growth factor receptor.
Prognosis by FCT or WHO classification system and by mutation status. For case distributions in p‐stage I and p‐stages II–IV among the cell types, there were significantly more p‐stage I lesions of the hobnail type than of other cell types (Table 7). We therefore analyzed prognoses separately for p‐stage I and p‐stages II–IV in both classifications. For this purpose the two BACs by WHO and their counterparts by FCT classification were excluded because the tumors were “carcinoma in situ.” The solid adenocarcinomas in p‐stage I analysis and the goblet cell type in p‐stage II–IV analysis were also excluded because the numbers were very small.
Table 7.
Case distributions of pathological stages by cell types or WHO subtypes
| Subclassification | No. of cases (%) | |||
|---|---|---|---|---|
| Pathological stages | ||||
| I | II | III | IV | |
| Cell type classification† | ||||
| Hobnail* | 62 (62) | 7 (7) | 30 (30) | 1 (1) |
| Mixed | 18 (37) | 4 (8) | 26 (53) | 1 (2) |
| Columnar/cuboidal | 19 (43) | 3 (7) | 20 (45) | 2 (5) |
| Polygonal/oval | 5 (26) | 3 (16) | 11 (58) | 0 |
| Goblet | 4 (67) | 0 | 1 (17) | 1 (17) |
| WHO classification | ||||
| Acinar | 17 (52) | 1 (3) | 14 (42) | 1 (3) |
| Papillary | 13 (50) | 0 | 13 (50) | 0 |
| Solid adenocarcinoma with mucin | 2 (20) | 2 (20) | 6 (60) | 0 |
| Adenocarcinoma with mixed subtypes | 76 (51) | 14 (9) | 55 (37) | 4 (3) |
*vs mixed, columnar/cuboidal, polygonal/oval, P < 0.05, respectively, by chi‐squared test (I vs II–IV). †One hobnail and one goblet case, both of which were classified into BA carcinoma by the World Health Organisation (WHO) classification, were excluded from original cases.
For p‐stage I cases, the 5‐year survival rates by FCT classification were highest in the hobnail cell type (92%), followed by mixed (83%), po/ov (80%), col/cub (74%), and goblet type (25%), with significant differences between the hobnail and col/cub or goblet cell types, and between the mixed or col/cub and goblet types (Fig. 2a). In contrast, there were no significant differences among the WHO subtypes (Fig. 2b). In p‐stage II–IV cases, the 5‐year survival rate was the highest for the po/ov cell type (64%), then hobnail (41%), mixed (39%), and col/cub (24%), with significant differences between po/ov and col/cub (Fig. 2c). However, for WHO subtypes, again no significant differences were observed (Fig. 2d).
Figure 2.
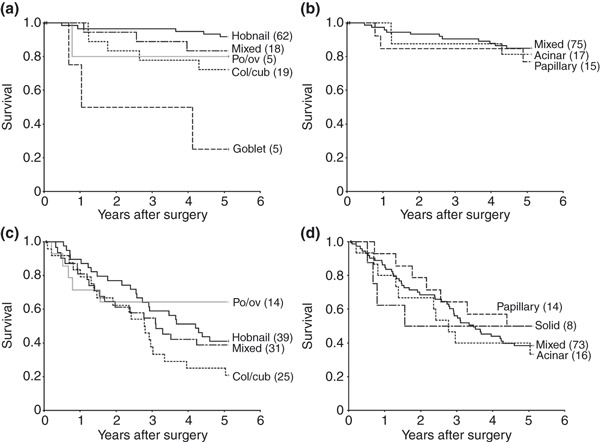
Disease‐specific Kaplan–Meier survival curves with respect to the cell type (a,c) and the World Health Organization (WHO) classifications (b,d) for p‐stage I (a,b) and p‐stages II–IV cases (c,d). Numbers in parentheses show numbers of patients. (a) The 5‐year survival rate of the hobnail type was significantly higher than that of the columnar/cuboidal (col/cub) or goblet cell types (P < 0.05 and <0.01, respectively), and survival for the mixed and the col/cub was also higher than for the goblet type (P < 0.01 and <0.05, respectively). (b) In contrast, there was no significant variation within the WHO classification. (c) The 5‐year survival rate was significantly higher for the polygonal/oval (po/ov) than the col/cub type (P < 0.05). (d) Note the lack of variation within the WHO classification.
Next, prognoses by combined gene mutation status were examined (Fig. 3a,b). In p‐stage I, the 5‐year survival rate for combined p53 and K‐ras mutated cases with no EGFR was significantly lower (25%) than those for cases with only EGFR (89%), no mutations (88%), only p53 (87%), or combined p53 and EGFR mutations but no K‐ras (80%). However, in p‐stages II–IV no significant differences in survival rates were found.
Figure 3.
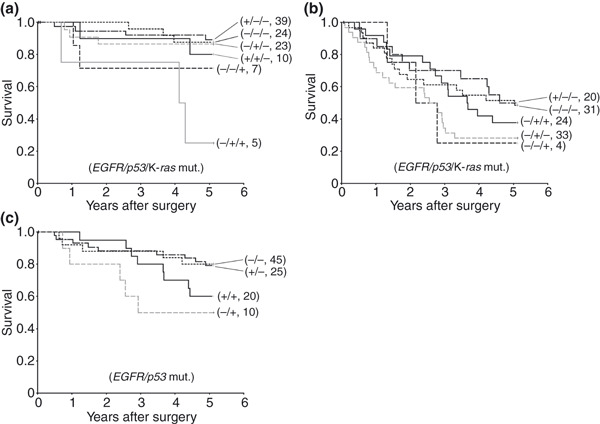
Disease‐specific Kaplan–Meier survival curves with respect to the mutational status for the three genes (EGFR/p53/K‐ras) in p‐stage I (a) and p‐stages II–IV cases (b), and for two genes (EGFR/p53) in all p‐stages for the hobnail cell type (c). The + or − indicate cases with or without mutations, respectively. Numbers in parentheses show numbers of patients. (a) The 5‐year survival rate for −/+/+ was significantly lower than those for −/−/−, −/+/−, +/−/−, and +/+/−, respectively (P < 0.01, <0.01, <0.01, and <0.05) in p‐stage I. (b) In contrast, there were no significant differences between any combinations in p‐stages II–IV cases. (c) The survival rate for +/− was significantly higher than that of −/+ with the hobnail cell type (P < 0.05).
We also analyzed effects of the gene mutation status on survival rates in the hobnail cell type, which had sufficient numbers for statistical analysis. As only one case had a K‐ras mutation, prognoses by EGFR and p53 mutation statuses were examined. Distributions of mutated cases for each gene did not show any significant differences between p‐stage I and p‐stages II–IV, so these were combined (Table 8). The 5‐year survival rates were higher for cases with no p53 mutation than those with a mutation, regardless of the EGFR mutation status (80%, 80%, 60%, and 50%, respectively). There was a statistically significant difference between cases with no p53 but EGFR mutations and with p53 but no EGFR mutations (Fig. 3c).
Table 8.
Case distribution of hobnail cell type by pathological stages and by mutation statuses
| Genes | Pathological stages | No. of cases (%) | P‐values | |
|---|---|---|---|---|
| Mutation | ||||
| − | + | |||
| p53 | I | 47 (76) | 15( 24) | 0.13* |
| II–IV | 24 (62) | 15 (38) | ||
| EGFR | I | 20 (33) | 41 (67) | 0.40* |
| II–IV | 16 (41) | 23 (59) | ||
*By chi‐squared test. EGFR, epidermal growth factor receptor.
Discussion
Rate of the mixed cell type in subtypes of adenocarcinomas. A main problem in applying WHO classification is that more than 70% of cases are classified into the mixed subtype. Using our system, a mixed subtype is markedly reduced, from 67% by the WHO to 22%. This may be partly because many cases classified into mixed type by the latter showed one of two histological patterns, that is a combination of (i) bronchioloalveolar pattern at the peripheral, papillary in the middle, and acinar in the central portion of tumor; or (ii) papillary at the peripheral and acinar in the central portion, with increase in fibrous connective tissue toward the central portion. However, tumor cells with each structure were usually classified as the same cell type, mostly hobnail or occasionally col/cub. From these results, use of the FCT classification, or new classification system combining the FCT and WHO classifications, may be effective for reducing the number of cases classified as mixed subtype by WHO.
Cellular lineage of adenocarcinoma subtypes by FCT classification. Yatabe et al. ( 21 ) reported that in adenocarcinoma cases of the lung, TTF‐1 ≥50% positive reactivity was 72%, and that of ≤50% was 28%. These figures were almost the same as ours, 74% and 26%, respectively. Cell types were divided into three groups by positivity: (i) the hobnail cell type with very high positivity; (ii) the mixed, high; and (iii) the col/cub, po/ov, and goblet cells with relatively lower positivity. So the FCT classification also shows differences in cellular lineage expression. In considering histogenesis on the assumption that carcinoma cells imitate inherent characteristics of progenitor cells, almost all the hobnail cell type develop at SBP/TRU, the mixed type develop more distal bronchioles than that of the SBP/TRU, and other cell types develop near the junction of TTF‐1‐positive and ‐negative bronchioles or more proximal bronchioles, bronchi and bronchial glands.
Etiological differences of adenocarcinomas by FCTs. The results of this study for relationships of the hobnail and col/cub cell types with p53 mutations, their spectra (G→T TV attributed to direct mutagenic action of tobacco smoke components, and CpG→A TS ascribed to endogenous mechanisms( 15 , 24 , 25 )), and smoking status, are generally consistent with our previous study.( 1 ) Furthermore, the mixed cell type here showed low frequencies of p53 mutations and G→T TV and were found in non‐smokers, which was quite similar to hobnail cells but significantly different from the col/cub cell type. The mixed cell lesion should thus be classified into the same group as the hobnail type, despite differences in frequencies of CpG→A TS and deletions/insertions. These disparities may be related to differences in endogenous mechanisms underlying development.
In the po/ov cell type, the frequencies of p53 mutation and smokers were high, very similar to those of the col/cub cells, and the frequencies of other transitions and transversions or deletions/insertions were significantly different from those of hobnail or mixed cell types. So the po/ov cell type should be classified into the same group as the col/cub cell type. The goblet cell type was intermediate among them in relation to smoking. Thus, considering etiological factors, adenocarcinomas were divided into three groups by FCT classification: the col/cub and po/ov cell types probably caused by tobacco smoke, the hobnail and mixed cell types possibly due to endogenous mechanisms but weak association with tobacco carcinogens, and the goblet cell type intermediate among them. On the other hand, although the subtypes by WHO classification may reflect the p53 mutation frequency and smoking status to a certain extent, we could not find any distinct differences in the mutation spectra among the subtypes. It is thus relatively more difficult to use WHO subtypes to connect with etiological factors than using cell types.
Remarkable gene mutations by FCTs. p53 mutations and the mutation spectra and K‐ras mutations showed characteristic patterns depending on the cell type.( 1 , 16 , 26 ) In contrast, only p53 mutations rates were different among the subtypes of WHO classification. As for EGFR genes, frequencies of mutations in adenocarcinomas of the lung are higher for Japanese people (40–65%) than for those in Western countries (≤13%),( 9 , 27 , 28 , 29 ) being especially high in carcinomas with bronchioloalveolar features (over 50%).( 20 , 22 , 30 , 31 , 32 , 33 , 34 , 35 , 36 ) Our results showed similar mutation frequencies for Japanese, 42% for all cases and 60% for carcinomas with BA spread. We found that the hobnail cells were more closely associated with EGFR mutations compared with other cell types, with high significance. The same results were reported using different adenocarcinoma cases by Ninomiya.( 36 ) The variation we found between cell types with regard to EGFR mutations again points to the superiority of FCT classification over the WHO classification based on results of discriminant analysis. Since the presence of EGFR mutations significantly correlated with tumor sensitivity to tyrosine kinase (TK) inhibitors,( 28 , 29 , 37 , 38 ) FCT classification is more useful in selecting cases for TK inhibitor therapy than is the WHO classification.
Prognoses by morphological subtype and gene mutation status. Considering the WHO classification, only a few studies using modified WHO sub‐classifications have reported prognostic differences among subtypes.( 9 , 11 ) Using the FCT classification, however, significant differences in 5‐year survival rates are apparent. For example, prognosis with the hobnail cell type was better than for col/cub or goblet cell types in p‐stage I. As for differences between the hobnail and goblet cell types, all goblet cell tumors were localized with papillary, acinar, and/or BA spreading patterns and no intrapulmonary microscopic metastasis, so the differences may be partly due to the presence or absence of p53 and K‐ras mutations, both of which are considered to give aggressive growth potential to tumors, as noted below and already indicated in many papers.( 39 , 40 )
For the po/ov cell type, the prognosis of stages II–IV was comparable to that of stage I. To clarify the reason, we examined differences of case distributions between stages I and II–IV by sex, age, and smoking status, and p53, K‐ras, and EGFR mutation status: we found no significant differences between them in any category (data not shown). Furthermore, in p‐stages II–IV, the po/ov cell type had a better prognosis than did the col/cub. This contrasts with papers where patients with tumors having solid carcinoma with mucin component showed significantly worse survival compared with nonsolid subtypes in cases sub‐classified by the modified WHO classification. ( 9 , 11 ) There are some differences in the histological criteria used and p‐stages of analyzed cases between our paper and other papers, but the precise reasons for these differences remain unclear. Therefore, further examination of the prognosis of the po/ov cell type is warranted.
So far, the number of reports on the influence of multiple gene mutations on prognosis has been limited. In this study, considering six kinds of combinations of three genes, only one –p53 and K‐ras but not EGFR mutated – showed a worse prognosis, with significant differences, than most other combinations in p‐stage I, though this difference disappeared in more advanced stages. Furthermore, since the prognosis differed by cell type, we examined the effects of concurrent gene mutations in the hobnail cell type, and found the p53 mutation to be clearly associated with a worse prognosis. Taken together, we can hypothesize that p53 and K‐ras mutations in carcinomas result in a worse prognosis for patients, but may be obscured in advanced cases by many other factors associated with prognosis. ( 41 , 42 , 43 ) The EGFR mutation status was not linked with survival in this study or any other papers, ( 22 , 32 , 44 ) although a significant association was detected between poor prognosis and the presence of EGFR mutations in TRU‐type adenocarcinomas. ( 2 ) Therefore, further studies restricted to subtypes are certainly warranted.
Application of a new TNM staging system (NTNM) for lung cancer is planned in 2010. For N categories, however, a consensus on the handling of isolated tumor cells in a lymph node has not yet been reached among Japanese pathologists. So we revised only the T and M categories according to NTNM, and found that only eight cases converted from p‐stage I to p‐stage II. When prognoses by FTC or mutation status were analyzed with the present TNM and the NTNM, no differences were found between them. We suspect that cases for which we must change N categories would also be a small number. All results considered, we believe that the FTC combined with multiple gene mutation status appears to be useful in predicting the biological nature of pulmonary adenocarcinomas even in NTNM.
Disclosure Statement
The authors have no conflict of interest.
Supporting information
Fig. S1. Analysis of epidermal growth factor receptor (EGFR) exon 21 point mutation. (a) A loop‐hybrid band with exon 21 point mutation (arrow). (b) An electropherogram image of re‐amplified DNA extracted from the mutation band in (a). The upper band is due to heteroduplexes by normal alleles and internal deletion alleles from the LH‐G probe, the middle band to homoduplexes of mutant alleles (arrow), and the lower band to homoduplexes of internal deletion alleles. (c) DNA sequence electropherogram by direct sequencing of DNA extracted from the middle band in (b), illustrating an L858R mutation.
Table S1. p53, K‐ras, and epidermal growth factor receptor (EGFR) mutations in lung adenocarcinomas.
Please note: Wiley‐Blackwell are not responsible for the content or functionality of any supporting materials supplied by the authors. Any queries (other than missing material) should be directed to the corresponding author for the article.
Supporting info item
Supporting info item
Acknowledgment
This study was supported by Grants‐in‐Aid from the Ministry of Education, Science, Sports, Technology and Culture of Japan.
References
- 1. Hashimoto T, Tokuchi Y, Hayashi M et al. Different subtypes of human lung adenocarcinoma caused by different etiological factors. Am J Pathol 2000; 157: 2133–41. [DOI] [PMC free article] [PubMed] [Google Scholar]
- 2. Takeuchi T, Tomida S, Yatabe Y et al. Expression profile‐defined classification of lung adenocarcinoma shows close relationship with underlying major genetic changes and clinicopathologic behaviors. J Clin Oncol 2006; 24: 1679–88. [DOI] [PubMed] [Google Scholar]
- 3. Garber ME, Troyanskaya OG, Schluens K et al. Diversity of gene expression in adenocarcinoma of the lung. Proc Natl Acad Sci USA 2001; 98: 13784–9. [DOI] [PMC free article] [PubMed] [Google Scholar]
- 4. Beer DG, Kardia SLR, Huang CC et al. Gene‐expression profiles predict survival of patients with lung adenocarcinoma. Nat Med 2002; 8: 816–24. [DOI] [PubMed] [Google Scholar]
- 5. Yanagisawa K, Tomida S, Shimada Y, Yatabe Y, Mitsudomi T, Takahashi T. A 25‐signal proteomic signature and outcome for patients with resected non‐small‐cell lung cancer. J Natl Cancer Inst 2007; 99: 858–67. [DOI] [PubMed] [Google Scholar]
- 6. Sun Z, Yang P. Gene expression profiling on lung cancer outcome prediction: present clinical value and future premise. Cancer Epidemiol Biomarkers Prev 2006; 15: 2063–8. [DOI] [PubMed] [Google Scholar]
- 7. Ein‐Dor L, Zuk O, Domany E. Thousands of samples are needed to generate a robust gene list for predicting outcome in cancer. Proc Natl Acad Sci USA 2006; 103: 5923–8. [DOI] [PMC free article] [PubMed] [Google Scholar]
- 8. Shedden K, Taylor JM, Enkemann SA et al. Gene expression‐based survival prediction in lung adenocarcinoma: a multi‐site, blinded validation study. Nat Med 2008; 14: 822–7. [DOI] [PMC free article] [PubMed] [Google Scholar]
- 9. Motoi N, Szoke J, Riely GJ et al. Lung adenocarcinoma: modification of the 2004 WHO mixed subtype to include the major histologic subtype suggests correlations between papillary and micropapillary adenocarcinoma subtypes, EGFR mutations and gene expression analysis. Am J Surg Pathol 2008; 32: 810–27. [DOI] [PubMed] [Google Scholar]
- 10. Travis WD, Colby TV, Corrin B, Shimosato Y, Brambilla E, Sobin LH. Histological Typing of Lung and Pleural Tumours, 3rd edn. New York: Springer‐Verlag, 1999. [Google Scholar]
- 11. Riquet M, Foucault C, Berna P, Assouad J, Dujon A, Danel C. Prognostic value of histology in resected lung cancer with emphasis on the relevance of the adenocarcinoma subtyping. Ann Thorac Surg 2006; 81: 1988–95. [DOI] [PubMed] [Google Scholar]
- 12. Sørlie T, Perou CM, Tibshirani R et al. Gene expression patterns of breast carcinomas distinguish tumor subclasses with clinical implications. Proc Natl Acad Sci U S A 2001; 98: 10869–74. [DOI] [PMC free article] [PubMed] [Google Scholar]
- 13. Perou CM, Sørlie T, Eisen MB et al. Molecular portraits of human breast tumours. Nature 2000; 406: 747–52. [DOI] [PubMed] [Google Scholar]
- 14. UICC . TNM Classification of Malignant Tumours, 5th and 6th edn. Geneva: UICC, 1997. and 2002. [Google Scholar]
- 15. Shimmyo T, Okada A, Hashimoto T et al. Etiologic value of p53 mutation spectra and differences with histology in lung cancers. Cancer Sci 2008; 99: 287–95. [DOI] [PMC free article] [PubMed] [Google Scholar]
- 16. Tsuchiya E, Furuta R, Wada N et al. High K‐ras mutation rates in goblet‐cell‐type adenocarcinomas of the lungs. J Cancer Res Clin Oncol 1995; 121: 577–81. [DOI] [PubMed] [Google Scholar]
- 17. Hashimoto T, Kobayashi Y, Ishikawa Y et al. Prognostic value of genetically diagnosed lymph node micrometastasis in non‐small cell lung carcinoma cases. Cancer Res 2000; 60: 6472–8. [PubMed] [Google Scholar]
- 18. Matsukuma S, Yoshihara M, Kasai F et al. Rapid and simple detection of hot spot point mutations of epidermal growth factor receptor, BRAF, and NRAS in cancers using the loop‐hybrid mobility shift assay. J Mol Diagn 2006; 8: 504–12. [DOI] [PMC free article] [PubMed] [Google Scholar]
- 19. Oshita F, Matsukuma S, Yoshihara M et al. Novel heteroduplex method using small cytology specimens with a remarkably high success rate for analysing EGFR gene mutations with a significant correlation to gefitinib efficacy in non‐small‐cell lung cancer. Br J Cancer 2006; 95: 1070–5. [DOI] [PMC free article] [PubMed] [Google Scholar]
- 20. Sakuma Y, Matsukuma S, Yoshihara M et al. Distinctive evaluation of nonmucinous and mucinous subtypes of bronchioloalveolar carcinomas in EGFR and K‐ras gene‐mutation analyses for Japanese lung adenocarcinomas: confirmation of the correlations with histologic subtypes and gene mutations. Am J Clin Pathol 2007; 128: 100–8. [DOI] [PubMed] [Google Scholar]
- 21. Yatabe Y, Mitsudomi T, Takahashi T. TTF‐1 expression in pulmonary adenocarcinomas. Am J Surg Pathol 2002; 26: 767–73. [DOI] [PubMed] [Google Scholar]
- 22. Kosaka T, Yatabe Y, Endoh H, Kuwano H, Takahashi T, Mitsudomi T. Mutations of the epidermal growth factor receptor gene in lung cancer: biological and clinical implications. Cancer Res 2004; 64: 8919–23. [DOI] [PubMed] [Google Scholar]
- 23. Mounawar M, Mukeria A, Calvez FL et al. Patterns of EGFR, HER2, TP53, and KRAS mutations of p14arf expression in non‐small cell lung cancers in relation to smoking history. Cancer Res 2007; 67: 5667–72. [DOI] [PubMed] [Google Scholar]
- 24. Greenblatt MS, Bennett WP, Hollstein M, Harris CC. Mutation in the p53 tumor suppressor gene: clues to cancer etiology and molecular pathogenesis. Cancer Res 1994; 54: 4855–78. [PubMed] [Google Scholar]
- 25. Shimmyo T, Hashimoto T, Kobayashi Y et al. p53 mutation spectra for squamous cell carcinomas at different levels of human bronchial branches. Int J Cancer 2006; 119: 501–7. [DOI] [PubMed] [Google Scholar]
- 26. Cooper CA, Carey FA, Bubb VJ, Lamb D, Kerr KM, Wyllie AH. The pattern of K‐ras mutation in pulmonary adenocarcinoma defines a new pathway of tumour development in the human lung. J Pathol 1997; 181: 401–4. [DOI] [PubMed] [Google Scholar]
- 27. Marchetti A, Martella C, Felicioni L et al. EGFR mutations in non‐small‐cell lung cancer: analysis of a large series of cases and development of a rapid and sensitive method for diagnostic screening with potential implications on pharmacologic treatment. J Clin Oncol 2005; 23: 857–65. [DOI] [PubMed] [Google Scholar]
- 28. Paez JG, Janne PA, Lee JC et al. EGFR mutations in lung cancer: correlation with clinical response to gefitinib therapy. Science 2004; 304: 1497–500. [DOI] [PubMed] [Google Scholar]
- 29. Lynch TJ, Bell DW, Sordella R et al. Activating mutations in the epidermal growth factor receptor underlying responsiveness of non‐small‐cell lung cancer to gefitinib. N Engl J Med 2004; 350: 2129–39. [DOI] [PubMed] [Google Scholar]
- 30. Yatabe Y, Kosaka T, Takahashi T, Mitsudomi T. EGFR mutation is specific for terminal respiratory unit type adenocarcinoma. Am J Surg Pathol 2005; 29: 633–9. [DOI] [PubMed] [Google Scholar]
- 31. Miller VA, Kris MG, Shah N et al. Bronchioloalveolar pathologic subtype and smoking history predict sensitivity to Gefitinib in advanced non‐small‐cell lung cancer. J Clin Oncol 2004; 22: 1103–9. [DOI] [PubMed] [Google Scholar]
- 32. Sasaki H, Shimizu S, Endo K et al. EGFR and ErbB2 mutation status in Japanese lung cancer patients. Int J Cancer 2006; 118: 180–4. [DOI] [PubMed] [Google Scholar]
- 33. Haneda H, Sasaki H, Shimizu S et al. Epidermal growth factor receptor gene mutation defines distinct subsets among small adenocarcinomas of the lung. Lung Cancer 2006; 52: 47–52. [DOI] [PubMed] [Google Scholar]
- 34. Mitsudomi T, Kosaka T, Endoh H et al. Mutations of the epidermal growth factor receptor gene predict prolonged survival after Gefitinib treatment in patients with non‐small‐cell lung cancer with postoperative recurrence. J Clin Oncol 2005; 23: 2513–20. [DOI] [PubMed] [Google Scholar]
- 35. Shigematsu H, Gazdar AF. Somatic mutations of epidermal growth factor receptor signaling pathway in lung cancers. Int J Cancer 2006; 118: 257–62. [DOI] [PubMed] [Google Scholar]
- 36. Ninomiya H, Hiramatsu M, Inamura K et al. Correlation between morphology and EGFR mutations in lung adenocarcinomas. Significance of the micropapillary pattern and the hobnail cell type. Lung Cancer 2009; 63: 235–40. [DOI] [PubMed] [Google Scholar]
- 37. Kondo M, Yokoyama T, Fukui T et al. Mutations of epidermal growth factor receptor of non‐small cell lung cancer were associated with sensitivity to gefitinib in recurrence after surgery. Lung Cancer 2005; 50: 385–91. [DOI] [PubMed] [Google Scholar]
- 38. Taron M, Ichinose Y, Rosell R et al. Activating mutations in the tyrosine kinase domain of the epidermal growth factor receptor are associated with improved survival in gefitinib‐treated chemorefractory lung adenocarcinomas. Clin Cancer Res 2005; 11: 5878–85. [DOI] [PubMed] [Google Scholar]
- 39. Huang CL, Taki T, Adachi M et al. Mutations of p53 and K‐ras genes as prognostic factors for non‐small cell lung cancer. Int J Oncol 1998; 12: 553–63. [DOI] [PubMed] [Google Scholar]
- 40. Fukuyama Y, Mitsudomi T, Sugio K, Ishida T, Akazawa K, Sugimachi K. K‐ras and p53 mutations are an unfavourable prognostic indicator in patients with non‐small‐cell lung cancer. Br J Cancer 1997; 75: 1125–30. [DOI] [PMC free article] [PubMed] [Google Scholar]
- 41. Mitsudomi T, Hamajima N, Ogawa M, Takahashi T. Prognostic significance of p53 alterations in patients with non‐small cell lung cancer: a meta‐analysis. Clin Cancer Res 2000; 6: 4055–63. [PubMed] [Google Scholar]
- 42. Slebos RJC, Kibbelaar RE, Dalesio O et al. K‐ras oncogene activation as a prognostic marker in adenocarcinoma of the lung. N Engl J Med 1990; 323: 561–5. [DOI] [PubMed] [Google Scholar]
- 43. Ahrendt SA, Hu Y, Buta M et al. p53 mutations and survival in stage I non‐small‐cell lung cancer: results of a prospective study. J Natl Cancer Inst 2003; 95: 961–70. [DOI] [PubMed] [Google Scholar]
- 44. Shigematsu H, Lin L, Takahashi T et al. Clinical and biological features associated with epidermal growth factor receptor gene mutations in lung cancers. J Natl Cancer Inst 2005; 97: 339–46. [DOI] [PubMed] [Google Scholar]
Associated Data
This section collects any data citations, data availability statements, or supplementary materials included in this article.
Supplementary Materials
Fig. S1. Analysis of epidermal growth factor receptor (EGFR) exon 21 point mutation. (a) A loop‐hybrid band with exon 21 point mutation (arrow). (b) An electropherogram image of re‐amplified DNA extracted from the mutation band in (a). The upper band is due to heteroduplexes by normal alleles and internal deletion alleles from the LH‐G probe, the middle band to homoduplexes of mutant alleles (arrow), and the lower band to homoduplexes of internal deletion alleles. (c) DNA sequence electropherogram by direct sequencing of DNA extracted from the middle band in (b), illustrating an L858R mutation.
Table S1. p53, K‐ras, and epidermal growth factor receptor (EGFR) mutations in lung adenocarcinomas.
Please note: Wiley‐Blackwell are not responsible for the content or functionality of any supporting materials supplied by the authors. Any queries (other than missing material) should be directed to the corresponding author for the article.
Supporting info item
Supporting info item